. 2018 Oct 15;29(21):2553-2565.
doi: 10.1091/mbc.E18-05-0291. Epub 2018 Aug 22.

In vivo analysis of outer arm dynein transport reveals cargo-specific intraflagellar transport properties

Affiliations

In vivo analysis of outer arm dynein transport reveals cargo-specific intraflagellar transport properties

Jin Dai et al. Mol Biol Cell. .

Abstract

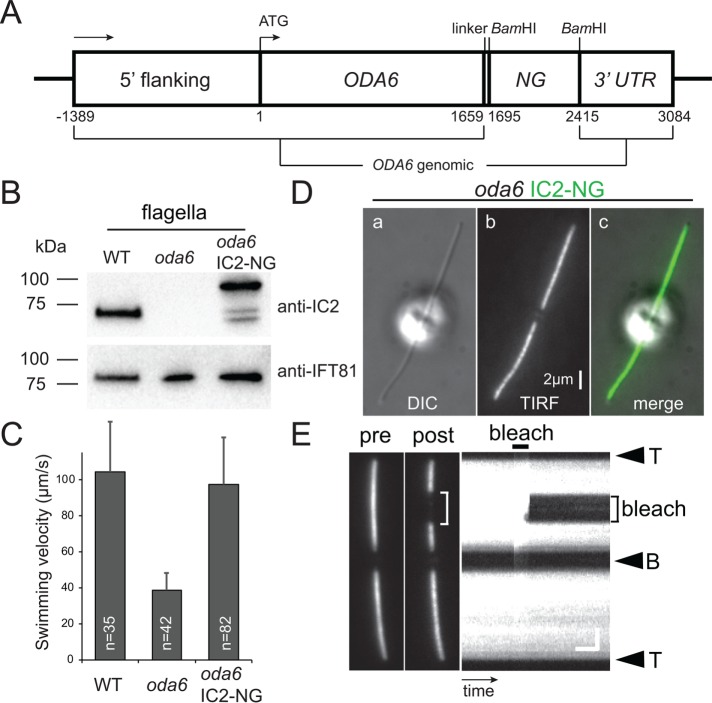
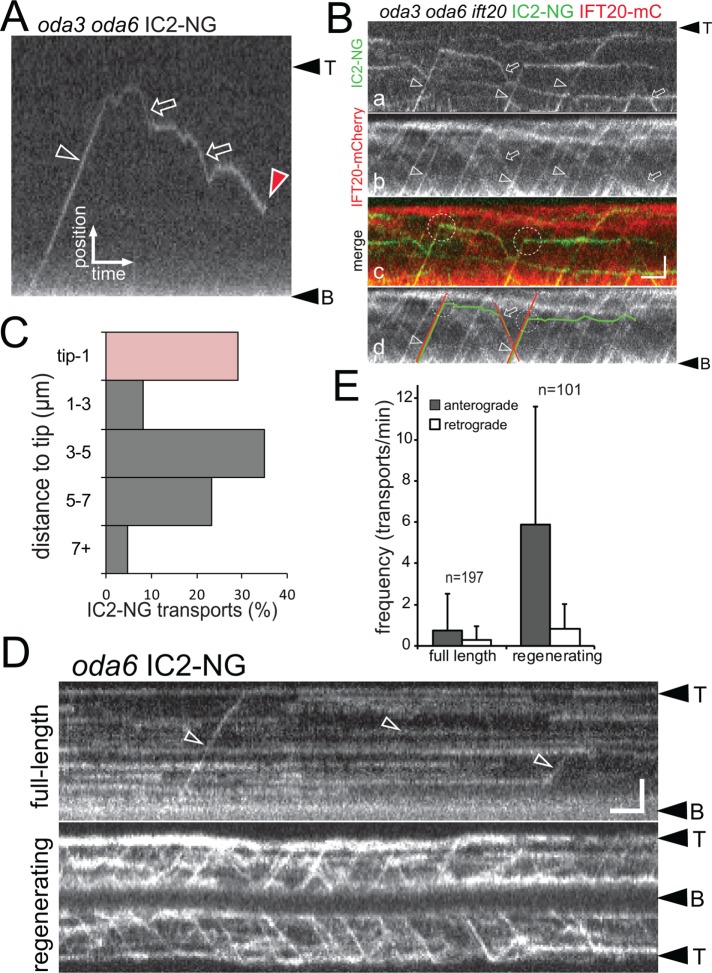
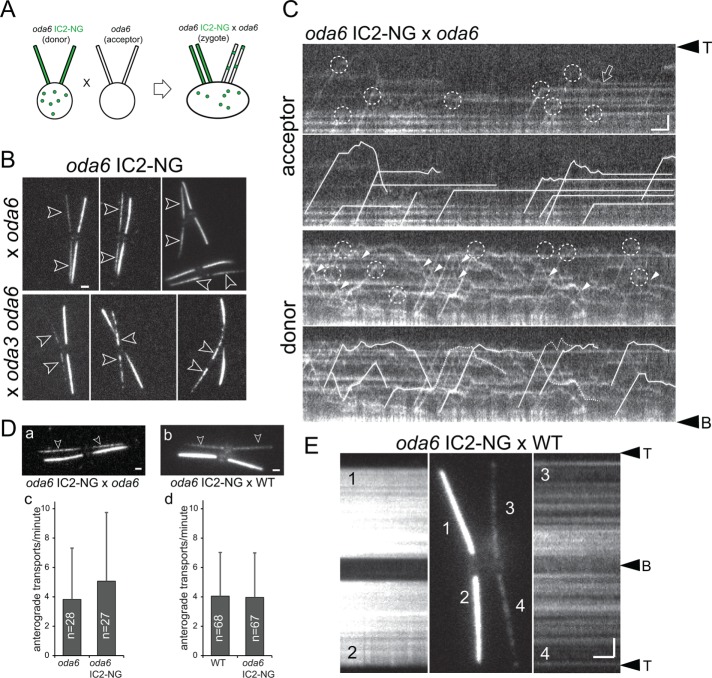
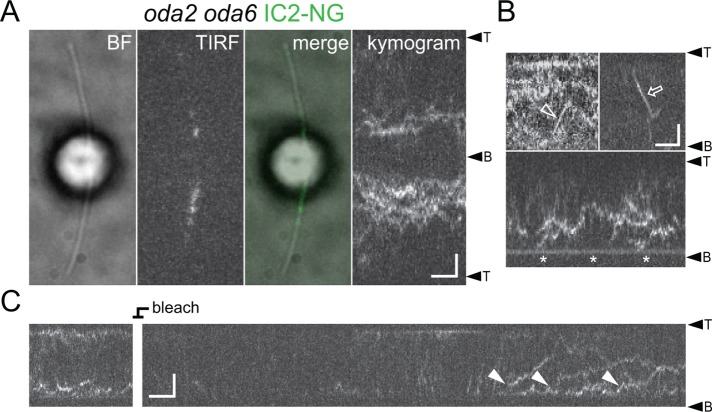
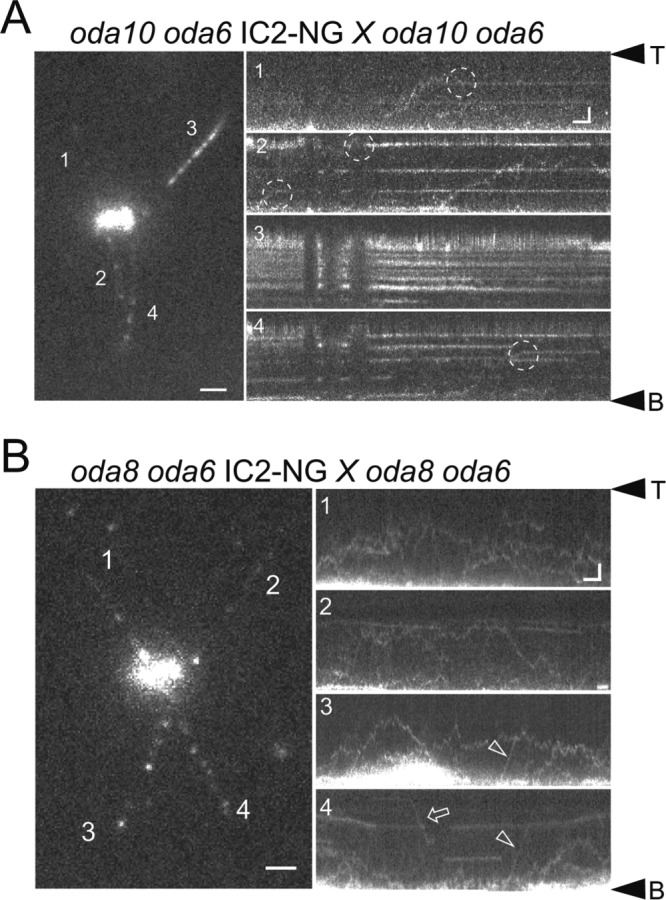
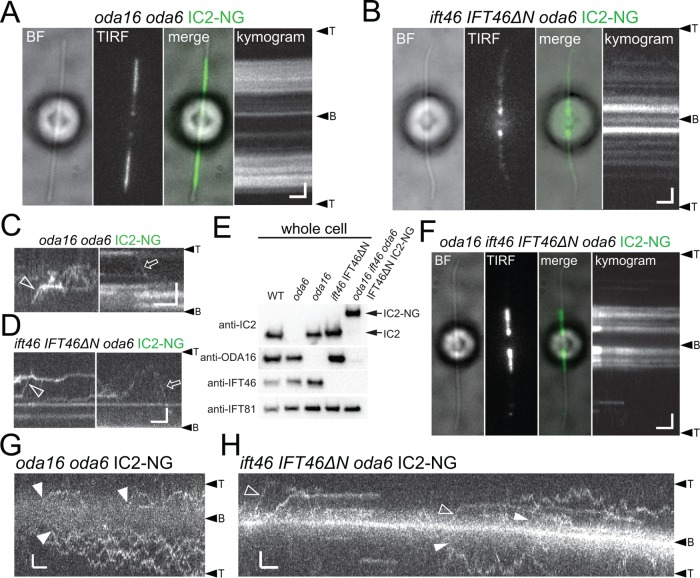
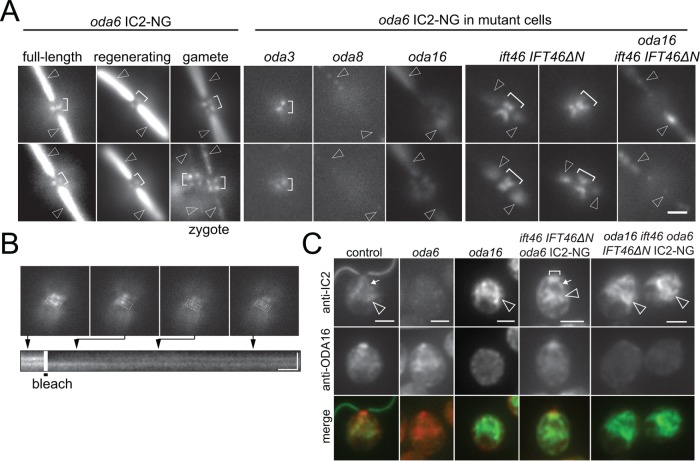
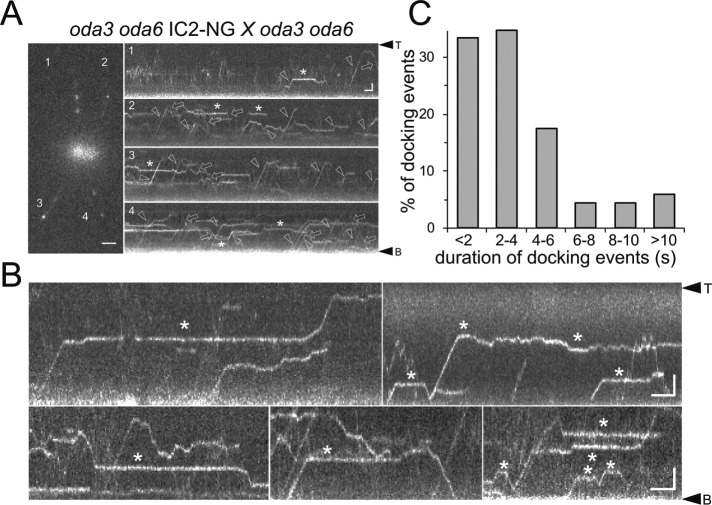
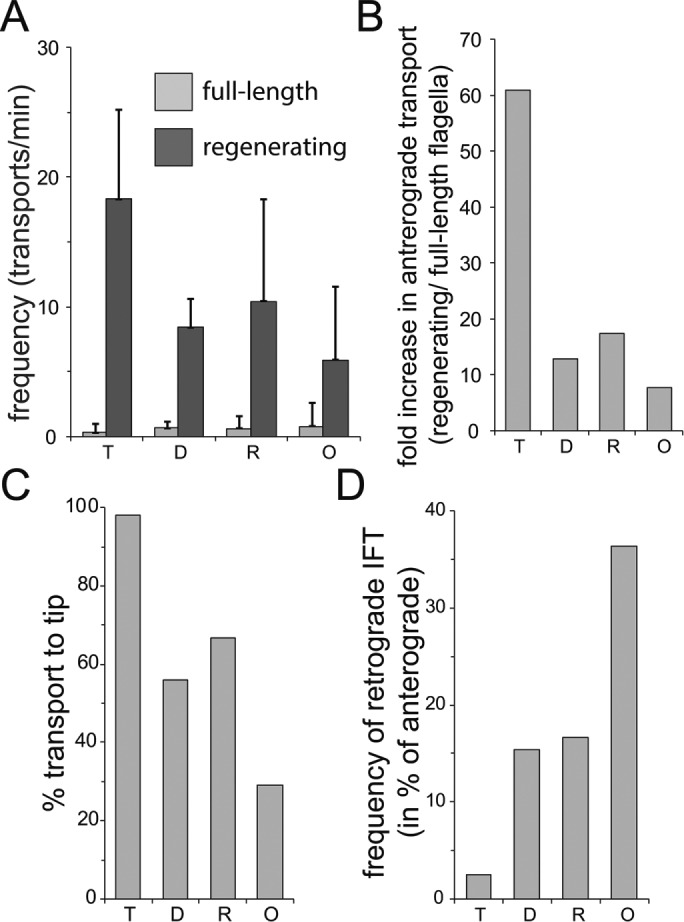
Outer dynein arms (ODAs) are multiprotein complexes that drive flagellar beating. Based on genetic and biochemical analyses, ODAs preassemble in the cell body and then move into the flagellum by intraflagellar transport (IFT). To study ODA transport in vivo, we expressed the essential intermediate chain 2 tagged with mNeonGreen (IC2-NG) to rescue the corresponding Chlamydomonas reinhardtii mutant oda6. IC2-NG moved by IFT; the transport was of low processivity and increased in frequency during flagellar growth. As expected, IFT of IC2-NG was diminished in oda16, lacking an ODA-specific IFT adapter, and in ift46 IFT46ΔN lacking the ODA16-interacting portion of IFT46. IFT loading appears to involve ODA16-dependent recruitment of ODAs to basal bodies followed by handover to IFT. Upon unloading from IFT, ODAs rapidly docked to the axoneme. Transient docking still occurred in the docking complex mutant oda3 indicating that the docking complex stabilizes rather than initiates ODA-microtubule interactions. In full-length flagella, ODAs continued to enter and move inside cilia by short-term bidirectional IFT and diffusion and the newly imported complexes frequently replaced axoneme-bound ODAs. We propose that the low processivity of ODA-IFT contributes to flagellar maintenance by ensuring the availability of replacement ODAs along the length of flagella.


Figures

FIGURE 1:
FIGURE 1:
IC2-NG rescues the oda6 mutant. (A) Schematic presentation of the IC2-NG expression vector. The sequence for NG was inserted at the 3′ end of the genomic ODA6 coding region. (B) Western blot of isolated flagella from wild type, the oda6 mutant, and the oda6 IC2-NG rescue strain probed with antibodies against IC2 and IFT81 as a loading control. (C) Mean swimming velocity of wild type, oda6, and oda6 IC2-NG strains. Error bars represent SD. n, number of cells analyzed. (D) Differential interference contrast (DIC) (a), TIRF (b), and the corresponding merged image (c) of a live oda6 IC2-NG cell. Bar = 2 μm. (E) TIRF image of a live oda6 IC2-NG cell before and ∼10 s after bleaching of a flagellar segment, and the corresponding kymogram. The experiment demonstrates that most IC2-NG is stably anchored in the flagellum. The flagellar tip (T) and base (B) are indicated. Bars = 2 μm and 2 s.
FIGURE 2:
FIGURE 2:
IC2-NG is transported by IFT. (A) Kymogram showing anterograde (open arrowhead) and retrograde (open arrows) transport of IC2-NG in full-length oda3 oda6 flagella. Red arrowhead, one-step bleaching of the IC2-NG particle indicative for a single NG protein. Bars = 2 μm and 2 s. (B) Kymograms showing simultaneous two-color imaging of IC2-NG (a) and IFT20-mCherry (b) in oda3 oda6 ift20 flagella. A merged imaging is shown in c, and the trajectories of two transports are marked in d. Arrowheads and arrows mark anterograde and retrograde cotransport of IC2-NG and IFT20-mCherry; dashed circles indicate unloading of IC2-NG. Bars = 2 μm and 2 s. (C) Distribution of IC2-NG unloading from anterograde IFT expressed in distance from the flagellar tip. (D) Kymograms depicting IC2-NG in fully grown (top) and regenerating (bottom) oda6 flagella; flagella were partially photobleached before the recording. Open arrowheads, anterograde transports. Bars = 2 μm and 2 s. (E) The frequencies of anterograde and retrograde transport of IC2-NG in full-length and regenerating oda6 flagella. Two-tailed t test resulted in p < 0.0001 for the frequencies of anterograde IC2-NG transport in full-length vs. regenerating flagella and a low significance score of p = 0.051 for the retrograde transport frequencies. Error bars indicate SD; n, number of cilia analyzed.
FIGURE 3:
FIGURE 3:
ODAs dock rapidly to the axoneme after unloading from IFT. (A) Schematic presentation of a dikaryon rescue experiment by mating donor gametes expressing IC2-NG (green) to oda6 acceptor gametes lacking IC2 or IC2-NG. After cell fusion, IC2-NG present in the shared cytoplasm is available for transport into the mutant-derived flagella. (B) TIRF images of live zygotes from a mating between oda6 IC2-NG with either the oda6 single or oda3 oda6 double mutant. IC2-NG is added simultaneously along oda6 flagella and with a proximal–distal gradient in oda3 oda6 flagella. Bar = 2 μm. (C) Kymograms of the acceptor and donor flagella of oda6 × oda6 IC2-NG zygotes; the flagella were photobleached to allow imaging of moving IC2-NG complexes. The kymograms are shown in duplicate: in the top panels, unloading events are marked by dashed circles; in the bottom panels, individual particles are traced (dashed lines indicate uncertainty). In the oda6-derived flagella, unloading is followed by docking as indicated by the lack of movement. Open arrow: IC2-NG docking event after a brief period of diffusion. Note frequent wide distribution of unloading sites along the length of the flagella, docking of IC2-NG in the acceptor flagella (top panels), and extended periods of diffusion and frequent retrograde IFT (closed arrowheads) of IC2-NG when unloaded in donor-cell–derived flagella with occupied docking sites (bottom panels). Bars = 2 μm and 2 s. (D) Still images (a,b) and anterograde transport frequency (c, d) of IC2-NG in flagella of oda6 IC2-NG × oda6 and oda6 IC2-NG × WT zygotes. (E) TIRF images and corresponding kymograms of an oda6 IC2-NG × WT zygote analyzed ∼3.5 h after mixing of the gametes. Bar = 2 μm and 2 s.
FIGURE 4:
FIGURE 4:
IFT and axonemal docking of IC2-NG is diminished in oda2. (A) Bright-field (BF), TIRF and merged image, and the corresponding kymogram of an oda2 oda6 IC2-NG cell. Bars = 2 μm and 2 s. (B) Gallery of kymograms showing IFT (open arrow and arrowhead) and docking near the flagellar base (asterisk) of IC2-NG in oda2 flagella. Bars = 2 μm and 2 s. (C) Kymogram showing incompletely assembled ODA containing IC2-NG diffusing into the oda2 flagellum (closed arrowheads). The IC2-NG signals inside the flagellum were first photobleached to distinguish new entry events. Bars = 2 μm and 2 s.
FIGURE 5:
FIGURE 5:
Transport and axonemal docking of ODAs are impaired in oda8. (A) Still image (four-frame average) and kymograms (1–4) of an oda10 oda6 × oda10 oda6 IC2-NG zygote. The kymograms are numbered correspondingly to the flagella in the still image. Dashed circle, putative docking event. Bars = 2 μm and 2 s. (B) Still image and kymograms of an oda8 oda6 × oda8 oda6 IC2-NG zygote. Bars = 2 μm and 2 s. Anterograde (arrowheads) and retrograde (arrows) IFT are marked. Note extended diffusion of ODAs in oda8 while most ODAs are stationary in oda10.
FIGURE 6:
FIGURE 6:
Distinct distribution of IC2-NG in oda16 and ift46 IFT46ΔN flagella. (A) BF and TIRF image and the corresponding kymogram of a live oda16 oda6 IC2-NG cell. (B) BF and TIRF image and the corresponding kymogram of a live ift46 IFT46ΔN oda6 IC2-NG cell. (C) Gallery of kymograms showing sporadic IFT (open arrow and arrowhead) of IC2-NG in oda16 oda6 IC2-NG flagella. (D) Gallery of kymograms showing sporadic IFT (open arrow and arrowhead) of IC2-NG in ift46 IFT46ΔN oda6 IC2-NG flagella. Bars (A–D) = 2 μm and 2 s. (E) Western blot analysis of whole cell extracts from the strains indicated documenting the generation of the oda16 ift46 oda6 IFT46ΔN IC2-NG quintuple strain. Note that the antibody raised against the head domain of IFT46 will not react with IFT46ΔN. (F) BF and TIRF image and the corresponding kymogram of a live oda16 ift46 oda6 IFT46ΔN IC2-NG cell. Bars = 2 μm and 2 s. (G) Kymograms showing the entry of IC2-NG into photobleached oda16 oda6 IC2-NG flagella by apparent diffusion (closed arrowheads). Bars = 2 μm and 2 s. (H) Kymograms showing the entry of IC2-NG into photobleached ift46 IFT46ΔN oda6 IC2-NG flagella by IFT (open arrowheads) and apparent diffusion (closed arrowheads). Bars = 2 μm and 2 s.
FIGURE 7:
FIGURE 7:
ODA16-dependent recruitment of IC2-NG to the flagellar basal bodies. (A) Image gallery showing IC2-NG at the flagellar base. Note that the signals are offset from the axis of the two flagella suggesting a position adjacent to the flagella-bearing basal bodies. Shown are IC2-NG in oda6 cells with regenerating and full-length flagella and in gametes, in oda6 × WT zygotes, in oda3 oda6, oda8 oda6, oda16 oda6, ift46 IFT46ΔN oda6, and oda16 ift46 IFT46ΔN oda6 cells. Brackets, IC2-NG signals near the basal bodies; arrowheads, flagella. Bar = 2 μm. (B) Fluorescence recovery after photobleaching analysis of IC2-NG near the basal bodies in an ift46 IFT46ΔN oda6 IC2-NG cell. Top: Still images of the cell before and after bleach of a portion of the IC2-NG pool and during recovery of the signal. Bottom: Kymogram corresponding to the boxed area showing signal recovery. Bars = 2 μm and 2 s. (C) Gallery of methanol-fixed cells of the strains indicated stained with antibodies to IC2 and ODA16; merged images are shown in the bottom row. Bracket, IC2-NG accumulation near the basal bodies; small arrow, elongated root-like signals of IC2-NG; arrowheads, accumulations of IC2-NG in the cell body. Bar = 2 μm.
FIGURE 8:
FIGURE 8:
ODAs transiently dock in oda3 flagella. (A) Still image and kymograms (1–4) of an oda3 oda6 × oda3 oda6 IC2-NG zygote. Arrows, retrograde transport; arrowheads, anterograde transports; asterisks, transiently stationary particles. Bars = 2 μm and 2 s. (B) Kymograms showing transient docking events of IC2-NG. Bars = 2 μm and 2 s. (C) Distribution of the duration of ODA transient docking events in oda3 flagella (n = 69 docking events).
FIGURE 9:
FIGURE 9:
Axonemal proteins show distinct transport characteristics. Analysis of transport data for GFP-tagged tubulin (T), DRC4 (D), RSP4 (R), and IC2 (O). (A) Frequency of anterograde transport in full-length and regenerating flagella. (B) Ratio of the anterograde transport frequencies between regenerating and full-length flagella. (C) Share of transports that move processively from the flagellar base to the tip. The data for tubulin (T) are in parts based on regenerating flagella because its transport frequency is low in full-length flagella. (D) Frequency of retrograde transports expressed in % of the frequency of anterograde transports.

References

    1. Ahmed NT, Gao C, Lucker BF, Cole DG, Mitchell DR. (2008). ODA16 aids axonemal outer row dynein assembly through an interaction with the intraflagellar transport machinery. J Cell Biol , 313–322. - PMC - PubMed
    1. Ahmed NT, Mitchell DR. (2005). ODA16p, a Chlamydomonas flagellar protein needed for dynein assembly. Mol Biol Cell , 5004–5012. - PMC - PubMed
    1. Bhogaraju S, Cajanek L, Fort C, Blisnick T, Weber K, Taschner M, Mizuno N, Lamla S, Bastin P, Nigg EA, Lorentzen E. (2013). Molecular basis of tubulin transport within the cilium by IFT74 and IFT81. Science , 1009–1012. - PMC - PubMed
    1. Bower R, Tritschler D, Vanderwaal K, Perrone CA, Mueller J, Fox L, Sale WS, Porter ME. (2013). The N-DRC forms a conserved biochemical complex that maintains outer doublet alignment and limits microtubule sliding in motile axonemes. Mol Biol Cell , 1134–1152. - PMC - PubMed
    1. Brokaw CJ. (1994). Control of flagellar bending: a new agenda based on dynein diversity. Cell Motil Cytoskeleton , 199–204. - PubMed

Publication types