. 2018 Aug 22;13(8):e0201469.
doi: 10.1371/journal.pone.0201469. eCollection 2018.

Patient-specific anatomical model for deep brain stimulation based on 7 Tesla MRI

Affiliations

Patient-specific anatomical model for deep brain stimulation based on 7 Tesla MRI

Yuval Duchin et al. PLoS One. .

Abstract

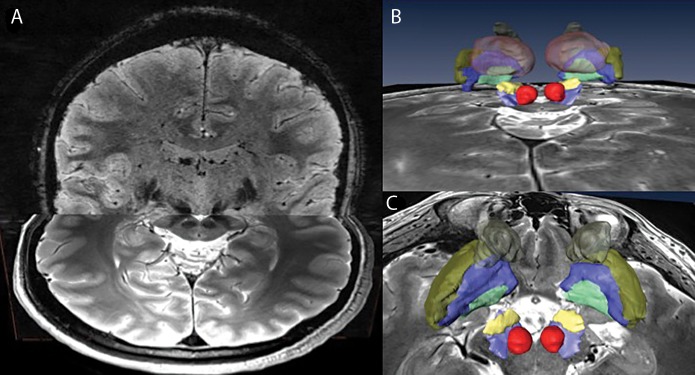
Objective: Deep brain stimulation (DBS) requires accurate localization of the anatomical target structure, and the precise placement of the DBS electrode within it. Ultra-high field 7 Tesla (T) MR images can be utilized to create patient-specific anatomical 3D models of the subthalamic nuclei (STN) to enhance pre-surgical DBS targeting as well as post-surgical visualization of the DBS lead position and orientation. We validated the accuracy of the 7T imaging-based patient-specific model of the STN and measured the variability of the location and dimensions across movement disorder patients.

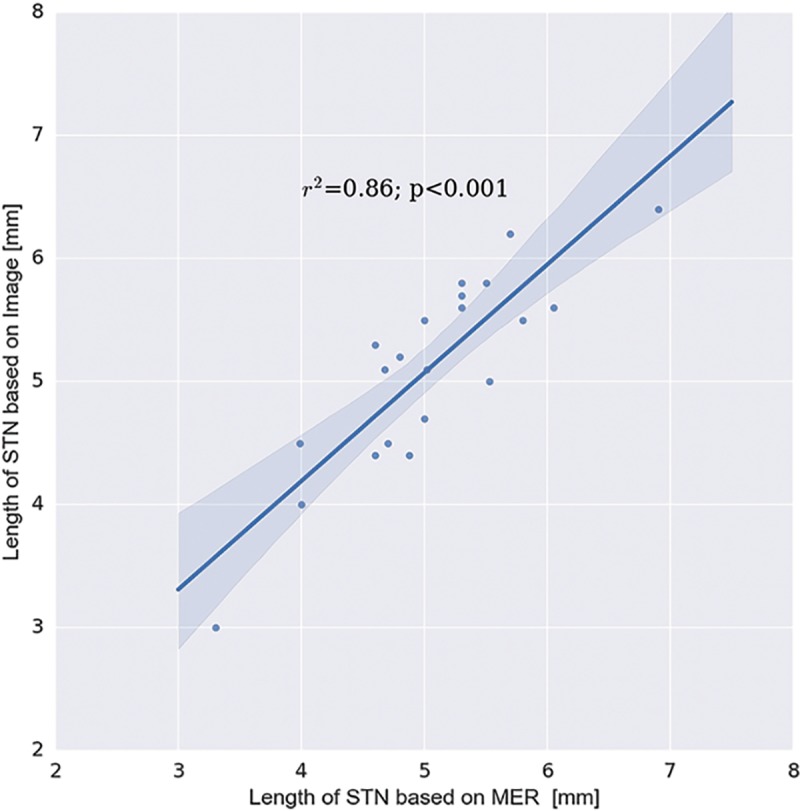
Methods: 72 patients who underwent DBS surgery were scanned preoperatively on 7T MRI. Segmentations and 3D volume rendering of the STN were generated for all patients. For 21 STN-DBS cases, microelectrode recording (MER) was used to validate the segmentation. For 12 cases, we computed the correlation between the overlap of the STN and volume of tissue activated (VTA) and the monopolar review for a further validation of the model's accuracy and its clinical relevancy.

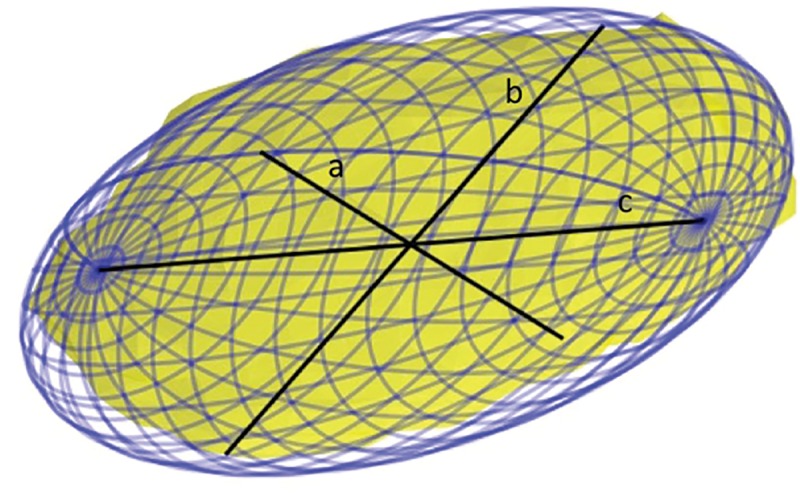
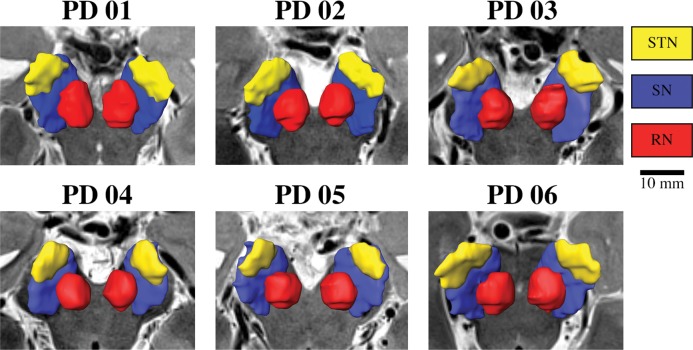
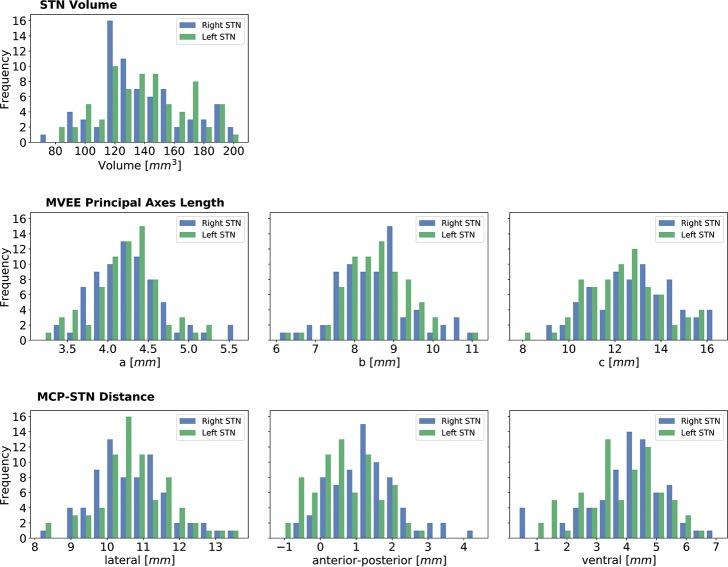
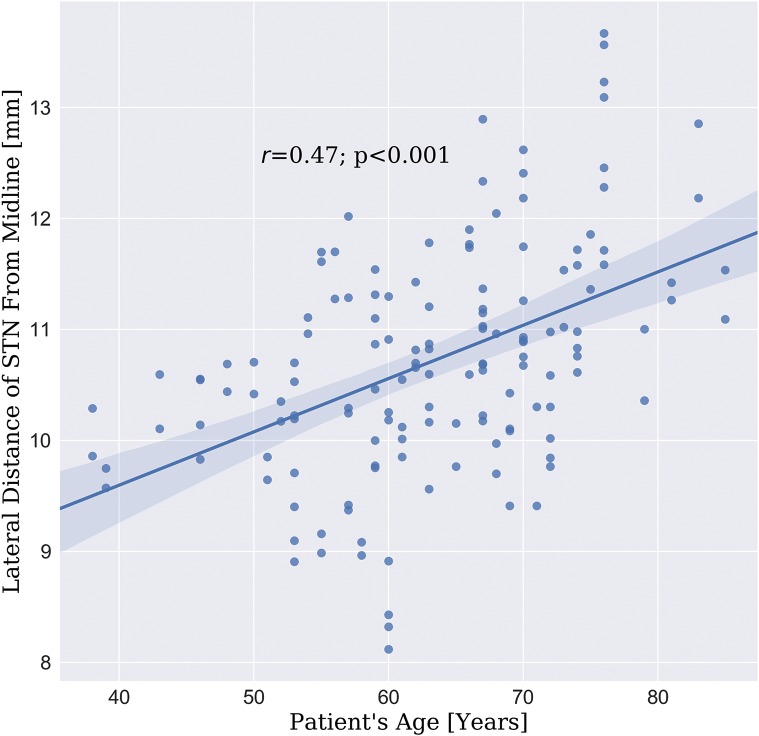
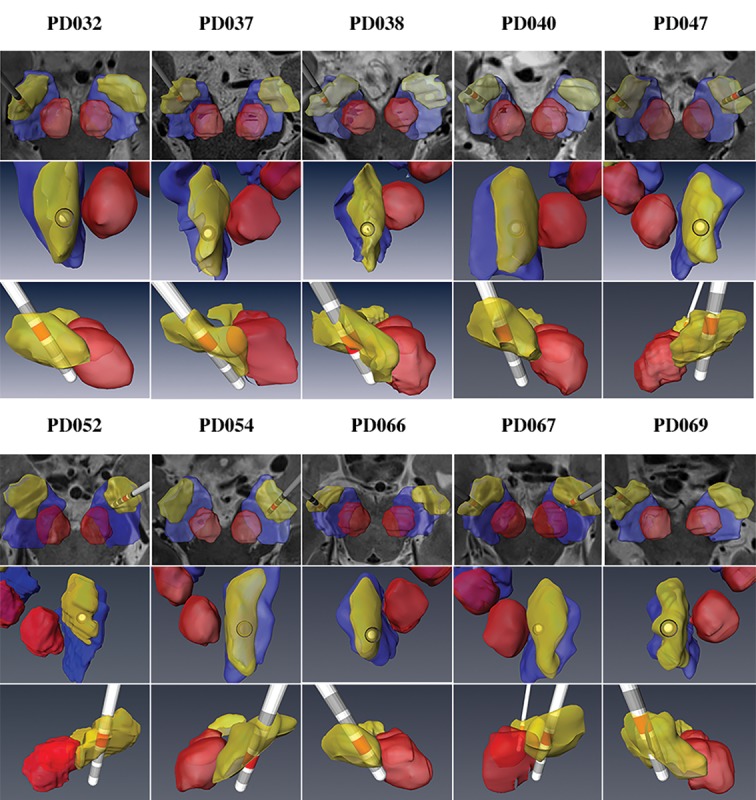
Results: We successfully reconstructed and visualized the STN in all patients. Significant variability was found across individuals regarding the location of the STN center of mass as well as its volume, length, depth and width. Significant correlations were found between MER and the 7T imaging-based model of the STN (r = 0.86) and VTA-STN overlap and the monopolar review outcome (r = 0.61).

Conclusion: The results suggest that an accurate visualization and localization of a patient-specific 3D model of the STN can be generated based on 7T MRI. The imaging-based 7T MRI STN model was validated using MER and patient's clinical outcomes. The significant variability observed in the STN location and shape based on a large number of patients emphasizes the importance of an accurate direct visualization of the STN for DBS targeting. An accurate STN localization can facilitate postoperative stimulation parameters for optimized patient outcome.


Conflict of interest statement

Yuval Duchin, Reuben R Shamir and Jinyoung Kim are employees of Surgical Information Sciences. Remi Patriat, Jerrold L. Vitek, Guillermo Sapiro and Noam Harel are shareholders of Surgical Information Sciences. This does not alter our adherence to PLOS ONE policies on sharing data and materials.

Figures

Fig 1
Fig 1. Sub-cortical anatomical structures on High-resolution 7T MR images.
High-resolution 7T images are used for visualizing sub-cortical anatomical structures. As an example, the subthalamic nuclei (STN) and substantia nigra (SN) are identified on a coronal view using susceptibility-weighted imaging (SWI) contrast. Note the clear image-contrast separation between the SN and STN that allow segmentation of those structures with high confidence.
Fig 2
Fig 2. Patient-specific 3D model of multiple sub-cortical structures.
Combined high-resolution and SNR 7T dataset consisting of multiple imaging contrasts and orientations (A) facilitates the creation of a full patient-specific anatomical model of the basal ganglia (B; back view) and (C; top view). The structures segmented here are: RN (red), SN (light blue), STN (yellow), GPi (green), GPe (blue), Putamen (gold) and Caudate (brown).
Fig 3
Fig 3. An example of minimum volume enclosing ellipsoid (MVEE) of a segmented STN volume.
The MVEE (blue mesh) principal axis: length (c), depth (b) and width (a) are depicted as a solid black line. Note that a very small portion of the STN (surface in yellow) is outside of the MVEE due to the error tolerance set in the algorithm (0.001 in this case). This tolerance reduces the effect of outlier points on the final MVEE parameters.
Fig 4
Fig 4. Example of anatomical 3D reconstruction of the STN, SN and Red nuclei.
Anatomical 3D reconstruction of the STN, SN and Red nuclei of six different patients imaged with 7T MRI. Note the variability in the shape, size and location of the structures across individuals.
Fig 5
Fig 5. Variability analysis of the STN structure (N = 144).
The first row shows the volume distribution of the STN. The second row depicts the distribution of the STN dimensions as estimated by MVEE principal axes. The third row depicts the distribution of the STN center of mass location relative to MCP. The results are in agreement with previous findings [1,24]. Note that previous studies measured the STN dimensions visually on MRI axial plan (extrinsic image coordinates). However, the MVEE principal axes (a, b, c) capture the intrinsic STN dimensions across multiple patients independent in the image orientation. The principal axes are not necessarily aligned with the x, y, z directions and therefore the length reported here is longer than that reported previously.
Fig 6
Fig 6. STN lateral location correlation with patient age.
The correlation (r = 0.47; p < 0.001) between the patient’s age and the lateral distance of the STN center of mass from the midline.
Fig 7
Fig 7. 3D models of the STN and the implanted electrode.
Patient-specific anatomical 3D models of the STN and the implanted electrode for ten Parkinson’s disease (PD) patients are shown. We present three different view angles to better visualize the DBS electrode location in 3D space. The active contact, as defined by the monopolar survey, is marked in red.
Fig 8
Fig 8. Example of MER notes versus the implanted electrode trajectory.
Examples of two Parkinson’s disease (PD) patient-specific anatomical models of subcortical structures along with implanted electrode and active contact (red). A and E provides axial view. B and F coronal view, and C and G sagittal view with the implanted electrode. D and H are the MER notes taken during the surgery of the final tract where the DBS lead was implanted. Excellent agreement between the MER data and the model was found.
Fig 9
Fig 9. Correlation between STN trajectory lengths based on MER vs. 7T model.
Correlation between the length of the STN, as defined by MER at the DBS lead location, and the length of the STN as defined by the 7T images. The data indicates excellent agreement between the 3D 7T imaging-based anatomical model of STN and the corresponding MER mapping. The shadow represents the 95% confidence interval around the regression line.
Fig 10
Fig 10. Example of VTA-STN overlap.
An example of the computed VTA for three different stimulation settings relative to a representative case of patient-specific STN. For each stimulation setting, the clinical report, as written in the monopolar review, is presented. It can be seen that minimal overlap with the STN resulted in no benefit, good overlap resulted in optimal benefit, and good overlap while stimulating large volume outside the STN resulted in a significant adverse effect.
Fig 11
Fig 11. Correlation between VTA–STN overlap and motor improvement.
An example of a correlation between the VTA overlap with the STN and a patient’s motor improvement scores as were evaluated during a monopolar review session (see methods section for details). The Pearson’s correlation coefficient in this case was r = 0.81 (p < 0.001).
Fig 12
Fig 12. Active contacts on averaged STN.
The locations of the active contacts are superimposed on an average STN model in axial (A) and coronal (B) view. Green spheres: location of the active contact for different patients.

References

    1. Richter EO, Hoque T, Halliday W, Lozano AM, Saint-Cyr JA. Determining the position and size of the subthalamic nucleus based on magnetic resonance imaging results in patients with advanced Parkinson disease. J Neurosurg. 2004;100: 541–546. 10.3171/jns.2004.100.3.0541 - DOI - PubMed
    1. Rolston JD, Englot DJ, Starr PA, Larson PS. An unexpectedly high rate of revisions and removals in deep brain stimulation surgery: Analysis of multiple databases. Parkinsonism Relat Disord. 2016;33: 72–77. 10.1016/j.parkreldis.2016.09.014 - DOI - PMC - PubMed
    1. Wodarg F, Herzog J, Reese R, Falk D, Pinsker MO, Steigerwald F, et al. Stimulation site within the MRI-defined STN predicts postoperative motor outcome. Mov Disord. 2012;27: 874–879. 10.1002/mds.25006 - DOI - PubMed
    1. Yelnik J, Damier P, Demeret S, Gervais D, Bardinet E, Bejjani B-P, et al. Localization of stimulating electrodes in patients with Parkinson disease by using a three-dimensional atlas—magnetic resonance imaging coregistration method. J Neurosurg. 2003;99: 89–99. 10.3171/jns.2003.99.1.0089 - DOI - PubMed
    1. Pallavaram S, DʼHaese P-F, Lake W, Konrad PE, Dawant BM, Neimat JS. Fully automated targeting using nonrigid image registration matches accuracy and exceeds precision of best manual approaches to subthalamic deep brain stimulation targeting in Parkinson disease. Neurosurgery. NIH Public Access; 2015;76: 756–65. 10.1227/NEU.0000000000000714 - DOI - PMC - PubMed

Publication types