. 2018 Aug 22;13(8):e0201730.
doi: 10.1371/journal.pone.0201730. eCollection 2018.

A novel method of inducing endogenous pupil oscillations to detect patients with unilateral optic neuritis

Affiliations

A novel method of inducing endogenous pupil oscillations to detect patients with unilateral optic neuritis

Cedric Lamirel et al. PLoS One. .

Abstract

Purpose: To use and test a new method of inducing endogenously generated pupillary oscillations (POs) in patients with unilateral optic neuritis (ON), to describe a signal analysis approach quantifying pupil activity and to evaluate the extent to which POs permit to discriminate patients from control participants.

Method: Pupil size was recorded with an eye-tracker and converted in real time to modulate the luminance of a stimulus (a 20° disk) presented in front of participants. With this biofeedback setting, an increasing pupil size transforms into a high luminance, entraining a pupil constriction that in turn decreases the stimulus luminance, and so on, resulting in endogenously generated POs. POs were recorded for 30 seconds in the affected eye, in the fellow eye and in binocular conditions with 22 patients having a history of unilateral ON within a period of 5 years, and with 22 control participants. Different signal analysis methods were used to quantify the power and frequency of POs.

Results: On average, pupil size oscillated at around 1 Hz. The amplitude of POs appears not to be a reliable marker of ON. In contrast, the frequency of POs was significantly lower, and was more variable over time, in the patients' affected eye, as compared to their fellow eye and to the binocular condition. No such differences were found in control participants. Receiver operating characteristic analyses based on the frequency and the variability of POs to classify patients and control participants gave an area under the curve of 0.82, a sensitivity of 82% (95%CI: 60%-95%) and a specificity of 77% (95%CI: 55%-92%).

Conclusions: The new method used to induce POs allowed characterizing the visual afferent pathway defect in ON patients with encouraging accuracy. The method was fast, easy to use, only requiring that participants look ahead, and allows testing many stimulus parameters (e.g. color, stimulus location, size, etc).


Conflict of interest statement

The authors have declared that no competing interests exist.

Figures

Fig 1
Fig 1. Pupil cycle time elicited by positioning the beam of a slit lamp at the inferior margin of the pupil.
With this method, the pupil cycle time is derived from the number of cycles measured using a stop watch during a fixed period.
Fig 2
Fig 2. Device used in the study.
A. Eyes positions and pupil data are recorded binocularly and stored for off-line analyses. Pupil data are converted on-line into a luminance level, (Luminance = Pupil Size* Gain) to modulate a 20° disk stimulus. In this configuration, the pupil enters an oscillatory pattern, whose frequency was used to characterize pupillary defects. B. Example of 30 seconds of recording showing eye positions (red/green traces) and binocular pupil oscillations (yellow and orange). Note that oscillations of vertical eye position reflect respiratory artifacts.
Fig 3
Fig 3. Example of a single trial analyses.
A) Z-normalized pupil size recorded for 30 seconds. B) Power spectrum and auto-correlogram spectrum of the z-normalized pupil data. C) Time frequency map showing the frequency power as a function of time: the power at each time step is color-coded; with red indicating a high power and blue a low power. The black line represents the maximum power frequency at each time step (black curve). The mean and variance of this maximum frequency distribution was used to characterize pupil dynamics.
Fig 4
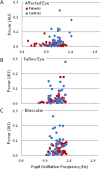
Fig 4. Power and frequency of POs obtained for the affected and fellow eyes, and in binocular conditions.
Each dot represents the result of one participant. Note that the power of POs depends little on the condition (affected, fellow and binocular conditions), while the POF shows larger differences between conditions.
Fig 5
Fig 5. Pupil oscillation results.
A. Pupil Oscillation Frequency averaged across participants for the ON (red) and control group (blue). Thin lines represent 95% confidence interval. B. Standard deviations of the POF with maximum power in the 0.5–2 Hz range, computed from the time-frequency maps.
Fig 6
Fig 6. Receiver operating characteristic curves using the affected and fellow eyes of the ON patients group.
ROC curves are computed with POFs (green dots) and Mixed Index (purple dots).
Fig 7
Fig 7. Receiver operating characteristic curves using the affected eyes of the ON patient group and the paired “affected eyes” of the Control group.
ROC curves are computed with POFs (green dots) and Mixed Index (purple dots).
Fig 8
Fig 8. Individual results of the affected eye of the ON group and of the control participants.
A. Individual results of the affected eye of ON patients and control participants sorted by increasing POF; the green line represents the threshold (0.99 Hz) that best discriminate the 2 groups. B. Individual results of the affected eye of ON patients and control participants sorted by increasing Mixed Index values. The green line represents the threshold (6.89 AU) that best discriminate the 2 groups.

References

    1. Loewenfeld I. The pupil: Anatomy, physiology, and clinical applications. Boston, MA: Butterworth-Heinemann; 1999.
    1. Kardon R. Anatomy and physiology of the Autonomic Nervous System Walsh & Hoyt’s Clinical Neuro-Ophthalmology. 6th ed. Philadelphia, PA: Lippincott Williams & Wilkins; 2005. pp. 649–714.
    1. Clarke RJ, Zhang H, Gamlin PDR. Primate pupillary light reflex: receptive field characteristics of pretectal luminance neurons. J Neurophysiol. 2003;89: 3168–3178. 10.1152/jn.01130.2002 - DOI - PubMed
    1. Güler AD, Ecker JL, Lall GS, Haq S, Altimus CM, Liao H-W, et al. Melanopsin cells are the principal conduits for rod-cone input to non-image-forming vision. Nature. 2008;453: 102–105. 10.1038/nature06829 - DOI - PMC - PubMed
    1. Kardon R, Anderson SC, Damarjian TG, Grace EM, Stone E, Kawasaki A. Chromatic pupil responses: preferential activation of the melanopsin-mediated versus outer photoreceptor-mediated pupil light reflex. Ophthalmology. 2009;116: 1564–1573. 10.1016/j.ophtha.2009.02.007 - DOI - PubMed

Publication types

LinkOut - more resources