. 2018 Aug 22;13(8):e0202156.
doi: 10.1371/journal.pone.0202156. eCollection 2018.

Intravitreal pro-inflammatory cytokines in non-obese diabetic mice: Modelling signs of diabetic retinopathy

Affiliations

Intravitreal pro-inflammatory cytokines in non-obese diabetic mice: Modelling signs of diabetic retinopathy

Odunayo O Mugisho et al. PLoS One. .

Abstract

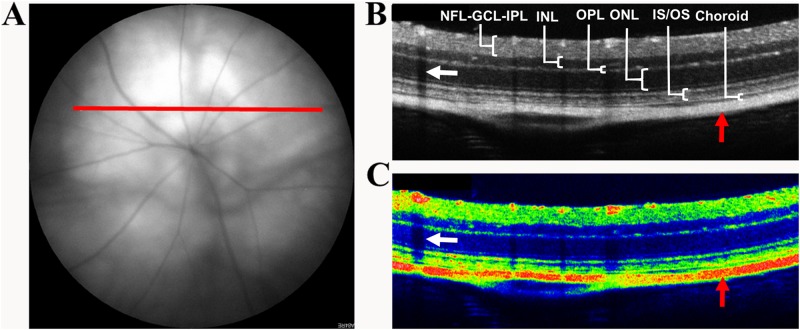
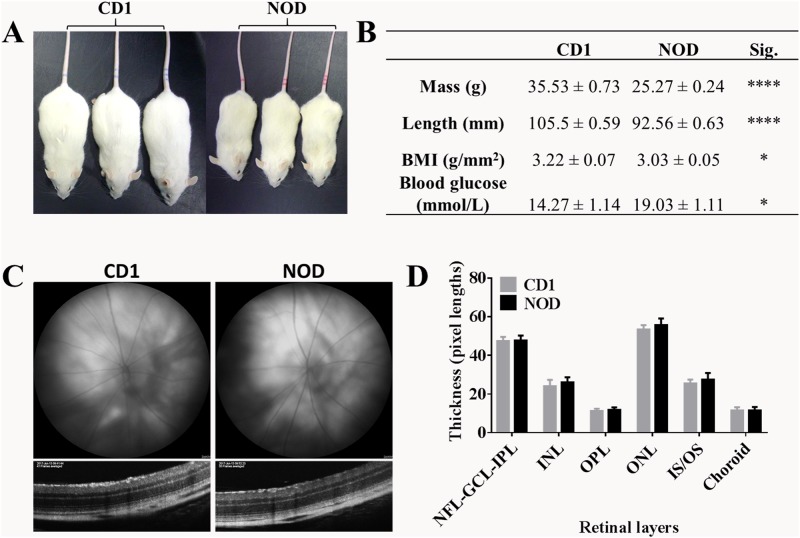
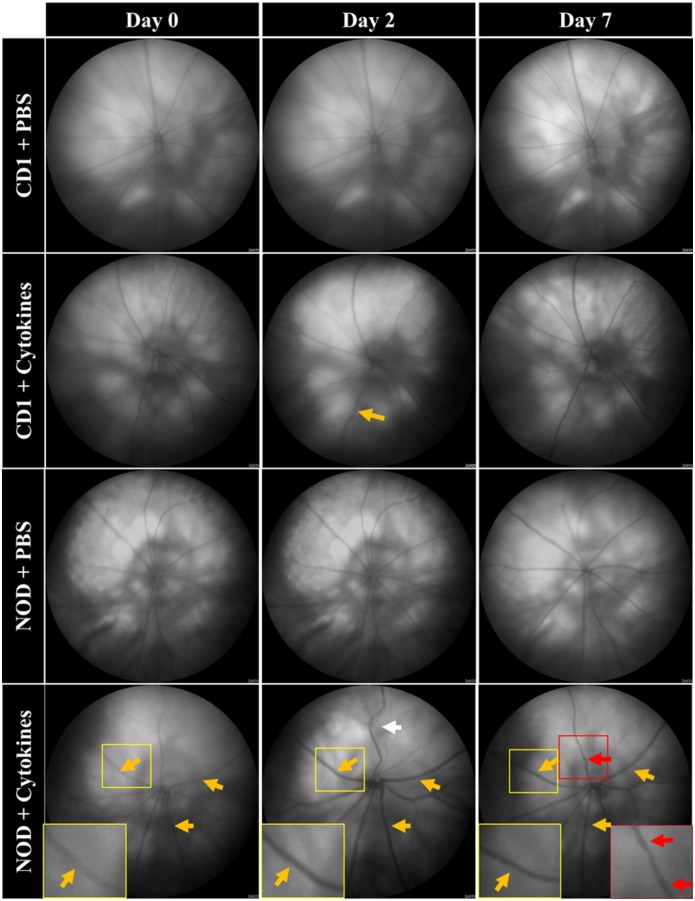
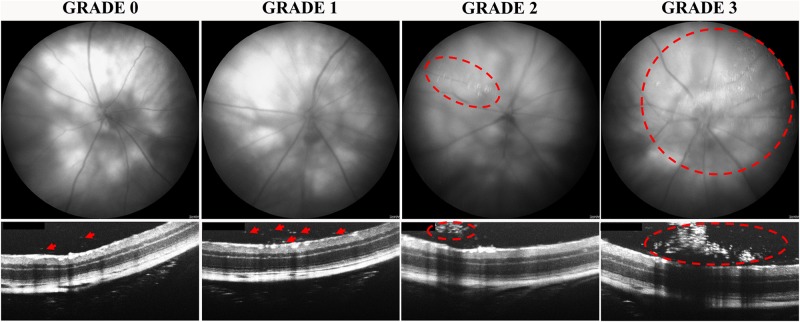
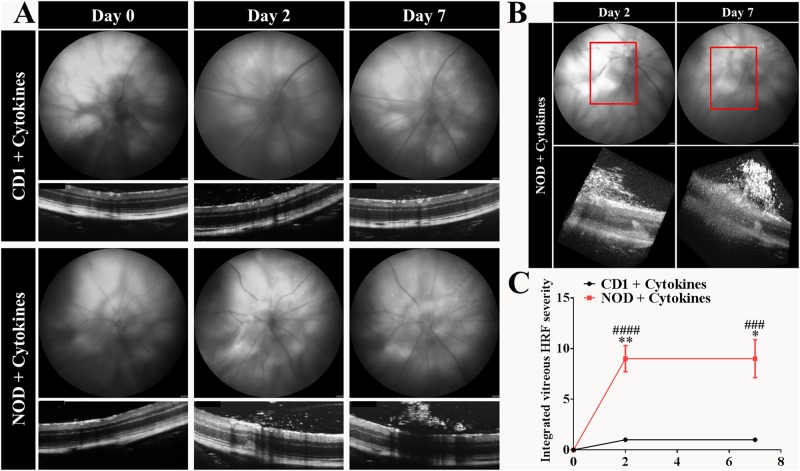
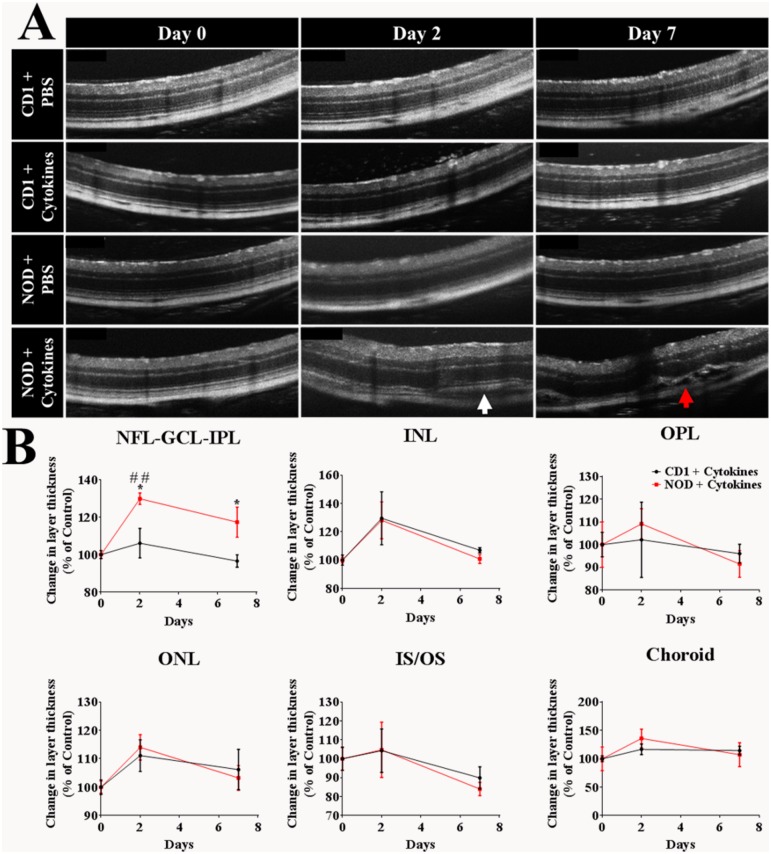
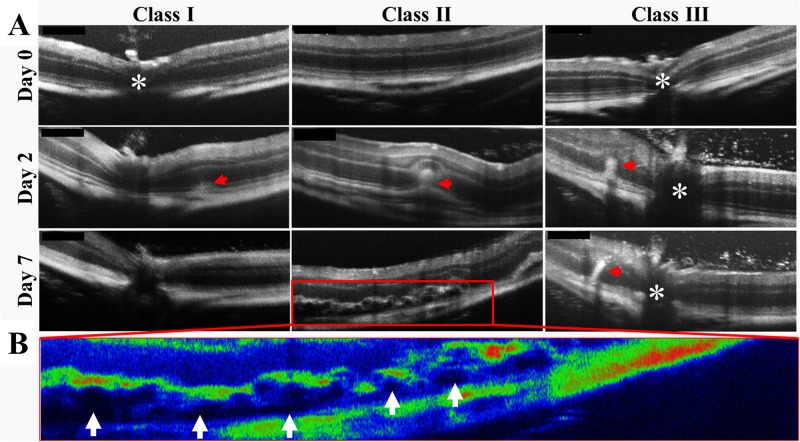
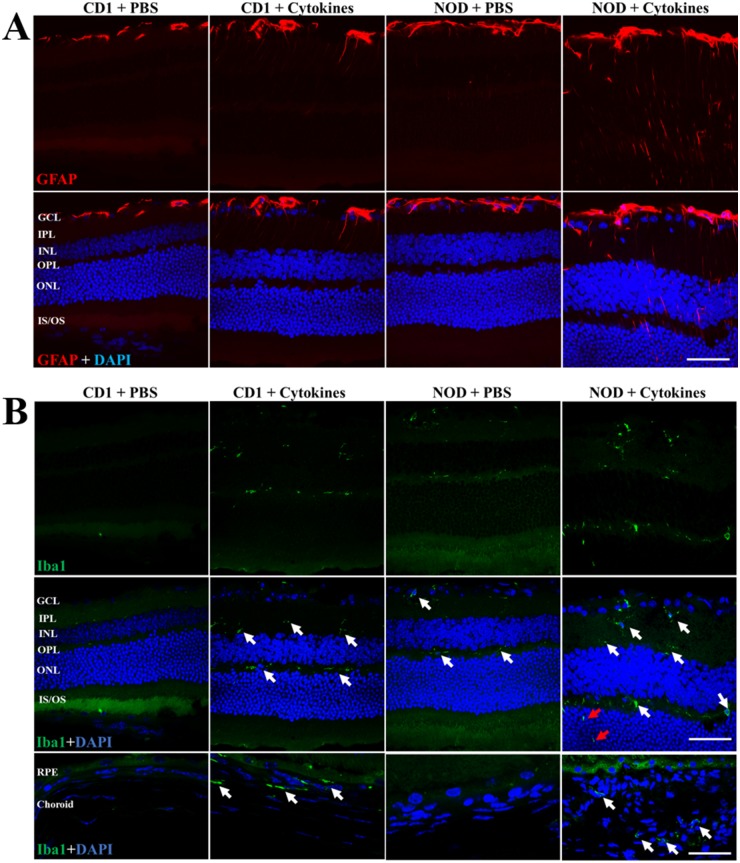
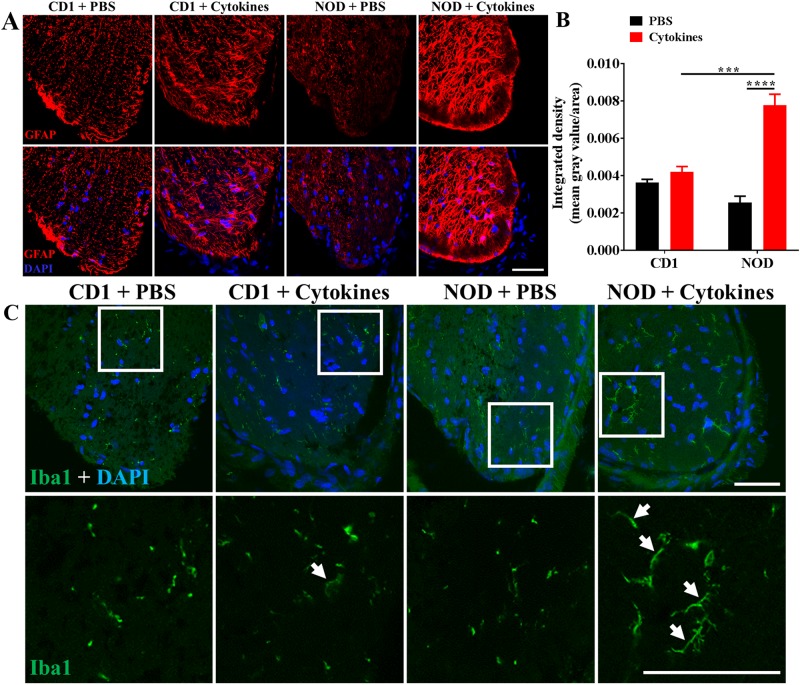
Diabetic retinopathy is a vascular disease of the retina characterised by hyperglycaemic and inflammatory processes. Most animal models of diabetic retinopathy are hyperglycaemia-only models that do not account for the significant role that inflammation plays in the development of the disease. In the present study, we present data on the establishment of a new animal model of diabetic retinopathy that incorporates both hyperglycaemia and inflammation. We hypothesized that inflammation may trigger and worsen the development of diabetic retinopathy in a hyperglycaemic environment. Pro-inflammatory cytokines, IL-1β and TNF-α, were therefore injected into the vitreous of non-obese diabetic (NOD) mice. CD1 mice were used as same genetic background controls. Fundus and optical coherence tomography images were obtained before (day 0) as well as on days 2 and 7 after intravitreal cytokine injection to assess vessel dilation and beading, retinal and vitreous hyper-reflective foci and retinal thickness. Astrogliosis and microgliosis were assessed using immunohistochemistry. Results showed that intravitreal cytokines induced vessel dilation, beading, severe vitreous hyper-reflective foci, retinal oedema, increased astrogliosis and microglia upregulation in diabetic NOD mice. Intravitreal injection of inflammatory cytokines into the eyes of diabetic mice therefore appears to provide a new model of diabetic retinopathy that could be used for the study of disease progression and treatment strategies.


Conflict of interest statement

We, the authors declare that no competing interests exist.

Figures

Fig 1
Fig 1
(A) Fundus image showing the position (red line) at which OCT scans were taken to quantify retinal layer thicknesses. (B) OCT image obtained from the position indicated by the red line in (A) showing the different retinal layers quantified. (C) Pseudo-colour OCT image showing the log of the backscattered light intensity. Fluid-filled areas and blood vessel shadows (white arrows) appear hypo-reflective and therefore black in colour OCT images while cell-dense and hyper-reflective areas range in colour from blue to red (red arrows). NFL = Nerve fibre layer; GCL = Ganglion cell layer; IPL = Inner plexiform layer; INL = Inner nuclear layer; OPL = Outer plexiform layer; ONL = Outer nuclear layer; IS/OS = Inner segment/outer segment.
Fig 2
Fig 2. Physical characterisation, retinal integrity and retinal thickness of CD1 and NOD mice.
(A) NOD and CD1 mice showing that NOD mice were generally smaller than CD1 mice. (B) A comparison of mass, length, BMI and blood glucose showed that NOD mice were smaller in mass and length (p < 0.0001 for both) and had a significantly lower BMI (p = 0.0279) compared to CD1 mice. However, NOD mice had higher blood glucose levels than CD1 mice (p = 0.0120). Results are expressed as mean ± SEM. Statistical comparisons between NOD and CD1 were carried out using Mann-Whitney test *p ≤ 0.05; ****p < 0.0001; n = 12 eyes per strain. (C) Fundus (top) and OCT (bottom) images of CD1 and NOD mouse retinas showed no differences in retinal vasculature and overall integrity between the two mouse strains. (D) Retinal layer thickness measurements were obtained from OCT images and showed no differences between NOD and CD1 mice at baseline. Results are expressed as mean + SEM; Statistical analysis was carried out using a two-way ANOVA with Tukey’s test for multiple comparisons; n = 12 eyes per strain.
Fig 3
Fig 3. Pro-inflammatory cytokine-induced macrovascular pathology in CD1 and NOD mice.
Fundus images showing vascular changes in saline-injected and pro-inflammatory cytokine-treated CD1 and NOD mice. On day 2, vessel dilation (see zoomed images and compare yellow arrows on day 2 with equivalent vessels of the same retina on day 0) increased in both cytokine-treated CD1 and NOD mice while vessel tortuosity (compare white arrow on day 2 with equivalent vessels of the same retina on day 0) was only observed in cytokine-treated NOD mice. Moreover, vessel beading was only seen in cytokine-treated NOD mice and only on day 7 (compare red arrows on day 7 with equivalent vessels of the same retina on day 0).
Fig 4
Fig 4. Grading of vitreous HRF based on fundus and OCT images.
Grade 0 was characterized by no or very few HRF. Grade 1 showed significantly more HRF in the vitreous (red arrows) seen in OCT images only. Grade 2 and 3 were characterized by clumping of vitreous HRF (red circles) creating a ‘window effect’ that obstructed the view of the underlying retina in both fundus and OCT images. Vitreous HRF were classified as grade 2 if HRF formed clumps obstructing up to 25% of the fundus and OCT image area with grade 3 referring to HRF clumps obstructing more than 25% of the fundus and OCT images.
Fig 5
Fig 5. Pro-inflammatory cytokine-induced vitreous hyper-reflective foci in CD1 and NOD mice.
(A) Fundus and OCT images showed that vitreous HRF were present in both pro-inflammatory cytokine-treated mouse strains, but were more pronounced in NOD than in CD1 mice. (B) 3D volume OCT images depict the extent of vitreous debris severity in NOD mice on days 2 and 7. (C) The vitreous HRF grading scale was used to compare the vitreous HRF severity between both mouse strains. There was no statistically significant change in severity over time in CD1 mice. However, there was a statistically significant increase in HRF severity in NOD mice at day 2 (p < 0.0001) and day 7 (p = 0.0001) compared to day 0. More importantly, the vitreous HRF severity in cytokine-treated NOD on day 2 (p = 0.0012) and day 7 (p = 0.0428) was significantly higher than in cytokine-treated CD1 eyes. Results are expressed as mean ± SEM; Statistical comparisons were carried out using two-way ANOVA with Tukey’s multiple comparisons test. #denotes statistically significant differences compared to day 0. ###p ≤ 0.001; ####p < 0.0001. *denotes significant differences between cytokine-injected CD1 and NOD mice. *p ≤ 0.05; **p ≤ 0.01; n = 12 eyes per strain.
Fig 6
Fig 6. Pro-inflammatory cytokine-induced intra-retinal hyper-reflective foci in CD1 and NOD mice.
(A) OCT images revealed that saline injection did not affect retinal layer integrity in either mouse strain. Pro-inflammatory cytokine injection did not affect retinal layer integrity in CD1 mice. However, cytokine-injection in NOD mice resulted in severe disruption of the IS/OS on day 2 (white arrow) and retinal oedema on day 7 (red arrow). (B) Retinal layer thickness was quantified from OCT images and expressed as a percentage of the baseline thickness. The thickness of the NFL-GCL-IPL increased over time in cytokine-treated NOD mice and this increase was significant on day 2 compared to NOD baseline values (p = 0.0025) and CD1 mice at day 2 (p = 0.0188). At day 7, cytokine-treated NOD mice again showed thicker NFL-GCL-IPL compared to cytokine-treated CD1 mice (p = 0.0410). At both day 2 and day 7, no significant increase was found in the thickness of the INL, OPL, ONL, IS/OS, or choroid in NOD or CD1 compared to their baseline Results are expressed as mean ± SEM; Statistical comparisons were carried out using two-way ANOVA with Tukey’s multiple comparisons test. #denotes statistically significant differences compared to day 0. ##p ≤ 0. *denotes significant differences between cytokine-injected CD1 and NOD mice. *p ≤ 0.05. n = 12 eyes per strain.
Fig 7
Fig 7. Pro-inflammatory cytokine-induced changes in retinal layer thickness in CD1 and NOD mice.
(A) Different classes of intra-retinal HRF (red arrows) were observed within the ONL in pro-inflammatory cytokine-injected NOD mouse retinas. The ONH is indicated by asterisks. (B) A pseudo-colour OCT image of class II graded retinal HRF seen in (A) showing the hypo-reflective regions of sub-retinal fluid deposition between the IS/OS layers and the RPE (white arrows).
Fig 8
Fig 8. Pro-inflammatory cytokine-induced changes in retinal expression of GFAP and Iba-1 in CD1 and NOD mice.
(A) Immunohistochemical images showing GFAP expression in PBS-injected or cytokine-treated CD1 and NOD mice. GFAP labelling was evident only within the GCL in PBS-injected CD1 and NOD mouse retinas. In cytokine-treated CD1 retinas, GFAP expression was seen in the GCL but also extended to the IPL. Cytokine-treated NOD retinas, on the other hand, showed GFAP expression extending from the GCL to the ONL. As with OCT analysis, retinal layers of cytokine-treated NOD mice appeared much thicker than those of other treatment groups. (B) Immunohistochemical images showing the presence of Iba1-positive cells within the GCL, IPL, and INL of cytokine-treated CD1 as well as PBS- and cytokine-injected NOD mice (white arrows). Moreover, cytokine-treated NOD retinas revealed Iba1-positive cells (red arrows) within the OPL which were not observed in other groups. Iba1-positive cells were absent in the choroid of PBS-injected CD1 and NOD mice. However, Iba1-positive cells were observed in the choroid of cytokine-treated CD1 and NOD mice as indicated by white arrows. GCL = Ganglion cell layer; IPL = Inner plexiform layer; INL = Inner nuclear layer; OPL = Outer plexiform layer; ONL = Outer nuclear layer; IS/OS = Inner segment/outer segment; RPE = retinal pigment epithelium. Scale bar: 25 μm.
Fig 9
Fig 9. Pro-inflammatory cytokine-induced changes in retinal expression of GFAP and iba-1 in CD1 and NOD mice.
(A) Immunohistochemical images showing GFAP expression in the optic nerve of PBS-injected and cytokine-treated CD1 and NOD mice. GFAP labelling was evident in all treatment groups but appeared highest in cytokine-treated NOD mice. (B) Quantification of the integrated density of GFAP in the optic nerve of PBS-injected and cytokine-treated CD1 and NOD mice revealed that GFAP expression was higher in cytokine-treated compared to PBS-injected NOD (p < 0.0001) and cytokine-treated CD1 mice (p = 0.0003). (C) Immunohistochemical images showing the presence of Iba1-positive cells within the optic nerve in all treatment groups. Compared to PBS-injected groups, Iba1-positive cells in cytokine-treated eyes displayed long, extended cellular processes (white arrows). White boxes in the top row have been zoomed in on the bottom to highlight the differences in Iba1-positive cells. Statistical comparisons were carried out using two-way ANOVA with Tukey’s multiple comparisons test. Scale bar: 25 μm; Data presented as mean + SEM. ***p ≤ 0.001; ****p ≤ 0.0001; n = 6 eyes for PBS injected groups; n = 12 eyes for cytokine-treated groups.

Similar articles

Cited by

References

    1. Kahn SE, Cooper ME, Del Prato S (2014) Pathophysiology and treatment of type 2 diabetes: perspectives on the past, present, and future. The Lancet 383: 1068–1083. - PMC - PubMed
    1. Mizutani M, Kern TS, Lorenzi M (1996) Accelerated death of retinal microvascular cells in human and experimental diabetic retinopathy. J Clin Invest 97: 2883–2890. 10.1172/JCI118746 - DOI - PMC - PubMed
    1. Hammes H-P (2005) Pericytes and the pathogenesis of diabetic retinopathy. Hormone and metabolic research 37: 39–43. 10.1055/s-2005-861361 - DOI - PubMed
    1. Klaassen I, Van Noorden CJ, Schlingemann RO (2013) Molecular basis of the inner blood-retinal barrier and its breakdown in diabetic macular edema and other pathological conditions. Progress in retinal and eye research 34: 19–48. 10.1016/j.preteyeres.2013.02.001 - DOI - PubMed
    1. Wisniewska-Kruk J, Klaassen I, Vogels IM, Magno AL, Lai CM, Van Noorden CJ, et al. (2014) Molecular analysis of blood-retinal barrier loss in the Akimba mouse, a model of advanced diabetic retinopathy. Exp Eye Res 122: 123–131. 10.1016/j.exer.2014.03.005 - DOI - PubMed

Publication types

MeSH terms