

Large Conductance Variations in a Mechanosensitive Single-Molecule Junction
- PMID: 30134105
- PMCID: PMC6143316
- DOI: 10.1021/acs.nanolett.8b02810
Large Conductance Variations in a Mechanosensitive Single-Molecule Junction
Abstract
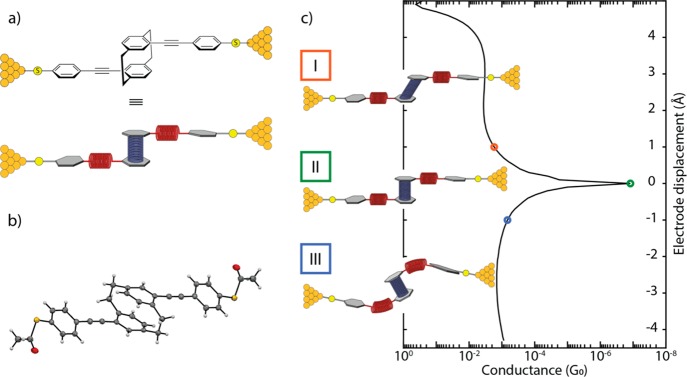
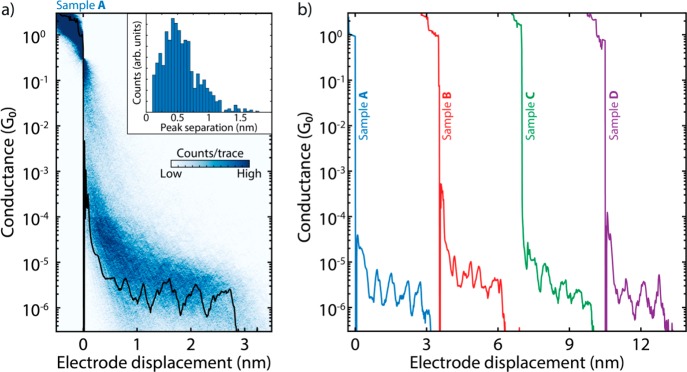
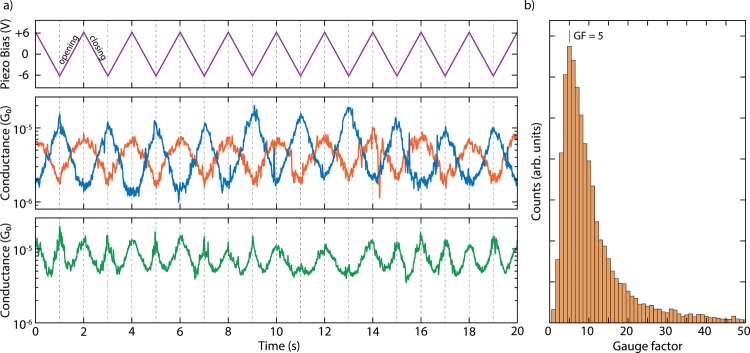
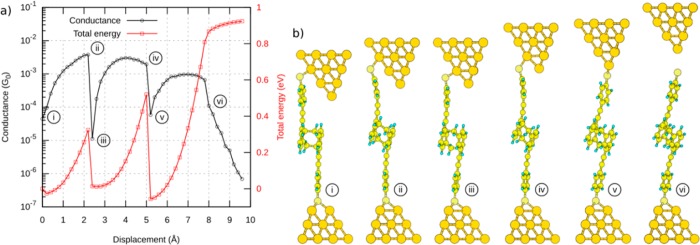
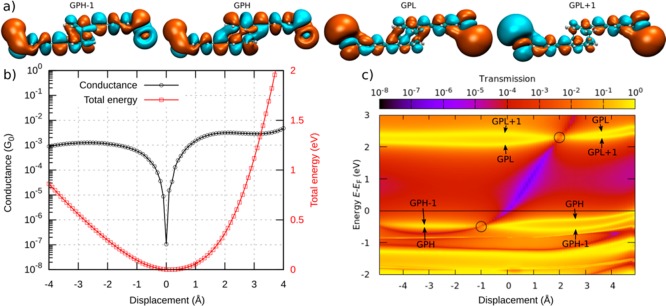
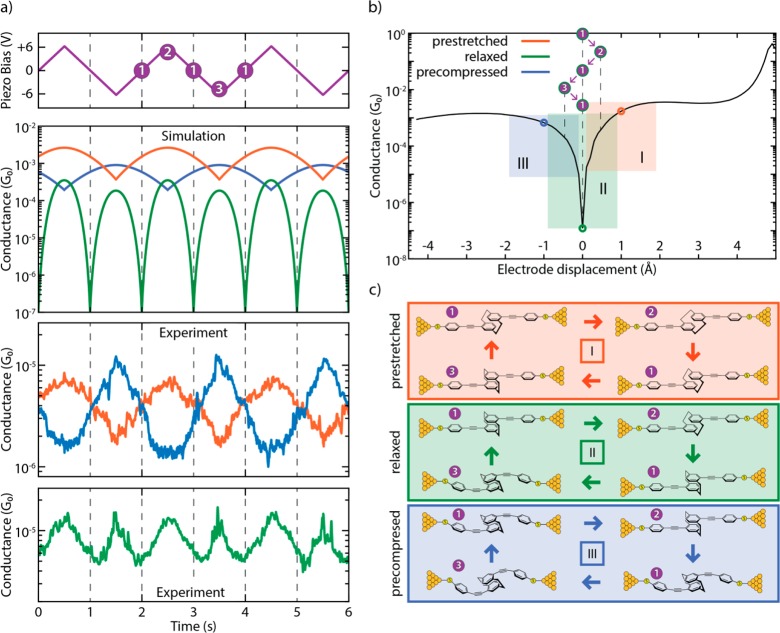
An appealing feature of molecular electronics is the possibility of inducing changes in the orbital structure through external stimuli. This can provide functionality on the single-molecule level that can be employed for sensing or switching purposes if the associated conductance changes are sizable upon application of the stimuli. Here, we show that the room-temperature conductance of a spring-like molecule can be mechanically controlled up to an order of magnitude by compressing or elongating it. Quantum-chemistry calculations indicate that the large conductance variations are the result of destructive quantum interference effects between the frontier orbitals that can be lifted by applying either compressive or tensile strain to the molecule. When periodically modulating the electrode separation, a conductance modulation at double the driving frequency is observed, providing a direct proof for the presence of quantum interference. Furthermore, oscillations in the conductance occur when the stress built up in the molecule is high enough to allow the anchoring groups to move along the surface in a stick-slip-like fashion. The mechanical control of quantum interference effects results in the largest-gauge factor reported for single-molecule devices up to now, which may open the door for applications in, e.g., a nanoscale mechanosensitive sensing device that is functional at room temperature.
Keywords: Quantum interference; density functional theory; mechanically controlled break-junctions; molecular electronics; nanoscale transport; single-molecule.
Conflict of interest statement
The authors declare no competing financial interest.
Figures
Similar articles
-
Mechanical conductance tunability of a porphyrin-cyclophane single-molecule junction.Nanoscale. 2022 Jan 20;14(3):984-992. doi: 10.1039/d1nr06484c. Nanoscale. 2022. PMID: 34989747 Free PMC article.
-
Quantum Interference Effects in Charge Transport through Single-Molecule Junctions: Detection, Manipulation, and Application.Acc Chem Res. 2019 Jan 15;52(1):151-160. doi: 10.1021/acs.accounts.8b00429. Epub 2018 Nov 30. Acc Chem Res. 2019. PMID: 30500161
-
Large Conductance Switching in a Single-Molecule Device through Room Temperature Spin-Dependent Transport.Nano Lett. 2016 Jan 13;16(1):218-26. doi: 10.1021/acs.nanolett.5b03571. Epub 2015 Dec 23. Nano Lett. 2016. PMID: 26675052
-
Supramolecular Systems and Chemical Reactions in Single-Molecule Break Junctions.Top Curr Chem (Cham). 2017 Apr;375(2):42. doi: 10.1007/s41061-017-0123-x. Epub 2017 Mar 23. Top Curr Chem (Cham). 2017. PMID: 28337670 Review.
-
From Molecular Electronics to Molecular Intelligence.ACS Nano. 2024 Oct 22;18(42):28531-28556. doi: 10.1021/acsnano.4c10389. Epub 2024 Oct 12. ACS Nano. 2024. PMID: 39395180 Review.
Cited by
-
Benchmarking break-junction techniques: electric and thermoelectric characterization of naphthalenophanes.Nanoscale. 2024 Jun 6;16(22):10751-10759. doi: 10.1039/d4nr00704b. Nanoscale. 2024. PMID: 38747099 Free PMC article.
-
Direct biomolecule discrimination in mixed samples using nanogap-based single-molecule electrical measurement.Sci Rep. 2023 Jun 5;13(1):9103. doi: 10.1038/s41598-023-35724-1. Sci Rep. 2023. PMID: 37277540 Free PMC article.
-
Structural Regulation of Mechanical Gating in Molecular Junctions.Nano Lett. 2023 May 10;23(9):3775-3780. doi: 10.1021/acs.nanolett.3c00043. Epub 2023 May 2. Nano Lett. 2023. PMID: 37129047 Free PMC article.
-
Single-molecule contact switching via electro-inductive effects.Chem Sci. 2025 Jun 18;16(28):13022-13030. doi: 10.1039/d5sc02252e. eCollection 2025 Jul 16. Chem Sci. 2025. PMID: 40538892 Free PMC article.
-
Intermolecular Effects on Tunneling through Acenes in Large-Area and Single-Molecule Junctions.J Phys Chem C Nanomater Interfaces. 2020 Oct 15;124(41):22776-22783. doi: 10.1021/acs.jpcc.0c05781. Epub 2020 Sep 14. J Phys Chem C Nanomater Interfaces. 2020. PMID: 33093933 Free PMC article.
References
-
- van der Molen S.; Naaman R.; Scheer E.; Neaton J.; Nitzan A.; Natelson D.; Tao N.; van der Zant H.; Mayor M.; Ruben M.; Reed M.; Calame M. Nat. Nanotechnol. 2013, 8, 385–389. - PubMed
Publication types
LinkOut - more resources
Full Text Sources
Other Literature Sources
