. 2018 Aug 21;24(8):2005-2012.e7.
doi: 10.1016/j.celrep.2018.07.063.

Peroxisome Proliferator-Activated Receptor γ2 Controls the Rate of Adipose Tissue Lipid Storage and Determines Metabolic Flexibility

Affiliations

Peroxisome Proliferator-Activated Receptor γ2 Controls the Rate of Adipose Tissue Lipid Storage and Determines Metabolic Flexibility

Sam Virtue et al. Cell Rep. .

Abstract

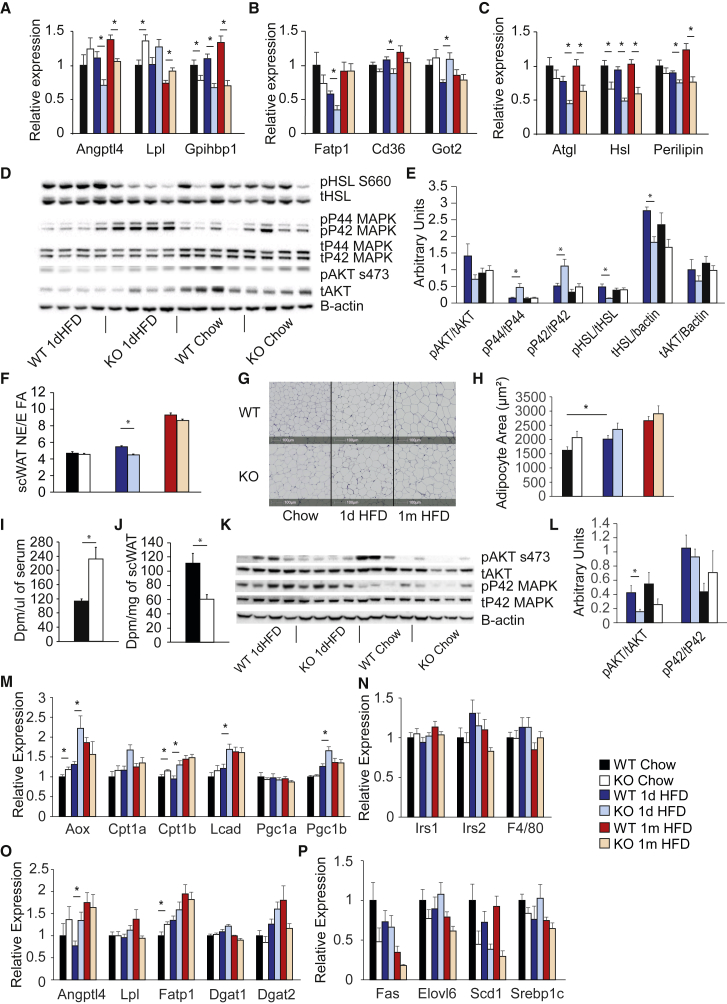
One understudied function of white adipose tissue (AT) is its role in postprandial lipid buffering. In this study, we demonstrate that mice lacking the adipose tissue-specific transcription factor peroxisome proliferator-activated receptor γ2 (PPARγ2) exhibit a defect in their rate of adipose tissue lipid storage. Impaired adipose tissue storage rate reduces metabolic flexibility, without compromising fasted glucose tolerance or insulin sensitivity, even following prolonged high-fat feeding. However, acutely overfeeding PPARγ2-KO mice caused a 10-fold increase in insulin levels compared with controls. Although impaired adipose tissue storage rate did not result in insulin resistance in young mice, 1-year-old PPARγ2-KO mice developed skeletal muscle insulin resistance. Our data indicate that failed adipose tissue storage may occur prior to defects in glucose handling and that overfeeding protocols may uncover genes controlling adipose tissue storage rate, as opposed to capacity, and act as a diagnostic test for early-stage human metabolic disease.

Keywords: PPAR; PPARγ; PPARγ2; Randle; WAT; adipose tissue; insulin resistance; metabolic flexibility; overfeeding; overnutrition.


Figures

None
Graphical abstract
Figure 1
Figure 1
PPARγ2-KO Mice Exhibit Altered Carbohydrate and Lipid Metabolism in the Fed State (A–C) Fasted glucose tolerance tests from WT and PPARγ2-KO mice: (A) total, (B) exogenous, and (C) endogenous glucose. (D) Hyperinsulinemic-euglycemic clamps: rate of disposal (RD), glucose infusion rate (GIR), and hepatic glucose production (HGP) in the hyperinsulinemic state (left), suppression of HGP (middle), and suppression of NEFA from basal to hyperinsulinemic state (right) (n = 7 WT and n = 9 KO for GTT, n = 8 WT and n = 5 KO for clamps). (E–G) Metabolic flexibility shown by (E) representative plot of 24 hr respiratory exchange ratio (RER) determined by indirect calorimetry, (F) lowest and highest 10% of RER values for WT and PPARγ2-KO mice, and (G) dRER (n = 8 mice per group). (H–J) Fed glucose tolerance tests: (H) total, (I) exogenous, and (J) endogenous glucose (n = 6 WT and n = 9 KO). (K) Lipid clearance in PPARγ2-KO and WT mice (n = 9 WT, n = 8 KO). p < 0.05, two-tailed Student’s t test. All mice were 4–5 months of age. All data are represented as mean ± SEM. See also Figure S1.
Figure 2
Figure 2
PPARγ2-KO Mice Exhibited Impaired Metabolic Responses to Acute Overfeeding (A–F) Responses to 1 day high-fat diet (1dHFD): (A) food intake, (B) change in energy expenditure (dEE), and (C) change in body weight (dBW) between chow and after 1dHFD; (D) body weight, (E) tissue weights, and (F) liver fat percentage after 1dHFD period. (G–J) Serum biochemistry for (G) insulin, (H) TGs, (I) FFAs, and (J) glucose after 1dHFD. N = 8 per group except 1 month HFD KO and food intake for chow and 1dHFD WT (n = 6). p < 0.05, two-tailed Student’s t test. All mice were 4 months of age. All data are represented as mean ± SEM. See also Figures S1 and S2.
Figure 3
Figure 3
Mice Lacking PPARγ2 Cannot Appropriately Store Lipid in Adipose Tissue (A–C) Gene expression in WAT for (A) lipoprotein lipase and regulatory molecules and (B) FA uptake genes. (C) Markers of lipolysis (n = 8 mice per group except 1 month HFD KO [n = 7]). (D and E) Western blots of WAT: (D) representative western blots and (E) quantification (n = 8 mice per group). (F) The ratio of non-essential to essential FAs in adipose tissue from WT and PPARγ2-KO mice (n = 8 per group KO chow, 1 day HFD WT and KO, n = 7 per group, WT chow, 1 month HFD WT and KO). (G and H) Morphometric analysis of sections of WAT from WT and PPARγ2-KO mice: (G) representative images (scale bar shows 100 μM) and (H) quantification of adipocyte cross-sectional area (n = 8 per group KO chow, 1 day HFD KO and 1 month HFD WT, n = 7 per group, KO chow, 1dHFD WT 1 month HFD KO). (I and J) Radioactive palmitate levels in (I) blood and (J) scWAT from WT and PPARγ2-KO mice under hyperinsulinemic-euglycemic clamp conditions (n = 6 per group). (K and L) Western blots from muscle: (K) representative western blots and (L) quantification (n = 8 per group). (M–P) Gene expression in muscle for (M) FA oxidative markers, (N) insulin sensitivity markers, (O) lipid uptake and storage genes, and (P) lipid biosynthetic genes (n = 8 mice per group except 1 month HFD KO [n = 7]). For multiple time points, two-way ANOVA was performed, and if significant, pairwise comparisons were performed using two-tailed Student’s t test (p < 0.05). All mice were 4–5 months old. All data are represented as mean ± SEM. See also Figures S2 and S3.
Figure 4
Figure 4
Loss of Adipose Tissue Lipid Buffering Leads to Aging-Related Insulin Resistance (A) Principal-component analysis of lipid species from muscle of chow (left) or 1dHFD (right) fed mice. (B) Quantification of the first two principal components from (A). (C) Muscle TG species. (D) Muscle acylcarnitines species (n = 6–8 per group). (E–I) Gene expression in muscle of 1-year-old mice: (E) F4/80, (F) FA oxidative markers, (G) lipid uptake and storage genes, (H) lipid biosynthetic genes, and (I) Insulin sensitivity markers (n = 10 WT, n = 7 KO, male mice chow fed). (J–L) Clamps from 1-year-old mice: (J) rate of glucose disposal (RD), glucose infusion rate (GIR), and hepatic glucose production (HGP) under hyperinsulinemic condition; (K) suppression of HGP between the basal and hyperinsulinemic state; and (L) body weights of mice used for clamps (n = 7 WT and 6 KO mice, chow fed). (M–O) Correlations between PPARγ2 expression in human scWAT and (M) M-value during a clamp, (N) IRS1 expression, and (O) Glut 4 expression (n = 45 subjects). For multiple time points, two-way ANOVA was performed, and if significant, pairwise comparisons were performed using two-tailed Student’s t test (p < 0.05). Correlations are Pearson’s, and exact p values are reported. All mice were 4–5 months old. All data are represented as mean ± SEM. See also Figures S3 and S4.

References

    1. Asterholm I.W., Scherer P.E. Enhanced metabolic flexibility associated with elevated adiponectin levels. Am. J. Pathol. 2010;176:1364–1376. - PMC - PubMed
    1. Asterholm I.W., Mundy D.I., Weng J., Anderson R.G., Scherer P.E. Altered mitochondrial function and metabolic inflexibility associated with loss of caveolin-1. Cell Metab. 2012;15:171–185. - PMC - PubMed
    1. Danforth E., Jr. Failure of adipocyte differentiation causes type II diabetes mellitus? Nat. Genet. 2000;26:13. - PubMed
    1. Ellacott K.L., Morton G.J., Woods S.C., Tso P., Schwartz M.W. Assessment of feeding behavior in laboratory mice. Cell Metab. 2010;12:10–17. - PMC - PubMed
    1. Escher P., Braissant O., Basu-Modak S., Michalik L., Wahli W., Desvergne B. Rat PPARs: quantitative analysis in adult rat tissues and regulation in fasting and refeeding. Endocrinology. 2001;142:4195–4202. - PubMed

Publication types

LinkOut - more resources