

HIV-1 second-line failure and drug resistance at high-level and low-level viremia in Western Kenya
- PMID: 30134290
- PMCID: PMC6984814
- DOI: 10.1097/QAD.0000000000001964
HIV-1 second-line failure and drug resistance at high-level and low-level viremia in Western Kenya
Abstract
Objective: Characterize failure and resistance above and below guidelines-recommended 1000 copies/ml virologic threshold, upon second-line failure.
Design: Cross-sectional study.
Methods: Kenyan adults on lopinavir/ritonavir-based second-line were enrolled at AMPATH (Academic Model Providing Access to Healthcare). Charts were reviewed for demographic/clinical characteristics and CD4/viral load were obtained. Participants with detectable viral load had a second visit and pol genotyping was attempted in both visits. Accumulated resistance was defined as mutations in the second, not the first visit. Low-level viremia (LLV) was detectable viral load less than 1000 copies/ml. Failure and resistance associations were evaluated using logistic and Poisson regression, Fisher Exact and t-tests.
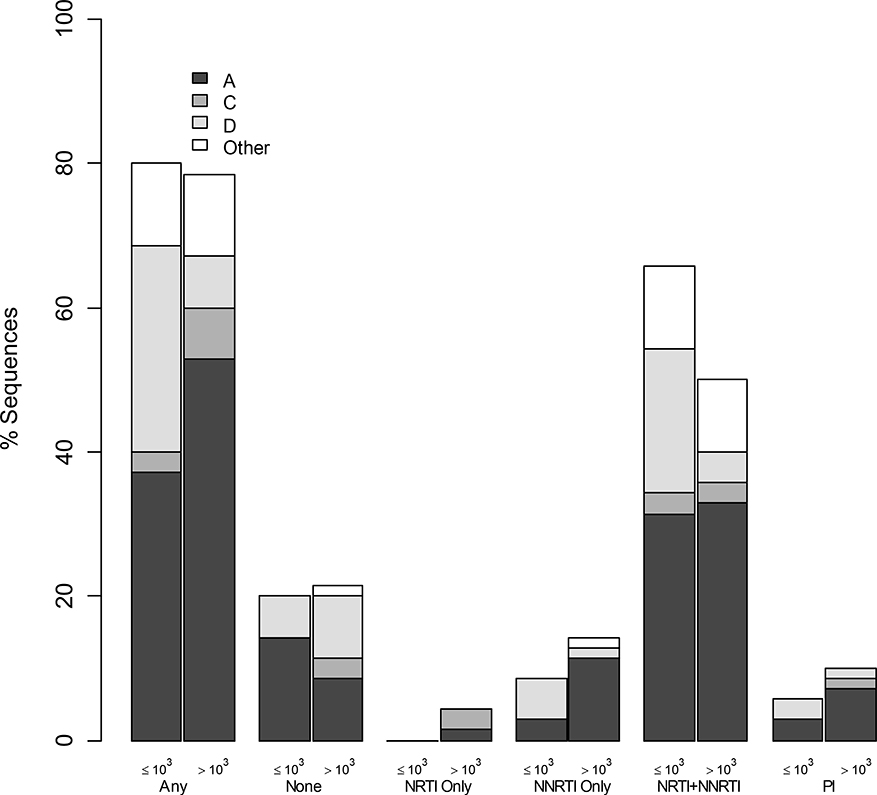
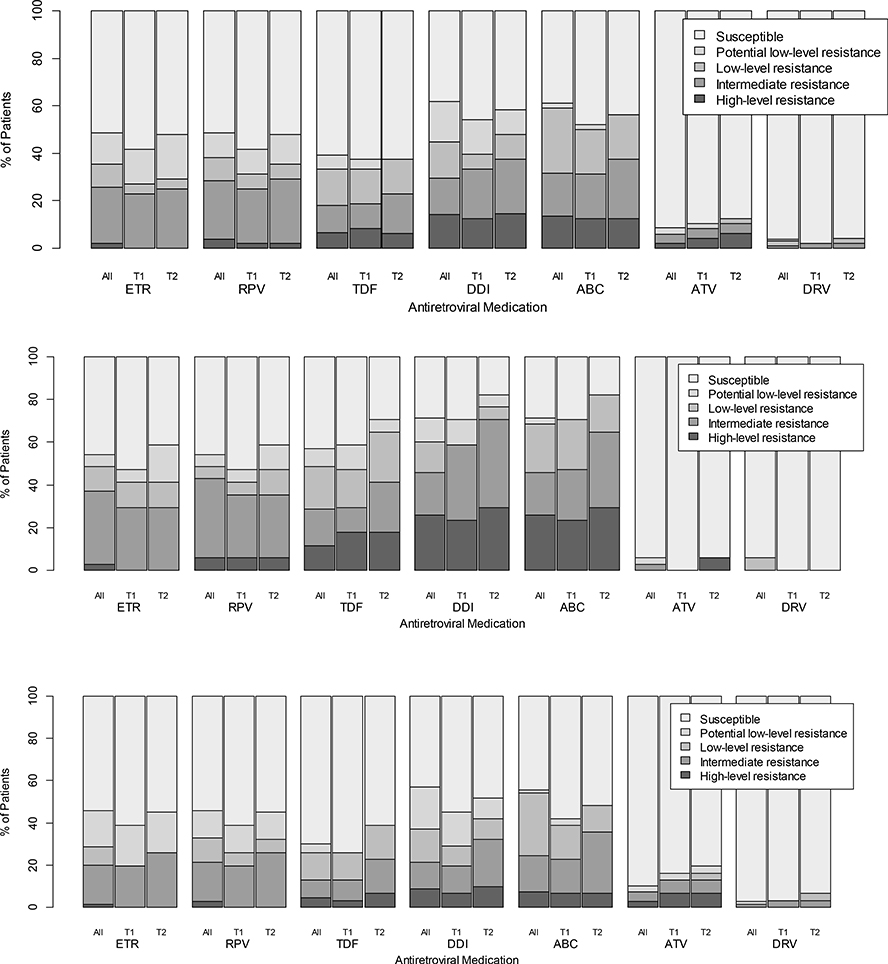
Results: Of 394 participants (median age 42, 60% women, median 1.9 years on second-line) 48% had detectable viral load; 21% had viral load more than 1000 copies/ml, associated with younger age, tuberculosis treatment, shorter time on second-line, lower CD4count/percentage, longer first-line treatment interruption and pregnancy. In 105 sequences from the first visit (35 with LLV), 79% had resistance (57% dual-class, 7% triple-class; 46% with intermediate-to-high-level resistance to ≥1 future drug option). LLV was associated with more overall and NRTI-associated mutations and with predicted resistance to more next-regimen drugs. In 48 second-visit sequences (after median 55 days; IQR 28-33), 40% accumulated resistance and LLV was associated with more mutation accumulation.
Conclusion: High resistance upon second-line failure exists at levels above and below guideline-recommended virologic-failure threshold, impacting future treatment options. Optimization of care should include increased viral load monitoring, resistance testing and third-line ART access, and consideration of lowering the virologic failure threshold, though this demands further investigation.
Figures
References
-
- UNAIDS. Available at http://www.unaids.org; accessed August 15, 2017. In.
-
- UNAIDS. Global AIDS Update 2016. Available at http://www.unaids.org/en/resources/documents/2016/Global-AIDS-update-2016; accessed August 15, 2017.
-
- WHO. Consolidated guidelines on the use of antiretroviral drugs for treating and preventing HIV infection. Recommendations for a public health approach. Available at http://www.who.int/hiv/pub/guidelines/arv2013/download/en/; accessed August 15, 2017.
-
- Barth RE, van der Loeff MF, Schuurman R, Hoepelman AI, Wensing AM. Virological follow-up of adult patients in antiretroviral treatment programmes in sub-Saharan Africa: a systematic review. Lancet Infect Dis 2010,10:155–166. - PubMed
-
- Ajose O, Mookerjee S, Mills EJ, Boulle A, Ford N. Treatment outcomes of patients on second-line antiretroviral therapy in resource-limited settings. Aids 2012,26:929–938. - PubMed
Publication types
MeSH terms
Substances
Grants and funding
LinkOut - more resources
Full Text Sources
Other Literature Sources
Medical
Research Materials
