

The prevalence of low back pain in the emergency department: a descriptive study set in the Charles V. Keating Emergency and Trauma Centre, Halifax, Nova Scotia, Canada
- PMID: 30134874
- PMCID: PMC6106829
- DOI: 10.1186/s12891-018-2237-x
The prevalence of low back pain in the emergency department: a descriptive study set in the Charles V. Keating Emergency and Trauma Centre, Halifax, Nova Scotia, Canada
Abstract
Background: While low back pain is a common presenting complaint in the emergency department, current estimates from Canada are limited. Furthermore, existing estimates do not clearly define low back pain. As such, our main objective was to estimate prevalence rates of low back pain in a large Nova Scotian emergency department using various definitions, and to describe characteristics of individuals included in these groups. An additional objective was to explore trends in low back pain prevalence in our emergency department over time.
Methods: We conducted a cross sectional analysis using six years of administrative data from our local emergency setting. We first calculated the prevalence and patient characteristics for individuals presenting with any complaint of back pain, and for groups diagnosed with different types of low back pain. We explored prevalence over time by analyzing presentation trends by month, day of the week and hour of the day.
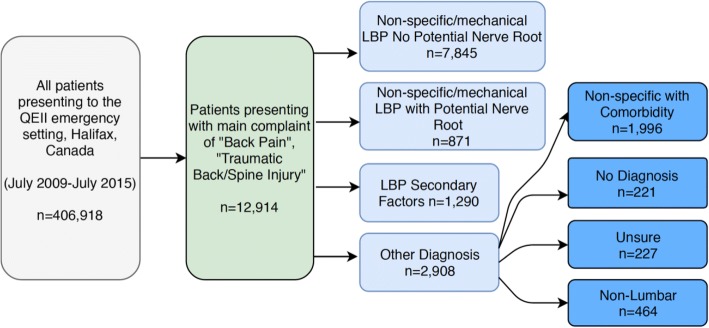
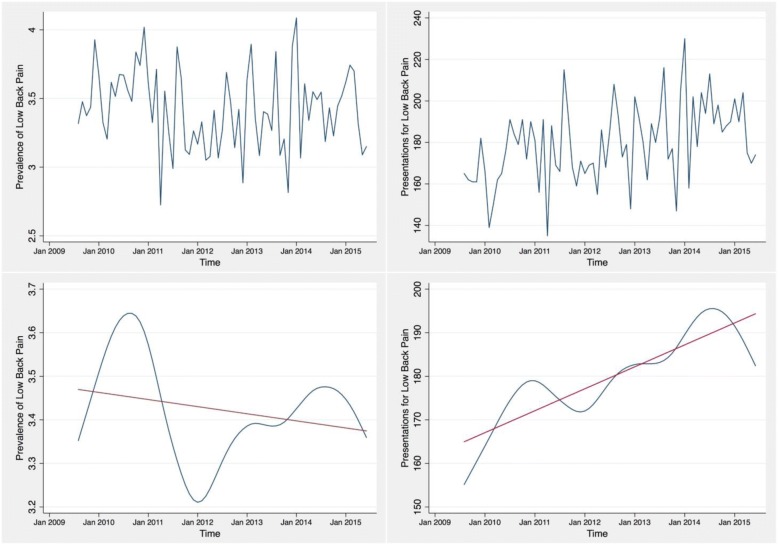
Results: The prevalence of patients presenting to the emergency department with a complaint of back pain was 3.17%. Individuals diagnosed with non-specific/mechanical low back pain with no potential nerve root involvement made up 60.8% of all back pain presentations. Persons diagnosed with non-specific/mechanical low back pain with potential nerve root involvement made up 6.7% of presentation and the low back pain attributed to secondary factors accounted for 9.9% of back pain presentations. We found a linear increase in presentations for low back pain over the study period.
Conclusion: This is the first multi-year analysis assessing the prevalence of low back pain in a Canadian emergency department. Back pain is a common presenting complaint in our local emergency department, with most of these persons receiving a diagnosis of non-specific/mechanical low back pain with no potential nerve root involvement. Future research should concentrate on understanding the management of low back pain in this setting, to ensure this is the proper setting to manage this common condition.
Keywords: Emergency setting; Low back pain; Policy decision maker; Prevalence estimate.
Conflict of interest statement
Consent for publication
Not applicable.
Competing interest
The authors declare that they have no competing interests.
Publisher’s Note
Springer Nature remains neutral with regard to jurisdictional claims in published maps and institutional affiliations.
Figures
References
-
- Deyo RA, Mirza SK, Martin BI. Back pain prevalence and visit rates: estimates from US national surveys, 2002. Spine. 2006;31(23):2724–7. - PubMed
MeSH terms
LinkOut - more resources
Full Text Sources
Other Literature Sources
Medical
