

Tree species richness increases ecosystem carbon storage in subtropical forests
- PMID: 30135164
- PMCID: PMC6125896
- DOI: 10.1098/rspb.2018.1240
Tree species richness increases ecosystem carbon storage in subtropical forests
Erratum in
-
Correction to 'Tree species richness increases ecosystem carbon storage in subtropical forests'.Proc Biol Sci. 2018 Oct 10;285(1888):20182090. doi: 10.1098/rspb.2018.2090. Proc Biol Sci. 2018. PMID: 30305442 Free PMC article. No abstract available.
Abstract
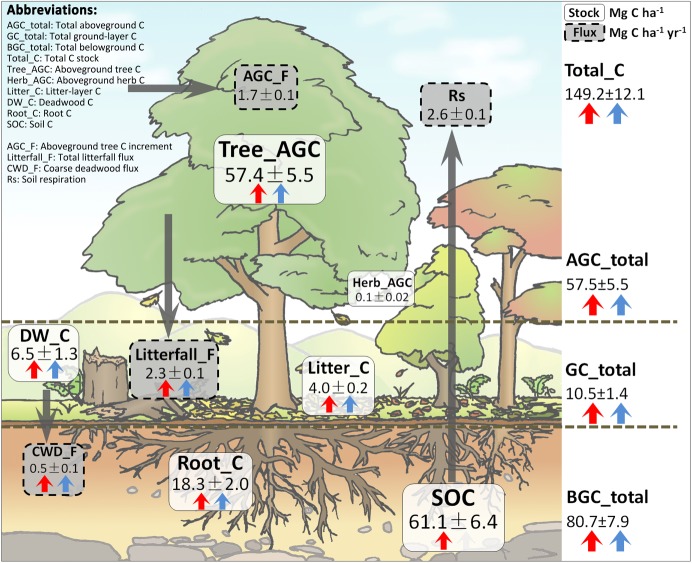
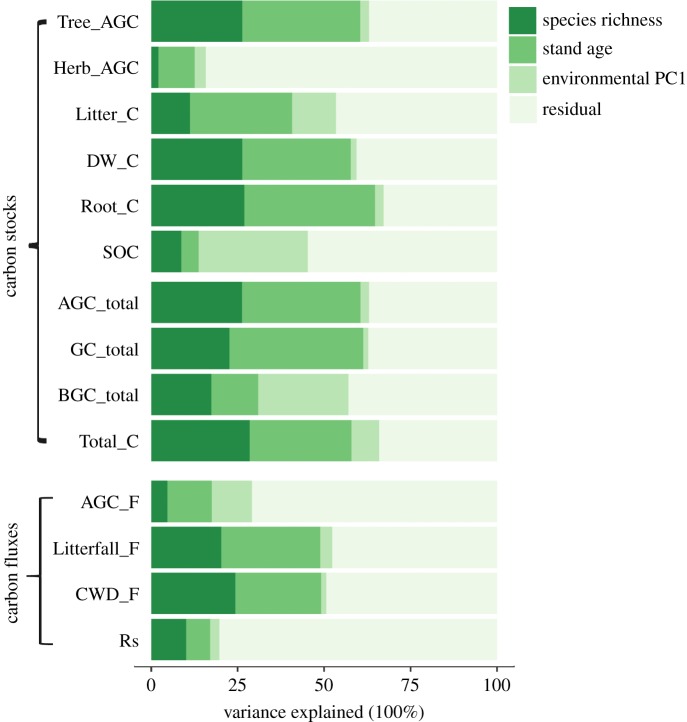
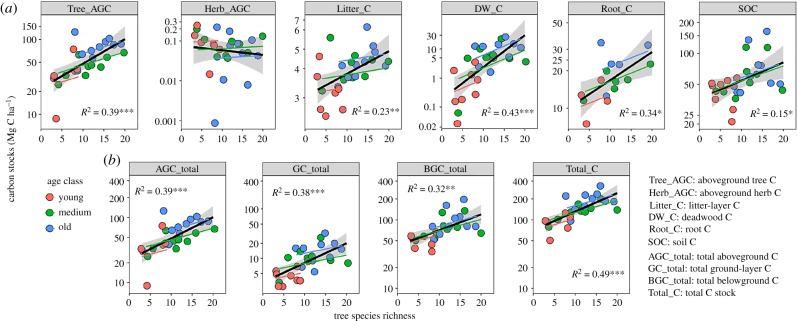
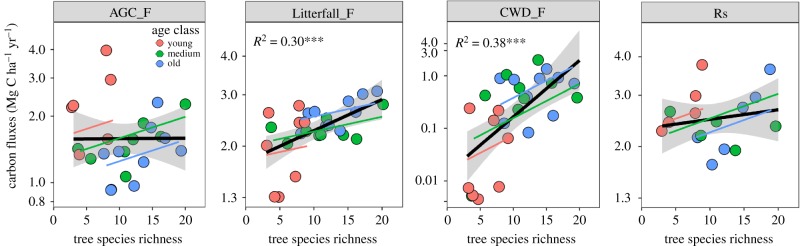
Forest ecosystems are an integral component of the global carbon cycle as they take up and release large amounts of C over short time periods (C flux) or accumulate it over longer time periods (C stock). However, there remains uncertainty about whether and in which direction C fluxes and in particular C stocks may differ between forests of high versus low species richness. Based on a comprehensive dataset derived from field-based measurements, we tested the effect of species richness (3-20 tree species) and stand age (22-116 years) on six compartments of above- and below-ground C stocks and four components of C fluxes in subtropical forests in southeast China. Across forest stands, total C stock was 149 ± 12 Mg ha-1 with richness explaining 28.5% and age explaining 29.4% of variation in this measure. Species-rich stands had higher C stocks and fluxes than stands with low richness; and, in addition, old stands had higher C stocks than young ones. Overall, for each additional tree species, the total C stock increased by 6.4%. Our results provide comprehensive evidence for diversity-mediated above- and below-ground C sequestration in species-rich subtropical forests in southeast China. Therefore, afforestation policies in this region and elsewhere should consider a change from the current focus on monocultures to multi-species plantations to increase C fixation and thus slow increasing atmospheric CO2 concentrations and global warming.
Keywords: BEF-China; carbon flux; carbon storage; ecosystem functioning; evergreen broad-leaved forest; forest biodiversity.
© 2018 The Author(s).
Conflict of interest statement
We have no competing interests.
Figures
References
-
- Grassi G, House J, Dentener F, Federici S, Elzen MD, Penman J. 2017. The key role of forests in meeting climate targets requires science for credible mitigation. Nat. Clim. Change 7, 220–226. (10.1038/nclimate3227) - DOI
Publication types
MeSH terms
Associated data
LinkOut - more resources
Full Text Sources
Other Literature Sources
Research Materials