. 2018 Oct 1;201(7):1875-1888.
doi: 10.4049/jimmunol.1701479. Epub 2018 Aug 22.

Cytosolic Processing Governs TAP-Independent Presentation of a Critical Melanoma Antigen

Affiliations

Cytosolic Processing Governs TAP-Independent Presentation of a Critical Melanoma Antigen

Nathalie Vigneron et al. J Immunol. .

Abstract

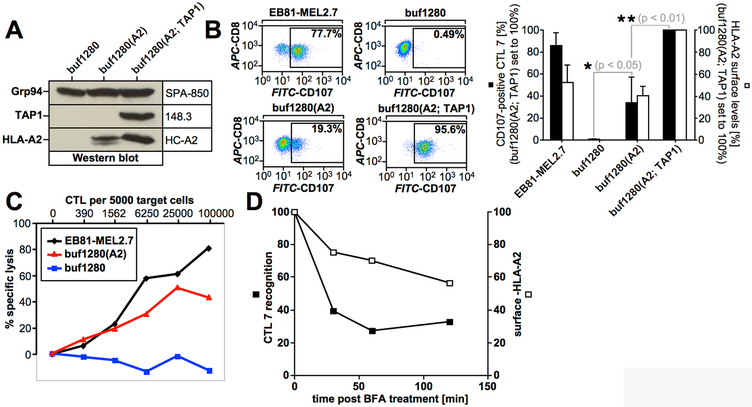
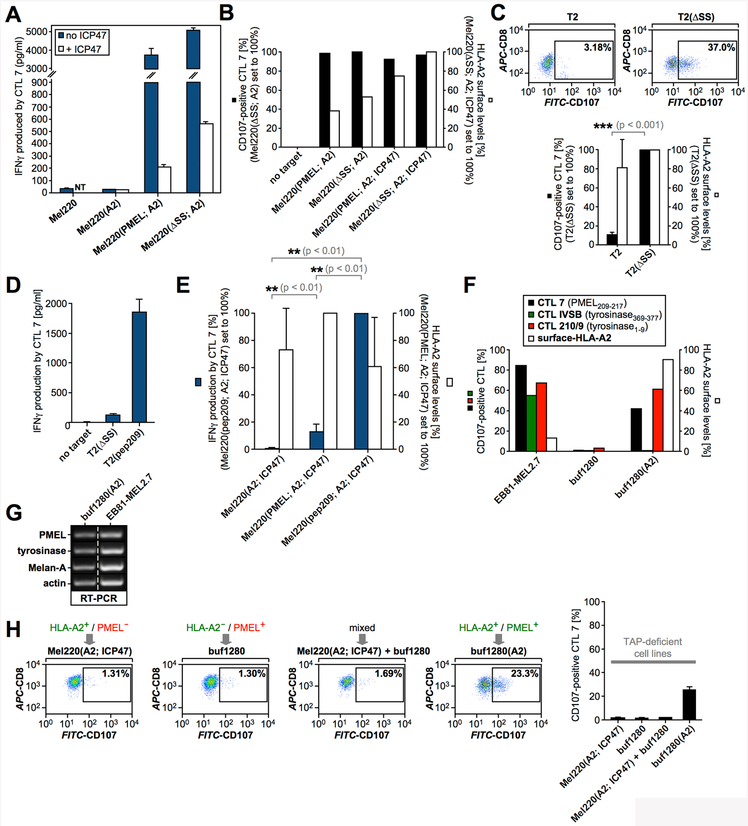
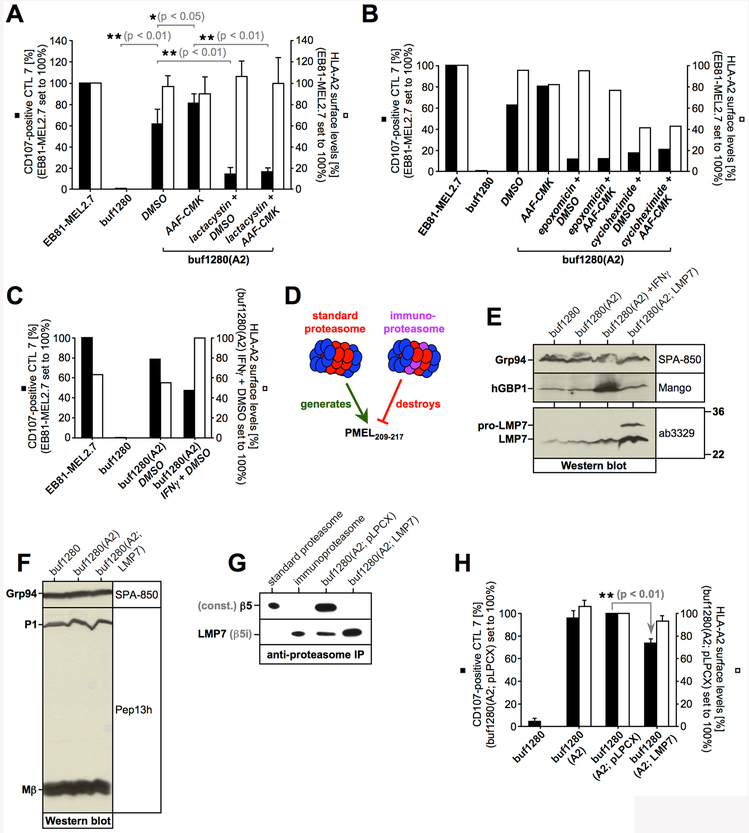
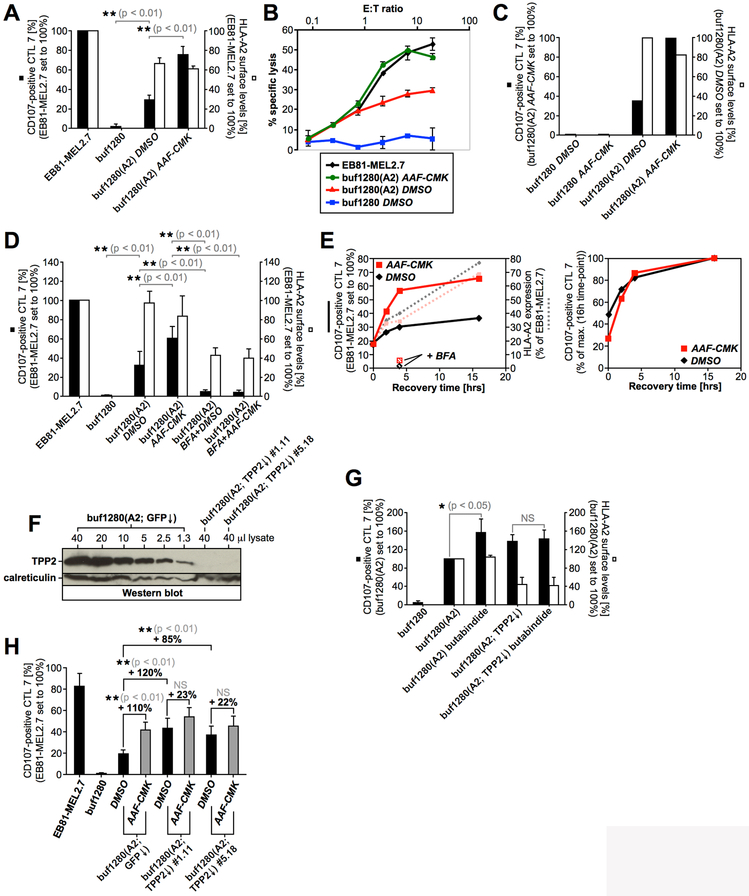
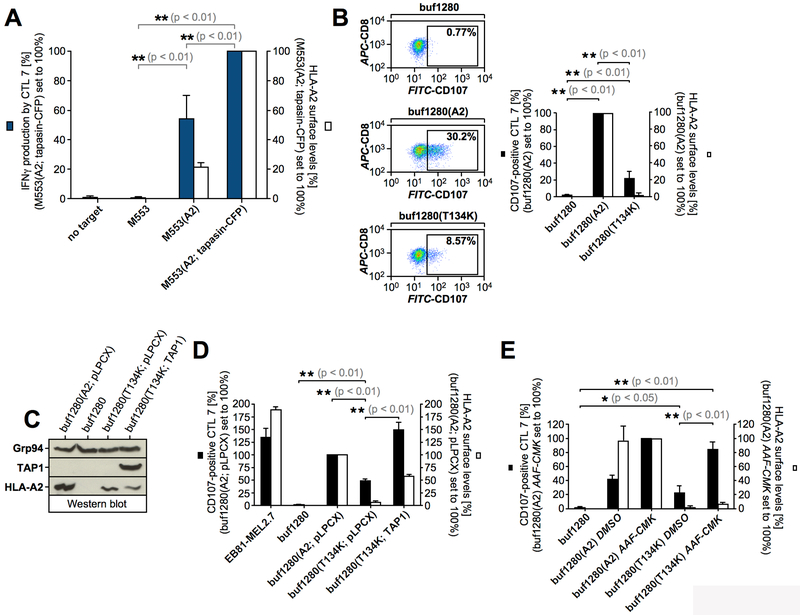
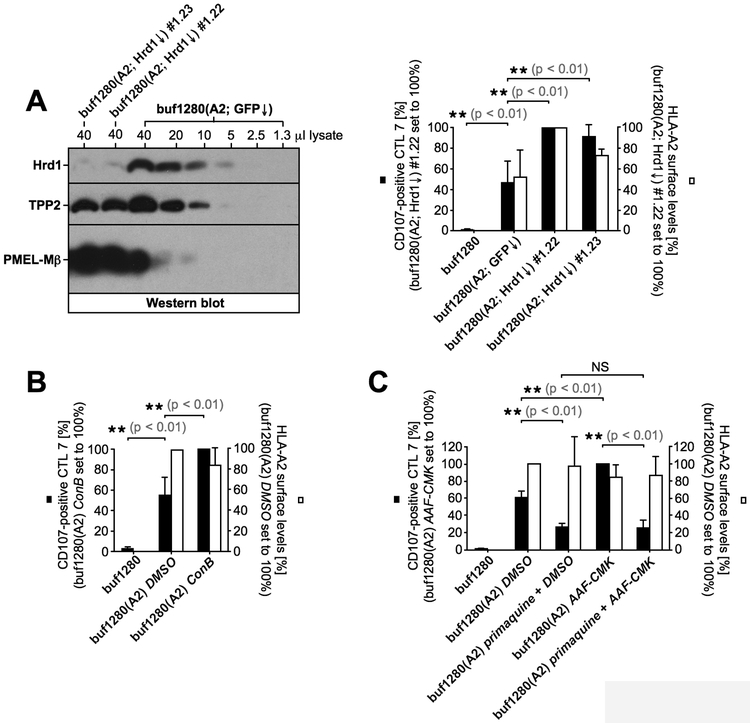
Cancer immunotherapy has been flourishing in recent years with remarkable clinical success. But as more patients are treated, a shadow is emerging that has haunted other cancer therapies: tumors develop resistance. Resistance is often caused by defects in the MHC class I Ag presentation pathway critical for CD8 T cell-mediated tumor clearance. TAP and tapasin, both key players in the pathway, are frequently downregulated in human cancers, correlating with poor patient survival. Reduced dependence on these factors may promote vaccine efficiency by limiting immune evasion. In this study, we demonstrate that PMEL209-217, a promising phase 3 trial-tested antimelanoma vaccine candidate, is robustly presented by various TAP- and/or tapasin-deficient cell lines. This striking characteristic may underlie its potency as a vaccine. Surprisingly, cytosolic proteasomes generate the peptide even for TAP-independent presentation, whereas tripeptidyl peptidase 2 (TPP2) efficiently degrades the epitope. Consequently, inhibiting TPP2 substantially boosts PMEL209-217 presentation, suggesting a possible strategy to improve the therapeutic efficacy of the vaccine.


Figures

Figure 1,
Figure 1,. TAP-independent presentation of PMEL209-217.
(A) Western blot analysis of buf1280 transfectants. (B) CTL7 recognition of target cells. Degranulated CTLs (CD107a/b+CD8+propidium iodide) are shown in the gate and their percentage among total CTLs (CD8+propidium iodide) is depicted in each dot plot (left panels). Average CTL activation in four independent degranulation assays (black bars) are shown in the bar diagram (right panel). For each experiment, HLA-A2 surface levels on target cells were determined (white bars). Error bars represent the standard deviation from the mean. A One-way ANOVA with Dunnett’s post test was performed for statistical evaluation. (C) CTL7-mediated target cell lysis measured using a europium release assay. (D) buf1280(A2) cells were treated with BFA (5 μg/ml) for 30 min, 1h, or 2h before they were used as targets in a T cell activation assay as in Fig. 1B. CTL7 degranulation (black squares) and HLA-A2 surface levels (white squares) are depicted.
Figure 2,
Figure 2,. Cytosolic processing of PMEL209-217.
(A) CTL7 activation measured by IFNγ ELISA in response to TAP-sufficient (blue bars) or TAP-inhibited (white bars) target cells (NT, not tested). (B, C) CTL7 degranulation measured in response to the indicated cell lines is shown as in Fig. 1B. CTL7 activation (black bars) and HLA-A2 surface levels on target cells (white bars) are depicted in bar diagrams. The experiment in Fig. 2C was repeated three times. Error bars represent the standard deviation from the mean of these three independent experiments. A paired two-tailed t-test was performed for statistical evaluation. Surface-HLA-A2 levels were measured in only two of these three experiments (white bars). (D, E) CTL7 activation measured by IFNγ ELISA (dark blue bars). The experiment in Fig. 2E was repeated four times. Error bars represent the standard deviation from the mean of these four independent experiments. A One-way ANOVA with Dunnett’s post test was performed for statistical evaluation. Surface-HLA-A2 levels were measured by flow cytometry in only two of these four experiments (white bars). Relatively low T cell recognition of T2(∆SS) cells in Fig. 2D reflects consistently lower sensitivity of the IFNγ ELISA compared to LAMP degranulation (Fig. 2C). (F) T cell activation of clone CTL7 (black bars), tyrosinase1-9-specific clone CTL 210/9 (red bars) and tyrosinase369-377-specific clone CTL IVSB (green bars) measured using the degranulation assay in response to the indicated cell lines. HLA-A2 surface levels are shown in white bars. (G) Expression of melanocyte differentiation antigens analyzed by RT-PCR. The dashed line indicates where an irrelevant lane was removed. (H) CTL7 activation measured in response to the indicated cell lines or cell line mixtures. Degranulation is quantified in the rightmost panel. Error bars represent the standard deviation from the mean of two independent experiments.
Figure 3,
Figure 3,. PMEL209-217 destined for TAP-independent presentation is generated by the standard proteasome.
(A, B, C, H) CTL7 degranulation is shown as in Fig. 1B. CTL7 activation (black bars) and HLA-A2 surface levels on target cells (white bars) are depicted in bar diagrams. The experiment in Fig. 3A was repeated three times. Error bars represent the standard deviation from the mean of these three independent experiments. A One-way ANOVA with Dunnett’s post test was performed for statistical evaluation. Data from this experiment was also included in Fig. 3C and 4D. The experiment in Fig. 3H was repeated four times (pLPCX, empty vector). Error bars represent the standard deviation from the mean of these four independent experiments (the control cell line buf1280(A2) was included only three times). A One-way ANOVA with Dunnett’s post test was performed for statistical evaluation. Data from this experiment was also included in Fig. 5D and 6C. (D) The standard proteasome promotes the generation of epitope PMEL209-217, while the immunoproteasome cleavage-destroys it. (E) Expression of the immunoproteasome subunit LMP7 in cells stably transduced with LMP7 or empty vector (pLPCX) analyzed by Western blotting. (F) Western blotting demonstrates that LMP7 expression does not affect endogenous PMEL expression. The PMEL ER form (P1) and the PMEL-Mβ fragment are labeled. (G) Proteasomes immunoisolated with antibody MCP21 from cells stably transduced with LMP7 or empty vector (pLPCX). Western blots were probed with antibodies against LMP7 or the standard proteasome subunit β5.
Figure 4,
Figure 4,. Tripeptidyl peptidase 2 degrades PMEL209-217 in the cytosol.
(A, C, D, G) CTL7 degranulation is shown as in Fig. 1B. CTL7 activation (black bars) and HLA-A2 surface levels on target cells (white bars) are depicted in bar diagrams. The experiment in Fig. 4A was repeated four times. Error bars represent the standard deviation from the mean of these four independent experiments (surface-HLA-A2 levels (white bars) were measured in only three of these four experiments). A One-way ANOVA with Dunnett’s post test was performed for statistical evaluation. The experiment in Fig. 4D was repeated three times. Error bars represent the standard deviation from the mean of these three independent experiments. A One-way ANOVA with Dunnett’s post test was performed for statistical evaluation. Data from this experiment was also included in Fig. 3A and 5E. The experiment in Fig. 4G was repeated four times. Error bars represent the standard deviation from the mean of these four independent experiments. A Repeated Measures ANOVA with Dunnett’s post test was performed for statistical evaluation (NS = not significant). (B) CTL7-mediated target cell lysis of buf1280 transfectants treated or not with AAF-CMK (20 μM) was measured using a europium release assay. (E) buf1280(A2) cells were acid-washed to remove surface-MHC class I and incubated at 37 °C for the indicated times (0h, 2h, 4h, 16h) in the presence (red lines) or absence (black lines) of AAF-CMK (20 μM). HLA-A2 surface levels were determined (dotted lines) and cells were used as targets in a T cell activation assay as in Fig. 1B (full lines). Where indicated, samples were additionally treated with 10 μg/ml BFA. T cell recognition was normalized with respect to untreated autologous tumor cells (EB81-MEL2.7) (left panel), or maximal response (both 16h time-points set to 100%) (right panel). (F) Various amounts of a buf1280(A2; GFP↓) control lysate were loaded on an SDS-PAGE gel together with 40 μl of a lysate derived from TPP2-silenced buf1280(A2; TPP2↓) clones #1.11 (shRNA construct #1) and #5.18 (shRNA construct #5). (H) CTL7 degranulation measured in response to buf1280(A2) cell lines stably transduced with TPP2-specific shRNA constructs #1 (buf1280(A2; TPP2↓) #1.11) or #5 (buf1280(A2; TPP2↓) #5.18) or a GFP-specific control shRNA construct (buf1280(A2; GFP↓). Error bars represent the standard deviation from the mean of five independent experiments. A One-way ANOVA with Dunnett’s post test was performed for statistical evaluation (NS = not significant).
Figure 5,
Figure 5,. TAP-independent PMEL209-217 presentation occurs in the absence of tapasin assistance.
(A) CTL7 activation measured by IFNγ ELISA (dark blue bars). The experiment was repeated three times and the error bars represent the standard deviation from the mean of these three independent experiments. A One-way ANOVA with Dunnett’s post test was performed for statistical evaluation. Surface-HLA-A2 levels were measured by flow cytometry (white bars). (B, D, E) CTL7 degranulation is shown as in Fig. 1B. CTL7 activation (black bars) and HLA-A2 surface levels on target cells (white bars) are depicted in bar diagrams. The experiment in Fig. 5B was repeated three times. Error bars represent the standard deviation from the mean of these three independent experiments (surface-HLA-A2 levels (white bars) were measured in only two of these three experiments). A One-way ANOVA with Dunnett’s post test was performed for statistical evaluation. The experiment in Fig. 5D was repeated three times (pLPCX, empty vector). Error bars represent the standard deviation from the mean of these three independent experiments. A One-way ANOVA with Dunnett’s post test was performed for statistical evaluation. Data from this experiment was also included in Fig. 3H and 6C. The experiment in Fig. 5E was repeated three times. Error bars represent the standard deviation from the mean of these three independent experiments. A One-way ANOVA with Dunnett’s post test was performed for statistical evaluation. Data from this experiment was also included in Fig. 4D. (C) Expression of HLA-A2 and TAP1 in cells stably transduced with wildtype HLA-A2 or HLA-A2 T134K and co-expressing either empty vector (pLPCX) or TAP1 was analyzed by Western blotting.
Figure 6,
Figure 6,. TAP-independent PMEL209-217 presentation requires endocytic recycling but not Hrd1-dependent ERAD.
(A) Various amounts of a buf1280(A2; GFP↓) control lysate were loaded on an SDS-PAGE gel together with 40 μl of a lysate derived from Hrd1-silenced buf1280(A2; Hrd1↓) clones #1.22 and #1.23 (shRNA construct #1) (left panel). CTL7 degranulation measured in response to buf1280(A2) cell lines stably transduced with Hrd1-specific shRNA construct #1 (buf1280(A2; Hrd1↓) #1.22 and buf1280(A2; Hrd1↓) #1.23) or a GFP-specific control shRNA construct (buf1280(A2; GFP↓). Error bars represent the standard deviation from the mean of three independent experiments. A One-way ANOVA with Dunnett’s post test was performed for statistical evaluation (right panel). (B, C) CTL7 degranulation is shown as in Fig. 1B. CTL7 activation (black bars) and HLA-A2 surface levels on target cells (white bars) are depicted in bar diagrams. Both experiments were repeated three times. Error bars represent the standard deviation from the mean of these three independent experiments. A One-way ANOVA with Dunnett’s post test was performed for statistical evaluation (NS = not significant). Some data shown in Fig. 6C was also included in Fig. 3A, 4D, and 5D.

Similar articles

Cited by

References

    1. Dimberu PM, and Leonhardt RM. 2011. Cancer immunotherapy takes a multi-faceted approach to kick the immune system into gear. The Yale journal of biology and medicine 84:371–380. - PMC - PubMed
    1. Vigneron N 2015. Human Tumor Antigens and Cancer Immunotherapy. BioMed research international 2015:948501. - PMC - PubMed
    1. Ji RR, Chasalow SD, Wang L, Hamid O, Schmidt H, Cogswell J, Alaparthy S, Berman D, Jure-Kunkel M, Siemers NO, Jackson JR, and Shahabi V. 2012. An immune-active tumor microenvironment favors clinical response to ipilimumab. Cancer Immunol Immunother 61:1019–1031. - PMC - PubMed
    1. Tumeh PC, Harview CL, Yearley JH, Shintaku IP, Taylor EJ, Robert L, Chmielowski B, Spasic M, Henry G, Ciobanu V, West AN, Carmona M, Kivork C, Seja E, Cherry G, Gutierrez AJ, Grogan TR, Mateus C, Tomasic G, Glaspy JA, Emerson RO, Robins H, Pierce RH, Elashoff DA, Robert C, and Ribas A. 2014. PD-1 blockade induces responses by inhibiting adaptive immune resistance. Nature 515:568–571. - PMC - PubMed
    1. Vigneron N, Stroobant V, Van den Eynde BJ, and van der Bruggen P. 2013. Database of T cell-defined human tumor antigens: the 2013 update. Cancer immunity 13:15. - PMC - PubMed

Publication types

MeSH terms