. 2018 Oct 5;293(40):15715-15724.
doi: 10.1074/jbc.RA118.004789. Epub 2018 Aug 22.

Heterogeneity of hypochlorous acid production in individual neutrophil phagosomes revealed by a rhodamine-based probe

Affiliations

Heterogeneity of hypochlorous acid production in individual neutrophil phagosomes revealed by a rhodamine-based probe

Amelia M Albrett et al. J Biol Chem. .

Abstract

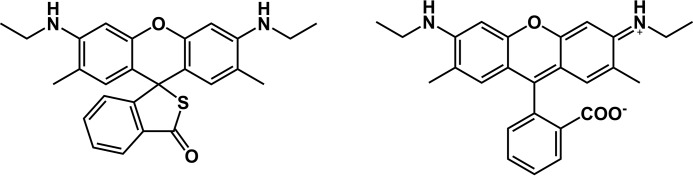
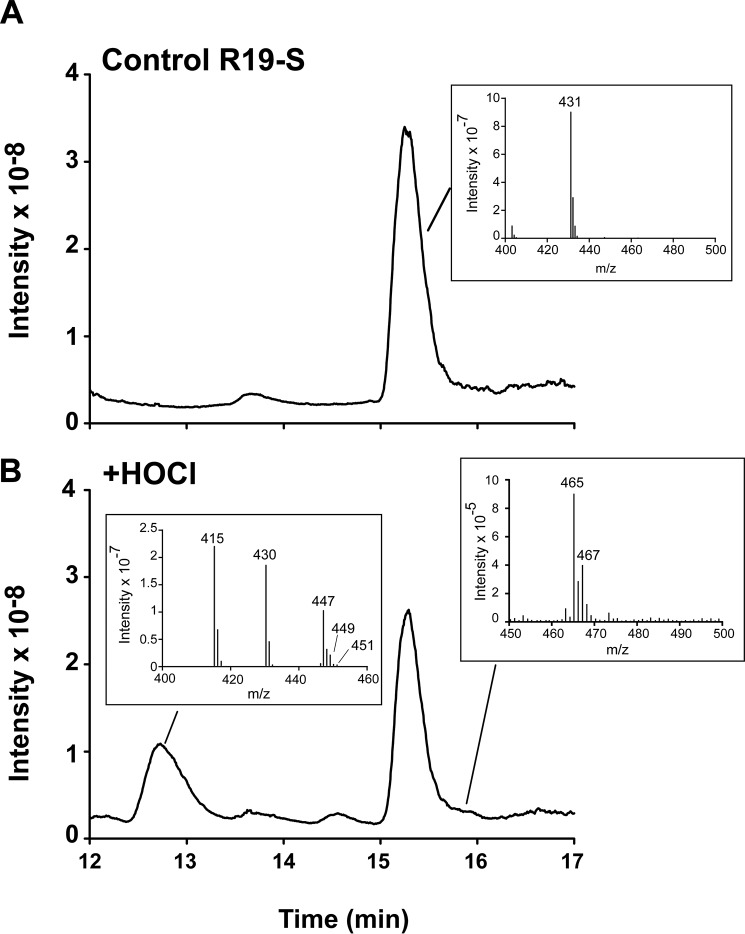
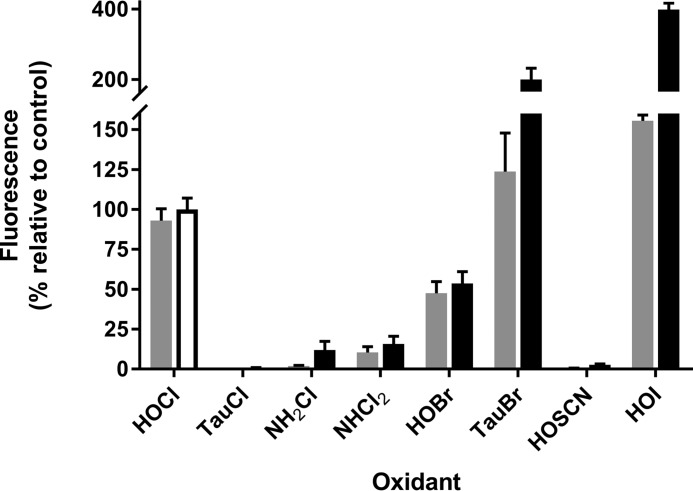
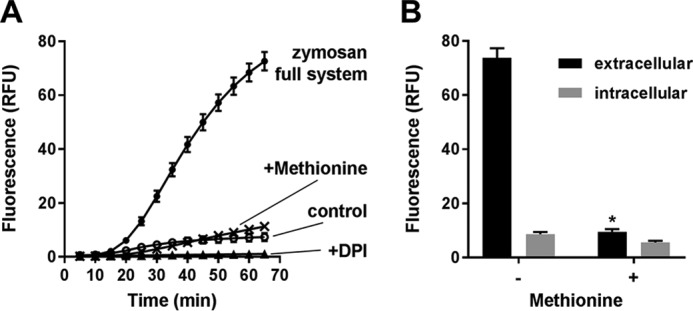
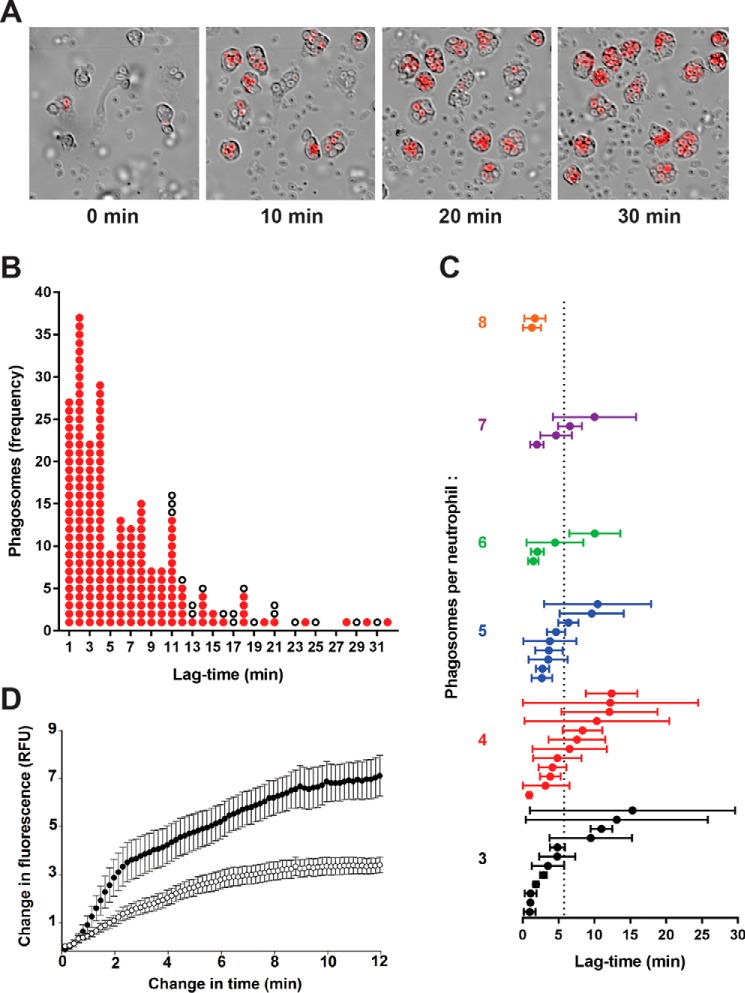
The rhodamine-based probe R19-S has been shown to react with hypochlorous acid (HOCl) to yield fluorescent R19, but not with some other oxidants including hydrogen peroxide. Here, we further examined the specificity of R19-S and used it for real-time monitoring of HOCl production in neutrophil phagosomes. We show that it also reacts rapidly with hypobromous acid, bromamines, and hypoiodous acid, indicating that R19-S responds to these reactive halogen species as well as HOCl. Hypothiocyanous acid and taurine chloramine were unreactive, however, and ammonia chloramine and dichloramine reacted only very slowly. MS analyses revealed additional products from the reaction of HOCl with R19-S, including a chlorinated species as a minor product. Of note, phagocytosis of opsonized zymosan or Staphylococcus aureus by neutrophils was accompanied by an increase in R19 fluorescence. This increase depended on NADPH oxidase and myeloperoxidase activities, and detection of chlorinated R19-S confirmed its specificity for HOCl. Using live-cell imaging to track individual phagosomes in single neutrophils, we observed considerable heterogeneity among the phagosomes in the time from ingestion of a zymosan particle to when fluorescence was first detected, ranging from 1 to >30 min. However, once initiated, the subsequent fluorescence increase was uniform, reaching a similar maximum in ∼10 min. Our results confirm the utility of R19-S for detecting HOCl in real-time and provide definitive evidence that isolated neutrophils produce HOCl in phagosomes. The intriguing variability in the onset of HOCl production among phagosomes identified here could influence the way they kill ingested bacteria.

Keywords: host-pathogen interaction; hypobromous; hypochlorous; myeloperoxidase; neutrophil; oxidative stress; phagocytosis.


Conflict of interest statement

The authors declare that they have no conflicts of interest with the contents of this article

Figures

Figure 1.
Figure 1.
Structures of R19-S (left) and R19 (right).
Figure 2.
Figure 2.
Detection of multiple products formed from R19-S and HOCl by LC-MS. A and B, total ion chromatograms of (A) R19-S (20 μm) before and (B) after incubation with HOCl (10 μm). Insets show mass spectra for R19-S (431), and the peaks containing R19 (415) and R19S-Cl (465/467).
Figure 3.
Figure 3.
Assessment of reaction kinetics between R19-S and HOCl by competition with N-α-acetyl-lysine. 10 (○) or 100 μm (●) R19-S was mixed with increasing concentrations of N-α-acetyl-Lys in PBS, then 5 μm HOCl was added while vortexing. Fluorescence (excitation 515/emission 550) was measured immediately upon transfer of the reaction mixture into a platereader. The fluorescence in the absence of N-α-acetyl-Lys is the control value for formation of fluorescent R19. Each data point is the mean ± S.D. of the % inhibition measured in three separate experiments.
Figure 4.
Figure 4.
Fluorescence response of R19-S to hypohalous acids, chloramines, and bromamines. Reactions were carried out in PBS by mixing 10 μm R19-S and 10 μm of each oxidant while vortexing. The fluorescence response was measured at 5 (gray bars) and 60 min (black bars) using a platereader. TauCl, taurine chloramine; TauBr, taurine bromamine. Results are expressed as a percent of the fluorescence observed with HOCl at 60 min (white-filled bar) and are mean ± S.D. from three independent experiments. The products with HOI, as well as having high fluorescence, showed a different UV-visible spectrum from that with HOCl, with higher absorbing peaks in the 515 nm excitation band region.
Figure 5.
Figure 5.
Detection of R19-S oxidation by phagocytic neutrophils using fluorimetry. A, total R19-S fluorescence detected for neutrophils stimulated with opsonized zymosan (1:20) in the absence (●) or presence of DPI (▴) or methionine (×). Control cells (○) have no zymosan added. Incubations were carried out in HBSS in 96-well plates and fluorescence (excitation 515/emission 550 nm) was measured at intervals up to 65 min. B, fluorescence of extracellular (black) and intracellular (gray) fractions prepared from neutrophils after 70 min incubation with zymosan ± methionine (1 mm) as in A. Statistically significant decrease in fluorescence of the extracellular (*, p = 0.013, paired t test) but not intracellular fractions. Results are mean ± S.E. from three independent experiments.
Figure 6.
Figure 6.
Detection of HOCl production within neutrophils stimulated by zymosan or bacteria, and dependence on NOX2 activity and MPO. A, flow cytometry scattergrams from unstimulated neutrophils (polymorphonuclear (PMN), top) and neutrophils stimulated with 20:1 zymosan in HBSS containing 1 mm methionine, in the absence (middle) and presence (bottom) of DPI, recorded after 30 min. The gated neutrophil populations (left panels) were analyzed for R19 fluorescence (middle panels) and represented as histograms (right panels). B, corresponding merged R19 fluorescence (red) and bright field (Cy3/DIC) images of neutrophils treated for 30 min as in A and recorded by fluorescence microscopy. C, time course of mean fluorescence increase for the entire neutrophil population treated as in A for neutrophils that were unstimulated (○) or stimulated with zymosan in the absence (●) or presence (▴) of DPI or treated in chloride-free gluconate buffer (×). Results show mean ± S.E. from three independent experiments. Data points are normalized against the fluorescence (93 FU) of phagocytic neutrophils at 30 min. D, detection of R19 and R19S-Cl by LC-MS in neutrophils (106) harvested and lysed following 30 min stimulation as in A. Data are means of duplicates ± S.D. from a representative of two independent experiments. E, R19-S fluorescence increase over time measured by flow cytometry as in A following addition of S. aureus (at 10:1) to normal neutrophils in the absence (●) or presence (▴) of MPO inhibitor TX1, and neutrophils from an individual with MPO deficiency (×), compared with normal neutrophils incubated without bacteria (○). Results show mean ± S.D., the mean maximum fluorescence of normal neutrophils after phagocytosing bacteria was 13 FU. F, inhibition of R19 fluorescence by MPO inhibitors. Neutrophils were incubated with S. aureus (at 10:1) in the presence of 1 mm methionine for 30 min with and without pre-exposure for 10 min to 10 μm TX1 or HX1. *, significance relative to S. aureus with no inhibitor as determined by one-way analysis of variance with Dunnett's post-test correction for multiple comparisons (p ≤ 0.0001).
Figure 7.
Figure 7.
Effect of delivering zymosan-bound SOD to neutrophil phagosomes. Neutrophils (5 × 10⁶/ml) were pretreated with either 10 μm dihydroethidium (gray bars) or 10 μm R19-S (black bars), and then incubated with the zymosan preparations (5 × 10⁷/ml) for 30 min at 37 °C. Mean intracellular fluorescence of the neutrophils was measured by flow cytometry, and values are expressed relative to the fluorescence with normal zymosan. *, dihydroethidium fluorescence significantly decreased and R19 fluorescence significantly increased with SOD-linked zymosan compared with phagocytosis of normal zymosan or inactive SOD-zymosan (p < 0.01, paired t test). Results are mean ± S.D. from three separate experiments.
Figure 8.
Figure 8.
HOCl production in individual phagosomes of neutrophils stimulated with opsonized zymosan as assessed by live-cell fluorescence imaging. A, time-lapse frames at 0, 10, 20, and 30 min from a movie of neutrophils and R19-S incubated with zymosan particles (1:20). Images show merged Cy3/DIC channels, and the full video is available in Movie S1. B, analysis of 233 phagosomes from 54 neutrophils monitored in a typical experiment as in A. The change in time is the interval between frames when phagocytosis of a particle occurred and R19 fluorescence first appeared. Each phagosome is plotted as a red dot against the time it took to start fluorescing. White dots represent phagosomes that formed in the first 20 min of the movie, but failed to fluoresce within the plotted time change until the end of the video. C, mean lag-times for fluorescence in neutrophils with three or more phagosomes. Each plotted circle represents one of 43 monitored neutrophils, where the mean lag-time ± S.D. was calculated for the initial appearance of detectable fluorescence in its phagosomes after ingestion of a zymosan particle. The neutrophils are arranged vertically in increasing order of how many phagosomes were monitored per neutrophil. The mean lag-time across all 197 fluorescent phagosomes was 5.8 min, indicated by the dotted line. D, the development of fluorescence in phagosomes was compared for neutrophils incubated with zymosan in the absence (●) or presence (○) of MPO inhibitor TX1 (10 μm). The increase in fluorescence intensity is plotted against time, starting from when it was first detectable. Data points are the mean ± S.E. from 20 phagosomes analyzed in three separate experiments. A low fluorescence intensity was set and each video frame was analyzed until maximum fluorescence was obtained using Cell R software.

References

    1. Hurst J. K. (2012) What really happens in the neutrophil phagosome? Free Radic. Biol. Med. 53, 508–520 10.1016/j.freeradbiomed.2012.05.008 - DOI - PMC - PubMed
    1. Klebanoff S. J. (2005) Myeloperoxidase: friend and foe. J. Leukoc. Biol. 77, 598–625 10.1189/jlb.1204697 - DOI - PubMed
    1. Rosen H., Klebanoff S. J., Wang Y., Brot N., Heinecke J. W., and Fu X. (2009) Methionine oxidation contributes to bacterial killing by the myeloperoxidase system of neutrophils. Proc. Natl. Acad. Sci. U.S.A. 106, 18686–18691 10.1073/pnas.0909464106 - DOI - PMC - PubMed
    1. Klebanoff S. J., Kettle A. J., Rosen H., Winterbourn C. C., and Nauseef W. M. (2013) Myeloperoxidase: a front-line defender against phagocytosed microorganisms. J. Leukoc. Biol. 93, 185–198 10.1189/jlb.0712349 - DOI - PMC - PubMed
    1. Winterbourn C. C., Kettle A. J., and Hampton M. B. (2016) Reactive oxygen species and neutrophil function. Annu. Rev. Biochem. 85, 765–792 10.1146/annurev-biochem-060815-014442 - DOI - PubMed

Publication types

MeSH terms

Supplementary concepts