

Dynamic modelling of personal protection control strategies for vector-borne disease limits the role of diversity amplification
- PMID: 30135260
- PMCID: PMC6127172
- DOI: 10.1098/rsif.2018.0166
Dynamic modelling of personal protection control strategies for vector-borne disease limits the role of diversity amplification
Abstract
Personal protection measures, such as bed nets and repellents, are important tools for the suppression of vector-borne diseases like malaria and Zika, and the ability of health agencies to distribute protection and encourage its use plays an important role in the efficacy of community-wide disease management strategies. Recent modelling studies have shown that a counterintuitive diversity-driven amplification in community-wide disease levels can result from a population's partial adoption of personal protection measures, potentially to the detriment of disease management efforts. This finding, however, may overestimate the negative impact of partial personal protection as a result of implicit restrictive model assumptions regarding host compliance, access to and longevity of protection measures. We establish a new modelling methodology for incorporating community-wide personal protection distribution programmes in vector-borne disease systems which flexibly accounts for compliance, access, longevity and control strategies by way of a flow between protected and unprotected populations. Our methodology yields large reductions in the severity and occurrence of amplification effects as compared to existing models.
Keywords: bed nets; diversity amplification; epidemiological control; insect repellent; personal protection; vector-borne disease.
© 2018 The Author(s).
Conflict of interest statement
We declare we have no competing interests.
Figures
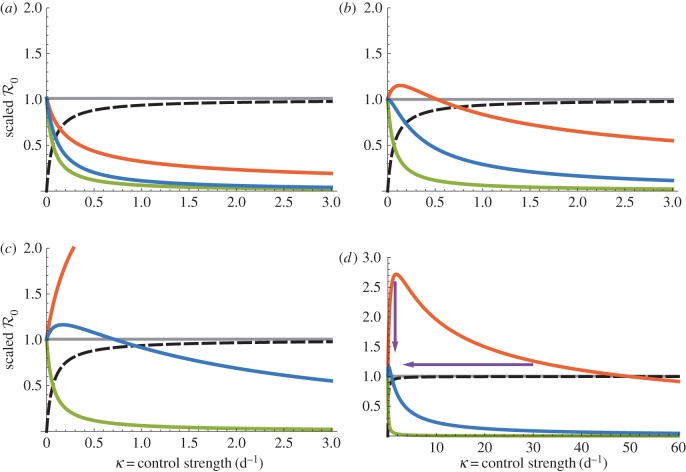
 on DEET (1/γ = 15 days) control strength for the dynamic two-class model (blue), static two-class model (red) and one-class model (green). Corresponding equilibrium proportions of protected hosts are given by the dashed black curve. Two-host models display diversity amplification at control strengths where respective scaled
  curves rise above the grey
  line. Large suppressions in amplification severity and occurrence range are indicated by vertical and horizontal purple arrows, respectively, in (d). (a) Density-dependent infection ANh = 0.1 d−1, (b) moderate infection ANh = 1.0 d−1, (c) frequency-dependent infection ANh = 10.0 d−1 and (d) frequency-dependent infection (wide view).
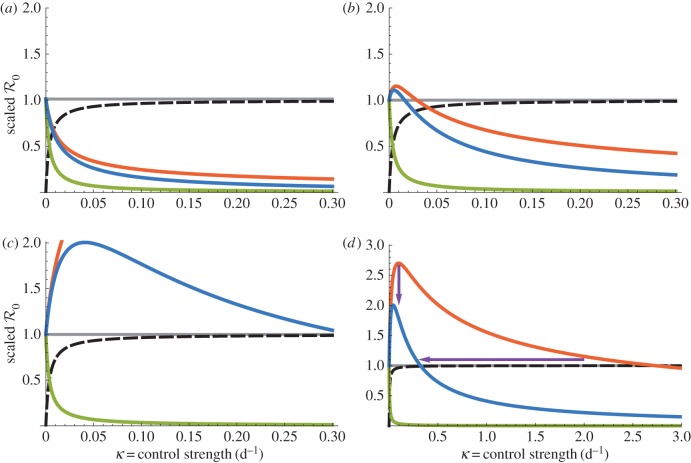
 on intermediate protection (1/γ = 9 months) control strength for the dynamic two-class model (blue), static two-class model (red) and one-class model (green). Corresponding equilibrium proportions of protected hosts are given by the dashed black curve. Large suppressions in amplification severity and occurrence range are indicated by vertical and horizontal purple arrows, respectively, in (d). (a) Density-dependent infection ANh = 0.1 d−1, (b) moderate infection ANh = 1.0 d−1, (c) frequency-dependent infection ANh = 10.0 d−1 and (d) frequency-dependent infection (wide view).
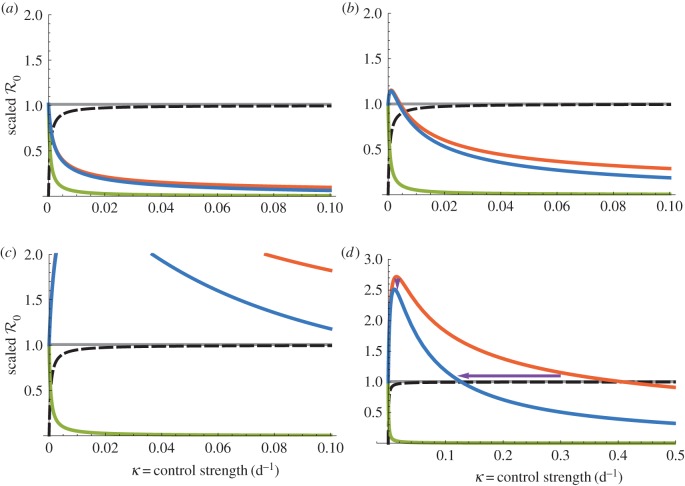
 on bed net (1/γ = 5 years) control strength for the dynamic two-class model (blue), static two-class model (red) and one-class model (green). Corresponding equilibrium proportions of protected hosts are given by the dashed black curve. Suppressions in amplification severity and occurrence range are indicated by vertical and horizontal purple arrows, respectively, in (d). (a) Density-dependent infection ANh = 0.1 d−1, (b) moderate infection ANh = 1.0 d−1, (c) frequency-dependent infection ANh = 10.0 and (d) frequency-dependent infection (wide view).
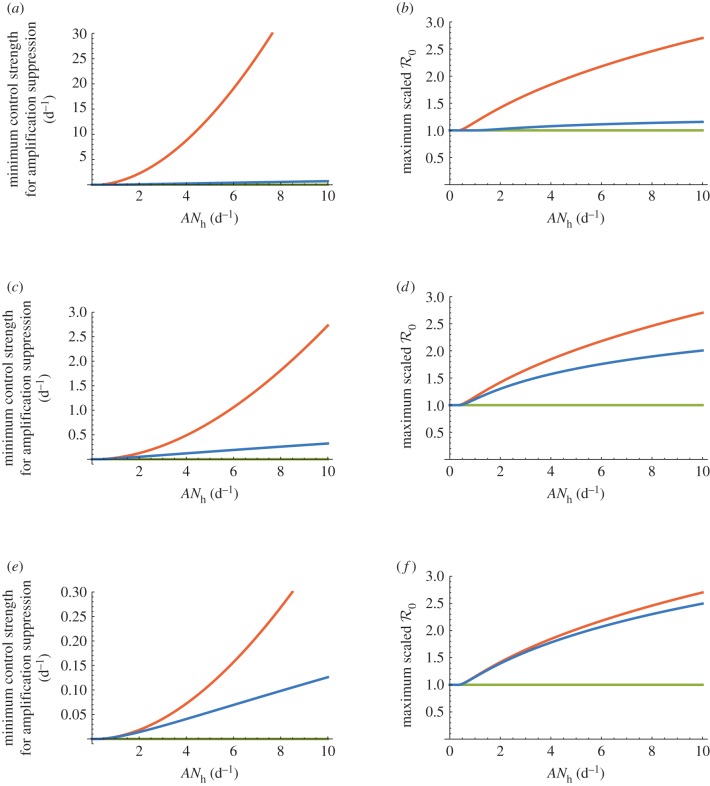
 exceeds unity for all control strengths κ ∈ [0, κ*]. The maximum scaled
  is the value of scaled
  at the peak of a model's
  versus κ curve for a given value of ANh. (a) Amplifaction range reduction 1/γ = 15 days, (b) amplifaction severity reduction 1/γ = 15 days, (c) amplifaction range reduction 1/γ = 9 months, (d) amplifaction severity reduction 1/γ = 9 months, (e) amplifaction range reduction 1/γ = 5 years and (f) amplifaction severity reduction 1/γ = 5 years.
Similar articles
-
A general modeling framework for exploring the impact of individual concern and personal protection on vector-borne disease dynamics.Parasit Vectors. 2022 Oct 8;15(1):361. doi: 10.1186/s13071-022-05481-7. Parasit Vectors. 2022. PMID: 36209182 Free PMC article.
-
Preparing the United States for Zika Virus: Pre-emptive Vector Control and Personal Protection.Wilderness Environ Med. 2016 Dec;27(4):450-457. doi: 10.1016/j.wem.2016.07.006. Epub 2016 Oct 27. Wilderness Environ Med. 2016. PMID: 28340908
-
Current vector control challenges in the fight against malaria.Acta Trop. 2017 Oct;174:91-96. doi: 10.1016/j.actatropica.2017.06.028. Epub 2017 Jul 3. Acta Trop. 2017. PMID: 28684267 Review.
-
Declining malaria, rising of dengue and Zika virus: insights for mosquito vector control.Parasitol Res. 2016 May;115(5):1747-54. doi: 10.1007/s00436-016-4971-z. Epub 2016 Mar 2. Parasitol Res. 2016. PMID: 26932263 Review.
-
Is outdoor vector control needed for malaria elimination? An individual-based modelling study.Malar J. 2017 Jul 3;16(1):266. doi: 10.1186/s12936-017-1920-y. Malar J. 2017. PMID: 28673298 Free PMC article.
Cited by
-
Human-Mosquito Contact: A Missing Link in Our Understanding of Mosquito-Borne Disease Transmission Dynamics.Ann Entomol Soc Am. 2021 May 10;114(4):397-414. doi: 10.1093/aesa/saab011. eCollection 2021 Jul. Ann Entomol Soc Am. 2021. PMID: 34249219 Free PMC article. Review.
-
A general modeling framework for exploring the impact of individual concern and personal protection on vector-borne disease dynamics.Parasit Vectors. 2022 Oct 8;15(1):361. doi: 10.1186/s13071-022-05481-7. Parasit Vectors. 2022. PMID: 36209182 Free PMC article.
-
Perspectives of vector management in the control and elimination of vector-borne zoonoses.Front Microbiol. 2023 Mar 21;14:1135977. doi: 10.3389/fmicb.2023.1135977. eCollection 2023. Front Microbiol. 2023. PMID: 37025644 Free PMC article. Review.
-
Leaf Curl Epidemic Risk in Chilli as a Consequence of Vector Migration Rate and Contact Rate Dynamics: A Critical Guide to Management.Viruses. 2023 Mar 27;15(4):854. doi: 10.3390/v15040854. Viruses. 2023. PMID: 37112834 Free PMC article.
References
-
- MacDonald G. 1957. The epidemiology and control of malaria. Oxford, UK: Oxford University Press.
-
- Ross R. 1911. Some quantitative studies in epidemiology. Nature 87, 466–467. (10.1038/087466a0) - DOI
Publication types
MeSH terms
LinkOut - more resources
Full Text Sources
Other Literature Sources
Medical
