

Chronic kidney disease attenuates the plasma metabolome response to insulin
- PMID: 30135309
- PMCID: PMC6141172
- DOI: 10.1172/jci.insight.122219
Chronic kidney disease attenuates the plasma metabolome response to insulin
Abstract
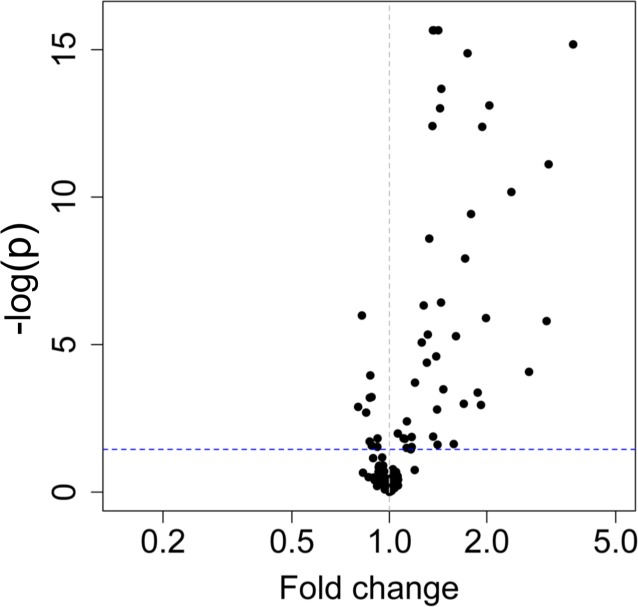
Chronic kidney disease (CKD) leads to decreased sensitivity to the metabolic effects of insulin, contributing to protein energy wasting and muscle atrophy. Targeted metabolomics profiling during hyperinsulinemic-euglycemic insulin clamp testing may help identify aberrant metabolic pathways contributing to insulin resistance in CKD. Using targeted metabolomics profiling, we examined the plasma metabolome in 95 adults without diabetes in the fasted state (58 with CKD, 37 with normal glomerular filtration rate [GFR]) who underwent hyperinsulinemic-euglycemic clamp. We assessed heterogeneity in fasting metabolites and the response to insulin to identify potential metabolic pathways linking CKD with insulin resistance. Baseline differences and effect modification by CKD status on changes with insulin clamp testing were adjusted for confounders. Mean GFR among participants with CKD was 37.3 compared with 89.3 ml/min per 1.73 m2 among controls. Fasted-state differences between CKD and controls included abnormalities in tryptophan metabolism, ubiquinone biosynthesis, and the TCA cycle. Insulin infusion markedly decreased metabolite levels, predominantly amino acids and their metabolites. CKD was associated with attenuated insulin-induced changes in nicotinamide, arachidonic acid, and glutamine/glutamate metabolic pathways. Metabolomics profiling suggests disruption in amino acid metabolism and mitochondrial function as putative manifestations or mechanisms of the impaired anabolic effects of insulin in CKD.
Keywords: Amino acid metabolism; Insulin; Metabolism; Mitochondria; Nephrology.
Conflict of interest statement
Figures


References
-
- Shahim B, et al. The Prognostic Value of Fasting Plasma Glucose, Two-Hour Postload Glucose, and HbA1c in Patients With Coronary Artery Disease: A Report From EUROASPIRE IV: A Survey From the European Society of Cardiology. Diabetes Care. 2017;40(9):1233–1240. doi: 10.2337/dc17-0245. - DOI - PMC - PubMed
-
- DeFronzo R, Smith D, Alvestrand A. Insulin action in uremia. Kidney Int Suppl. 1983;16:S102–S 14. - PubMed
Publication types
MeSH terms
Substances
Grants and funding
LinkOut - more resources
Full Text Sources
Other Literature Sources
Medical
