. 2018 Aug 22;10(9):1141.
doi: 10.3390/nu10091141.

Epigallocatechin-3-gallate and 6-OH-11-O-Hydroxyphenanthrene Limit BE(2)-C Neuroblastoma Cell Growth and Neurosphere Formation In Vitro

Affiliations

Epigallocatechin-3-gallate and 6-OH-11-O-Hydroxyphenanthrene Limit BE(2)-C Neuroblastoma Cell Growth and Neurosphere Formation In Vitro

Fulvia Farabegoli et al. Nutrients. .

Abstract

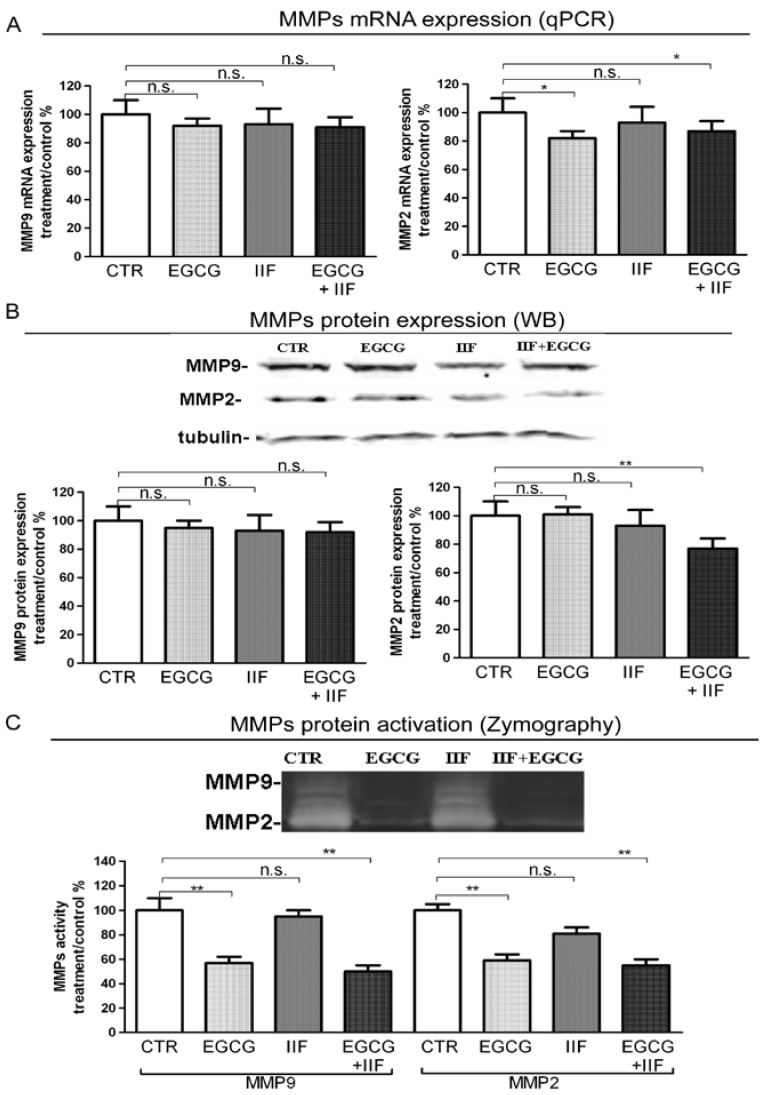
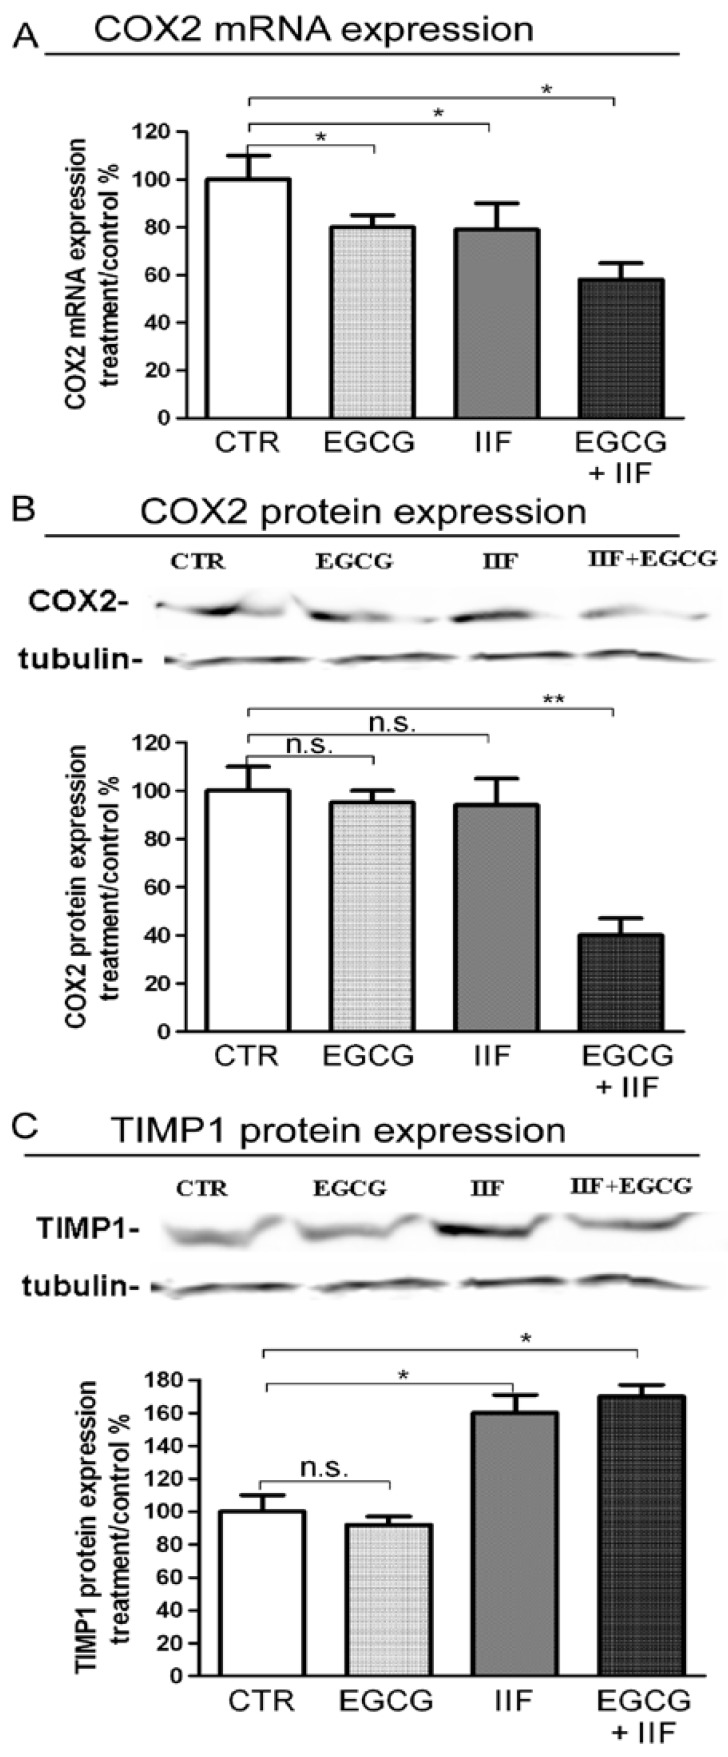
We conducted an in vitro study combining a rexinoid, 6-OH-11-O-hydroxyphenanthrene (IIF), and epigallocatechin-3-gallate (EGCG), which is the main catechin of green tea, on BE(2)-C, a neuroblastoma cell line representative of the high-risk group of patients. Neuroblastoma is the most common malignancy of childhood: high-risk patients, having N-MYC over-expression, undergo aggressive therapy and show high mortality or an increased risk of secondary malignancies. Retinoids are used in neuroblastoma therapy with incomplete success: the association of a second molecule might improve the efficacy. BE(2)-C cells were treated by EGCG and IIF, individually or in combination: cell viability, as evaluated by 3-(4,5-dimethylthiazol-2-yl)-2,5-diphenyl tetrazolium bromide (MTT) assay, was reduced, EGCG+IIF being the most effective treatment. Apoptosis occurred and the EGCG+IIF treatment decreased N-MYC protein expression and molecular markers of invasion (MMP-2, MMP-9 and COX-2). Zymography demonstrated nearly 50% inhibition of MMP activity. When BE(2)-C cells were grown in non-adherent conditions to enrich the tumor-initiating cell population, BE(2)-C-spheres were obtained. After 48 h and 72 h treatment, EGCG+IIF limited BE(2)-C-sphere formation and elicited cell death with a reduction of N-MYC expression. We concluded that the association of EGCG to IIF might be applied without toxic effects to overcome the incomplete success of retinoid treatments in neuroblastoma patients.

Keywords: 6-OH-11-O-hydroxyphenanthrene; BE(2)-C; EGCG; N-MYC; neuro-sphere; neuroblastoma.


Conflict of interest statement

The authors declare they have no conflict of interest.

Figures

Figure 1
Figure 1
RARα β and γ mRNA expression and RARα protein expression in BE(2)-C neuroblastoma cells. Cells were treated with 20 μg/mL epigallocatechin-3-gallate (EGCG) and 10 μM 6-OH-11-O-hydroxyphenanthrene (IIF), individually and in combination for 24 h. (A,C,D) RARα β and γ mRNA expression as detected by qPCR in control (CTR) and treated samples. (B) RARα protein expression. Proteins (50 μg) from total cell lysates were subjected to Sodium Dodecyl Sulphate-PolyAcrylamide Gel Electrophoresis SDS–PAGE and Western blot analysis. The values were normalized to the untreated controls. β-tubulin was used as a loading control. The results are expressed as the average ± standard errors (SE) of three independent experiments. * p < 0.05; ** p < 0.01; *** p < 0.001. n.s.: not significant.
Figure 2
Figure 2
RARα β and γ mRNA expression and RXRγ protein expression in BE(2)-C neuroblastoma cells. Cells were treated with 20 μg/mL l EGCG and 10 μM 6-OH-11-O-hydroxyphenanthrene (IIF), individually and in combination for 24 h. RXRα (A) and RXRβγ (B) mRNA expression as detected by qPCR in control (CTR) and treated samples. (C) RXRγ protein expression. Proteins (50 μg) from total cell lysates were subjected to SDS–PAGE and Western blot analysis. The values were normalized to the untreated controls. β-tubulin was used as a loading control. The results are expressed as the average ± SE of three independent experiments. * p < 0.05; ** p < 0.01. n.s.: not significant.
Figure 3
Figure 3
Inhibitory effects of EGCG and IIF treatments on BE(2)-C neuroblastoma cell growth as evaluated by 3-(4,5-dimethylthiazol-2-yl)-2,5-diphenyl tetrazolium bromide (MTT) assay. (A) EGCG cytotoxicity time-course (24 h–48 h–72 h) at different concentrations (5, 10, 15, 20 μg/mL). (B) IIF cytotoxicity time-course (24 h–48 h–72 h) at different concentrations (5, 10, 15, 20 μM). (C) EGCG (20 μg/mL) and IIF (10 μM) (EGCG+IIF) combination. The results are expressed as the average ± SE of three independent experiments. * p < 0.05; ** p < 0.01. n.s.: not significant.
Figure 4
Figure 4
Effect of EGCG and IIF treatments on apoptosis-related proteins in BE(2)-C neuroblastoma cells. Modulation of Bcl-2 and cleaved PARP levels after 24 h individual and combined 20 μg/mL EGCG and 10 μM IIF treatments. Proteins (50 μg) from total cell lysates were subjected to SDS–PAGE and Western blot analysis while using Bcl-2 (A) and cleaved PARP antibodies (B). The values were normalized to the untreated controls. β-tubulin was used as a loading control. The results are expressed as the average ± SE of three independent experiments. * p < 0.05. n.s.: not significant.
Figure 5
Figure 5
Downregulation of N-MYC expression by EGCG and IIF treatments in BE(2)-C neuroblastoma cells. Cells were treated with 20 μg/mL EGCG and 10 μM IIF, individually and in combination. N-MYC qPCR analysis in control and treated cells after 4 h (A) and 24 h (B). GAPDH was used as a control. (C) Proteins (50 μg) from total cell lysates were subjected to SDS–PAGE and Western blot analysis of N-MYC expression after 24 h treatments. The values were normalized to the untreated controls. β-tubulin was used as a loading control. The results are expressed as the average ± SE of three independent experiments. * p < 0.05; ** p < 0.01. n.s.: not significant. GAPDH: Glyceraldehyde 3-phosphate dehydrogenase.
Figure 6
Figure 6
Downregulation of EGFR and p1068EGFR expression by EGCG and IIF treatments in BE(2)-C neuroblastoma cells. Cells were treated with 20 μg/mL EGCG and 10 μM IIF, individually and in combination for 24 h. (A) Proteins (50 μg) from total cell lysate were subjected to SDS–PAGE and Western blot analysis of EGFR and p1068EGFR expression after 24 h treatments. Actin was used as a loading control. RT-PCR analysis of EGFR (B) and NDRG1 (C) in control and treated cells. β-actin was used as a control. The values were normalized to the untreated controls. The results are expressed as the average ± SE of three independent experiments. * p < 0.05; ** p < 0.01. n.s.: not significant. WB: western blot; RT-PCR: reverse transcriptase-polymerase chain reaction.
Figure 7
Figure 7
MMP-2 and MMP-9 expression and activity after EGCG and IIF treatments in BE(2)-C neuroblastoma cells. Cells were treated with 20 μg/mL EGCG and 10 μM IIF, individually and in combination for 24 h. (A) MMP-2 and MMP-9 qPCR was performed after RNA isolation and GAPDH was used as an internal control. (B) Western blot analysis of MMP-2 and MMP-9. The values were normalized to the untreated controls. β-tubulin was used as a loading control. (C) Zymography analysis of MMP-2 and MMP-9. Cells were seeded and after 18 h placed in serum-free medium with EGCG (20 μg/mL) or IIF (10 μM) or both for 24 h. MMP activity is indicated by clear bands. The results are expressed as the average ± SE of three independent experiments. * p < 0.05; ** p < 0.01. n.s.: not significant. MMP-2: Metalloproteinase-2 (MMP-2); MMP-9: Metalloproteinase-9.
Figure 8
Figure 8
COX-2 and TIMP-1 expression after EGCG and IIF treatments in BE(2)-C neuroblastoma cells. (A) Cells were treated with 20 μg/mL EGCG and 10 μM IIF, individually and in combination for 24 h. (A) qPCR of COX-2 expression was performed after RNA isolation. GAPDH was used as an internal control. Western blot analysis of COX-2 (B) and TIMP-1 (C). The values were normalized to the untreated controls. β-tubulin was used as a loading control. The results are expressed as the average ± SE of three independent experiments. * p < 0.05; ** p < 0.01. n.s.: not significant.
Figure 9
Figure 9
EGCG and IIF treatments limited sphere formation and N-MYC expression in BE(2)-C neuroblastoma cells. (A) Neural cancer stem cells (NCSC). Parental adherent BE(2)-cells were grown in non-adherent serum-free conditions to develop spheres for 72 h (CTR) and treated with 20 μg/mL EGCG and 10 μM IIF, individually and in combination for 72 h. Viability was evaluated by Trypan blue assay. (B) N-MYC mRNA expression was evaluated by qPCR in control (CTR) and treated cells. GAPDH was used as a loading control. The results are expressed as the average ± SE of three independent experiments. * p < 0.05. n.s.: not significant.

Similar articles

Cited by

References

    1. Speleman F., Park J.R., Henderson T.O. Neuroblastoma: A Tough Nut to Crack. Am. Soc. Clin. Oncol. Educ. Book. 2016;35:e548–e557. doi: 10.14694/EDBK_159169. - DOI - PubMed
    1. Applebaum M.A., Desai A.V., Glade Bender J.L., Cohn S.L. Emerging and investigational therapies for neuroblastoma. Expert Opin. Orphan Drugs. 2017;5:355–368. doi: 10.1080/21678707.2017.1304212. - DOI - PMC - PubMed
    1. Maris J.M. Recent advances in neuroblastoma. N. Engl. J. Med. 2010;362:2202–2211. doi: 10.1056/NEJMra0804577. - DOI - PMC - PubMed
    1. Reynolds C.P., Matthay K.K., Villablanca J.G., Maurer B.J. Retinoid therapy of high-risk neuroblastoma. Cancer Lett. 2003;197:185–192. doi: 10.1016/S0304-3835(03)00108-3. - DOI - PubMed
    1. Peinemann F., van Dalen E.C., Enk H., Berthold F. Retinoic acid postconsolidation therapy for high-risk neuroblastoma patients treated with autologous haematopoietic stem cell transplantation. Cochrane Database Syst. Rev. 2017;8:CD010685. doi: 10.1002/14651858.CD010685.pub3. - DOI - PMC - PubMed

MeSH terms