

Evaluating the Coordination of Industrial-Economic Development Based on Anthropogenic Carbon Emissions in Henan Province, China
- PMID: 30135401
- PMCID: PMC6164170
- DOI: 10.3390/ijerph15091815
Evaluating the Coordination of Industrial-Economic Development Based on Anthropogenic Carbon Emissions in Henan Province, China
Abstract
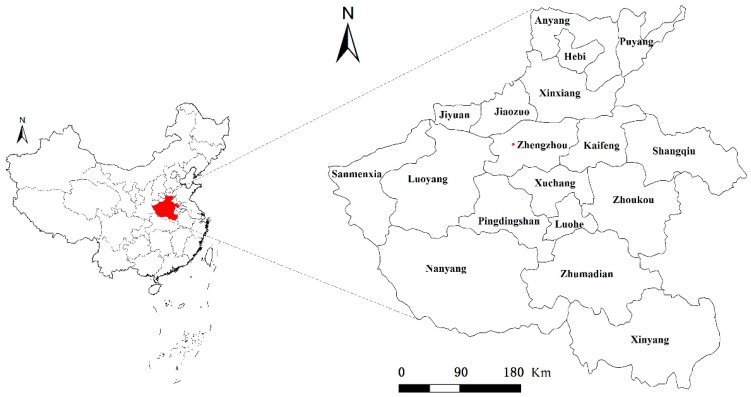
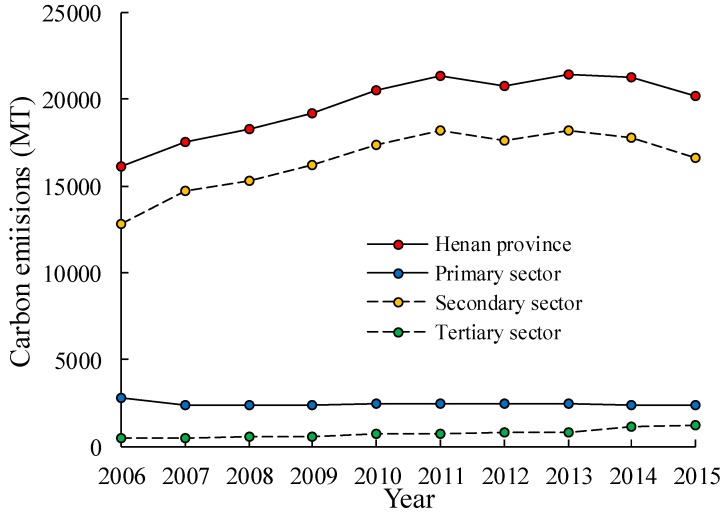
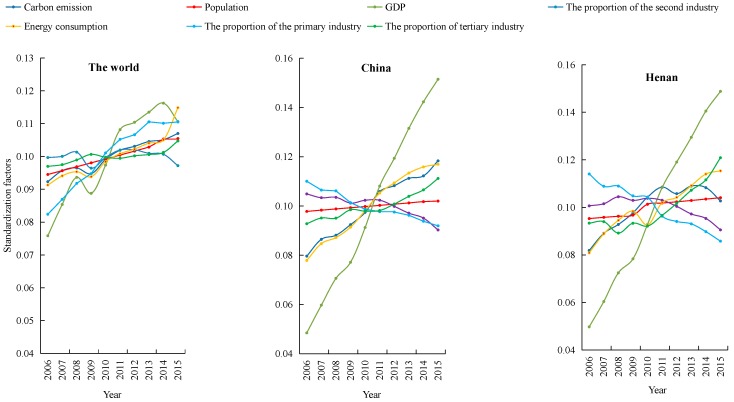
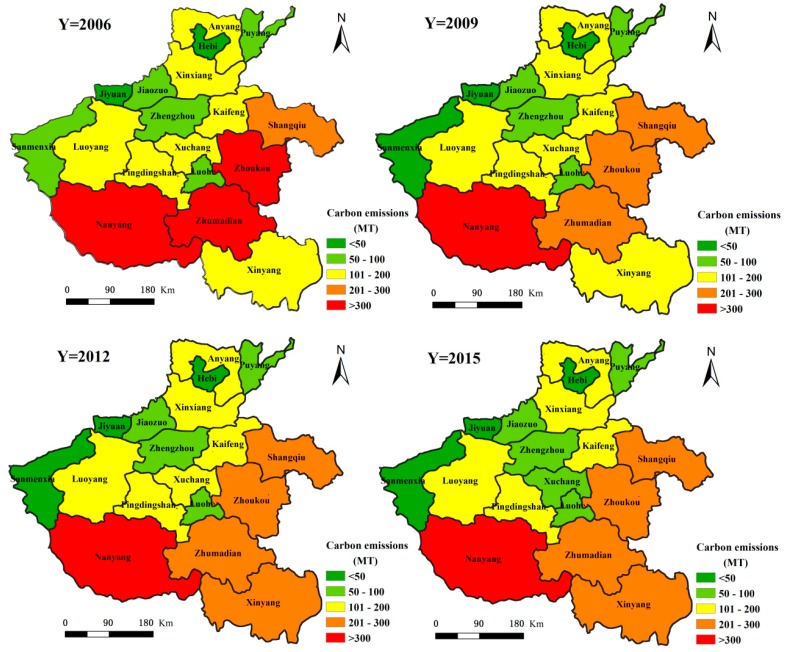
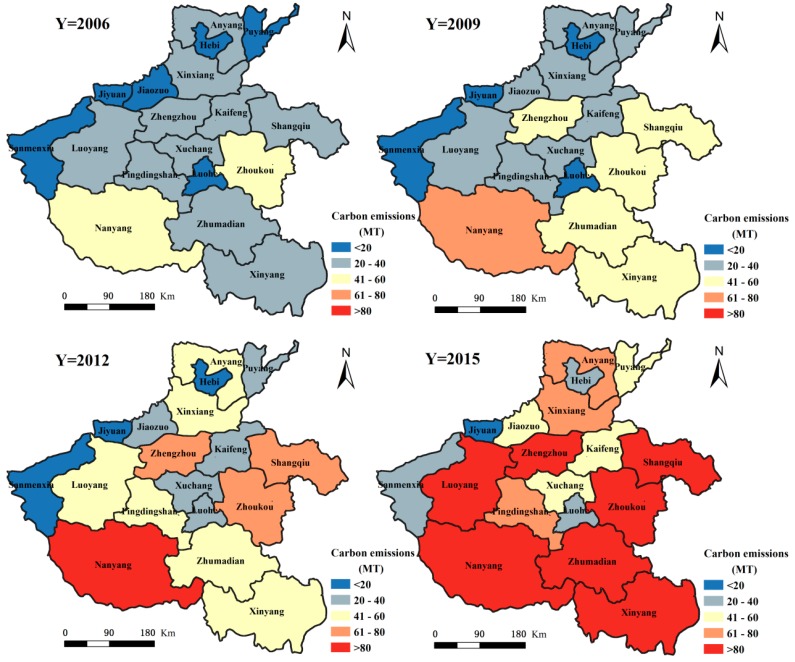
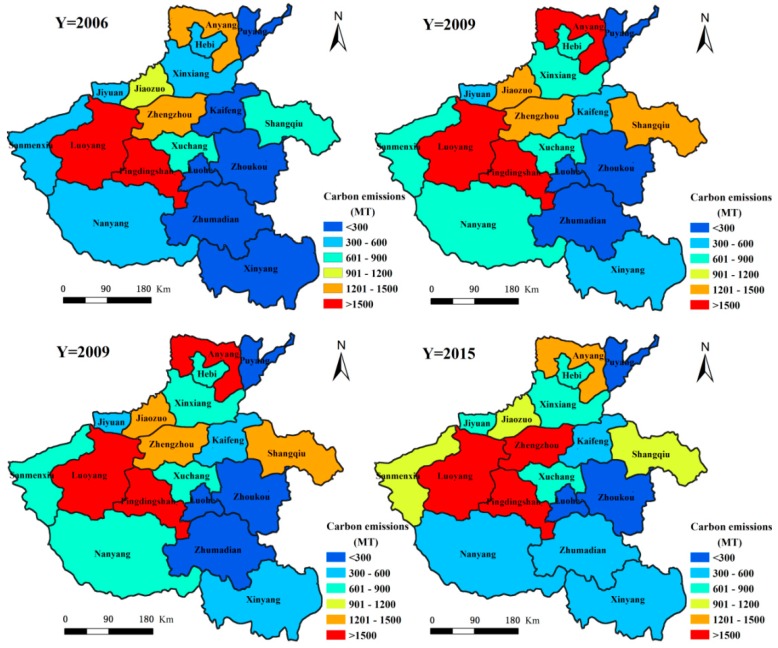
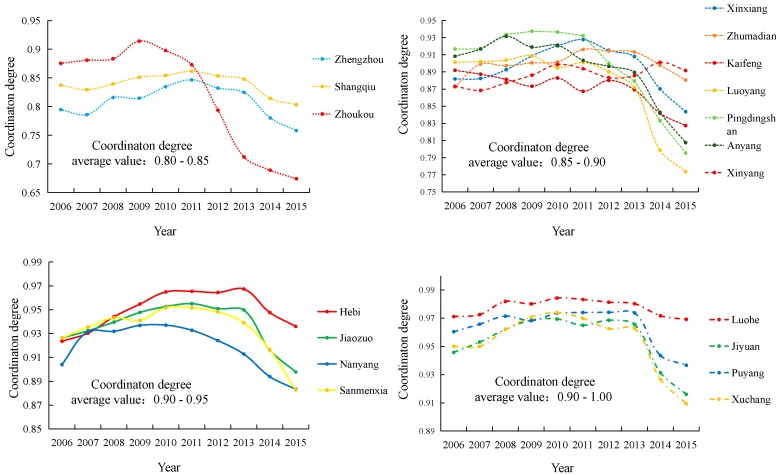
The mechanism of interaction between economic development, industrial structure and anthropogenic carbon emissions has become one of the focuses of climate change research. In this investigation, Henan Province was studied as an example, wherein the calculation model of carbon emissions in the primary, secondary and tertiary economic sectors was built using the ArcGIS 10.1 software. The spatiotemporal difference of carbon emissions between 2006 and 2015 from the three sectors was studied. The relation between economic development and environmental protection is discussed, based on the construction of a coordination degree model. Conclusions drawn from this analysis are: (1) In 2015, China's total carbon emissions reached 10,291.93 × 10⁷ t and Henan's carbon emissions accounted for 1.96% of China's total carbon emissions. The total carbon emissions in Henan Province increased more than 25.00% between 2006 and 2015. (2) Carbon emissions from different economic sectors demonstrated varied patterns. The primary sector presented a gradual decreasing trend in carbon emission, while the secondary sector showed a fluctuating pattern and the tertiary sector had an inclining trend in carbon emission. (3) There are also disparities in the spatial distribution of carbon emissions from different economic sectors. The primary and tertiary sectors had higher emissions in the southeast and lower emissions in the northwest regions, while the secondary sector showed higher emissions in the northwest and lower emissions in the southeast Between cities at different prefecture levels, differences do not only lie on the quantity of carbon emissions from the three sectors of economy but also a larger variation with regards to the change in quantity of carbon emissions. (4) The coordination degree of economic development was low among different prefecture-level cities. The economic and environmental development appeared coordinated among cities at the same prefecture level; however, coordination degrees among different prefecture-level cities varies significantly.
Keywords: Henan province; carbon emission; coordination degree index; spatiotemporal difference; three major economic sectors.
Conflict of interest statement
The authors declare no conflict of interest.
Figures
Similar articles
-
Spatiotemporal Dynamic Evolution and Its Driving Mechanism of Carbon Emissions in Hunan Province in the Last 20 Years.Int J Environ Res Public Health. 2023 Feb 9;20(4):3062. doi: 10.3390/ijerph20043062. Int J Environ Res Public Health. 2023. PMID: 36833754 Free PMC article.
-
Spatial Heterogeneity of Carbon Emissions and Its Influencing Factors in China: Evidence from 286 Prefecture-Level Cities.Int J Environ Res Public Health. 2022 Jan 22;19(3):1226. doi: 10.3390/ijerph19031226. Int J Environ Res Public Health. 2022. PMID: 35162249 Free PMC article.
-
Spatial Evolutionary Characteristics and Influencing Factors of Urban Industrial Carbon Emission in China.Int J Environ Res Public Health. 2022 Sep 7;19(18):11227. doi: 10.3390/ijerph191811227. Int J Environ Res Public Health. 2022. PMID: 36141499 Free PMC article.
-
Characterizing Carbon Emissions and the Associations with Socio-Economic Development in Chinese Cities.Int J Environ Res Public Health. 2022 Oct 23;19(21):13786. doi: 10.3390/ijerph192113786. Int J Environ Res Public Health. 2022. PMID: 36360669 Free PMC article.
-
Decomposition and decoupling analysis of multi-sector CO2 emissions based on LMDI and Tapio models: Case study of Henan Province, China.Environ Sci Pollut Res Int. 2023 Aug;30(38):88508-88523. doi: 10.1007/s11356-023-28609-3. Epub 2023 Jul 12. Environ Sci Pollut Res Int. 2023. PMID: 37438505
Cited by
-
Carbon Storage Change Analysis and Emission Reduction Suggestions under Land Use Transition: A Case Study of Henan Province, China.Int J Environ Res Public Health. 2021 Feb 14;18(4):1844. doi: 10.3390/ijerph18041844. Int J Environ Res Public Health. 2021. PMID: 33672829 Free PMC article.
-
Empirical Analysis of Carbon Emission Accounting and Influencing Factors of Energy Consumption in China.Int J Environ Res Public Health. 2018 Nov 5;15(11):2467. doi: 10.3390/ijerph15112467. Int J Environ Res Public Health. 2018. PMID: 30400644 Free PMC article.
-
An Optimal Pollution Control Model for Environmental Protection Cooperation between Developing and Developed Countries.Int J Environ Res Public Health. 2020 May 29;17(11):3868. doi: 10.3390/ijerph17113868. Int J Environ Res Public Health. 2020. PMID: 32485967 Free PMC article.
References
-
- IPCC . Third Assessment Report: Summary to Policymakers. Cambridge University Press (IPCC Secretariat); Cambridge, UK: 2001.
-
- Trenberth K.E., Dai A., Van D.S.G., Jones P.D., Barichivich J., Briffa K.R., Sheffield J. Global warming and changes in drought. Nat. Clim. Chang. 2014;4:17–22. doi: 10.1038/nclimate2067. - DOI
-
- Anis O. CO2 emissions, energy consumption and economic growth nexus in MENA countries: Evidence from simultaneous equations models. Energy Econ. 2013;40:657–664. doi: 10.1016/j.eneco.2013.09.003. - DOI
Publication types
MeSH terms
Substances
LinkOut - more resources
Full Text Sources
Other Literature Sources
