. 2018 Aug 22;9(1):3363.
doi: 10.1038/s41467-018-05058-y.

Genomic patterns of progression in smoldering multiple myeloma

Affiliations

Genomic patterns of progression in smoldering multiple myeloma

Niccolò Bolli et al. Nat Commun. .

Abstract

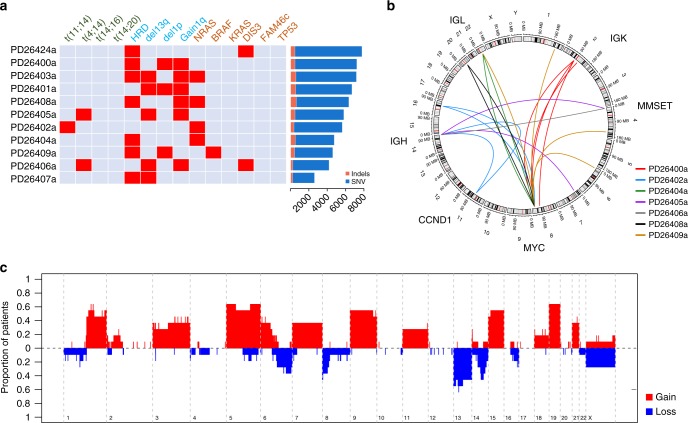
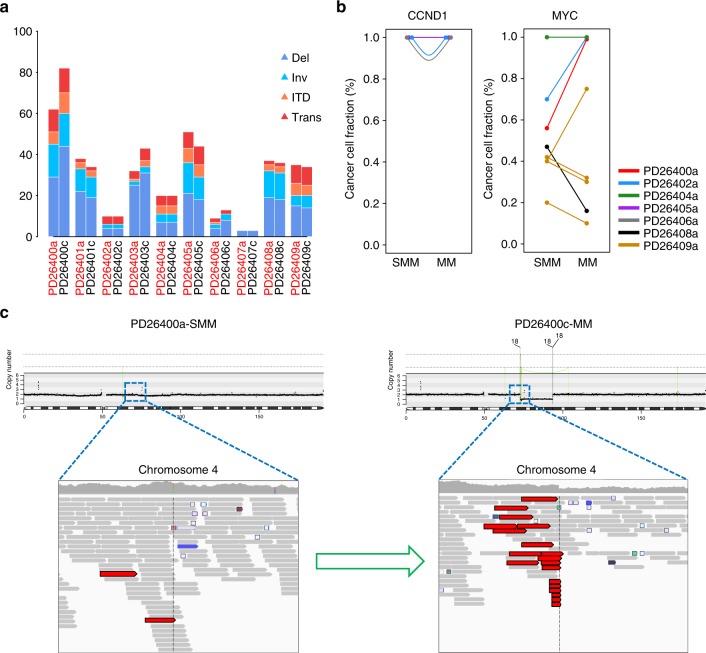
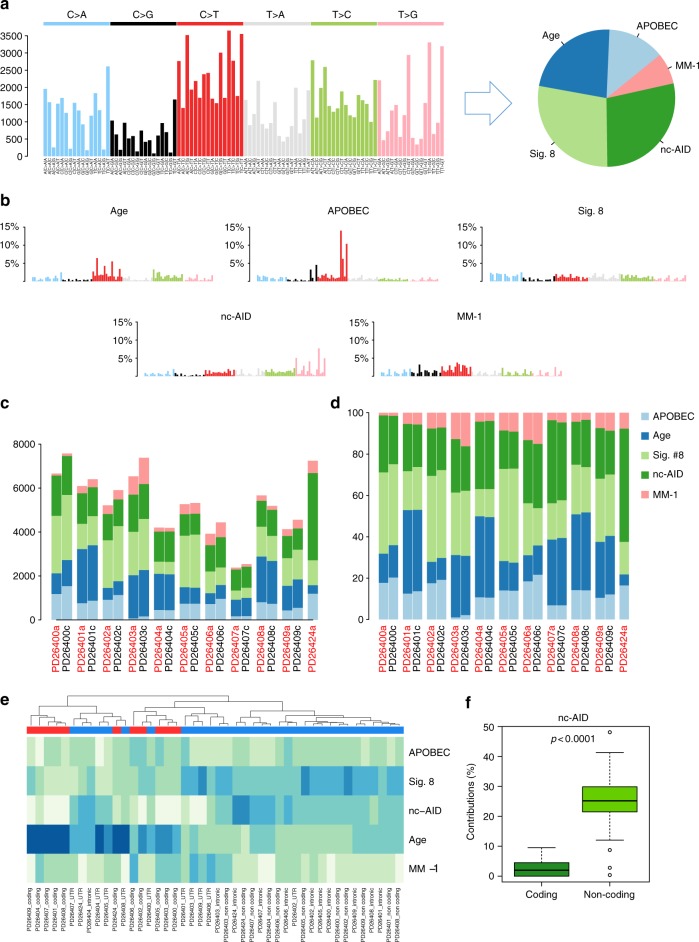
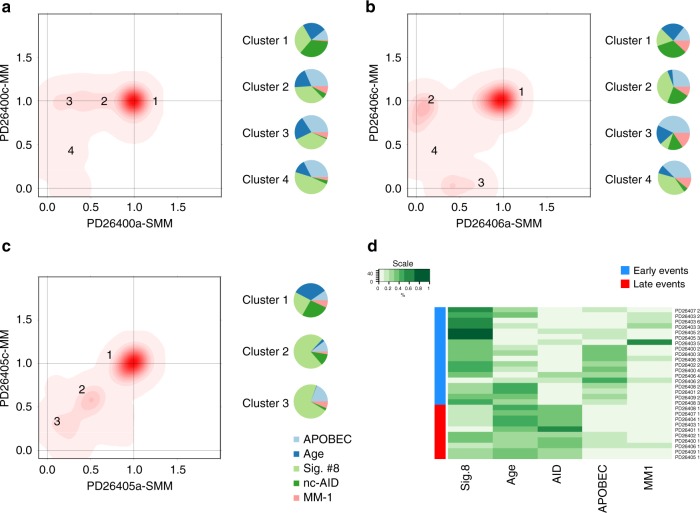
We analyzed whole genomes of unique paired samples from smoldering multiple myeloma (SMM) patients progressing to multiple myeloma (MM). We report that the genomic landscape, including mutational profile and structural rearrangements at the smoldering stage is very similar to MM. Paired sample analysis shows two different patterns of progression: a "static progression model", where the subclonal architecture is retained as the disease progressed to MM suggesting that progression solely reflects the time needed to accumulate a sufficient disease burden; and a "spontaneous evolution model", where a change in the subclonal composition is observed. We also observe that activation-induced cytidine deaminase plays a major role in shaping the mutational landscape of early subclinical phases, while progression is driven by APOBEC cytidine deaminases. These results provide a unique insight into myelomagenesis with potential implications for the definition of smoldering disease and timing of treatment initiation.


Conflict of interest statement

The authors declare no competing interests.

Figures

Fig. 1
Fig. 1
The genomic landscape of smoldering multiple myeloma. a Map representing the prevalence of known driver events among 11 smoldering MM patients. On the right the bar plot shows the number of somatic mutations (substitutions and indels) in each patient. b Circos plot representing the recurrent MM translocations in MM identified in this study (IGH and MYC genes). c Cumulative prevalence of clonal copy number changes
Fig. 2
Fig. 2
The genomic landscape of smoldering MM progression into symptomatic MM. a Comparison of substituion burden between SMM and MM, where dark blue represents shared mutations, and light blue mutations private to either sample. b Two-dimensional density plots showing the clustering of the fraction of tumor cells carrying each mutation at each time point; on x-axis and y-axis are plotted the SMM and MM phase, respectively. Increasing intensity of red indicates the location of a high-posterior probability of a cluster. In this case (PD26406), we have three main clusters, one was shared by 100% of cells both in SMM and MM; one was present only during the smoldering phase, and one appeared during progression. This is a typical example of spontaneous evolution model. c In this sample, no significant changes occurred in all main three clusters at progression. This is a typical example of the static progression model. d Time to progression of each case, where spontaneous evolution cases are in green, and static progression cases are in orange
Fig. 3
Fig. 3
Rearrangements prevalence and involvement in smoldering MM progression. a Bar plot representing the rearrangement prevalence in all smoldering (x-label in red) and symptomatic MM patients (x-label in black), broken down by rearrangement type. b IGH (left) and MYC (right) translocated cases are plotted by allelic fraction changes during progression. Each line is color-coded for each patient. Notably patient PD26409 (yellow) had four independent MYC rearrangements, but only one increased its clonality upon progression to MM. c An example of progression associated with evolution of the clonal fraction of a translocation with unknown driver potential
Fig. 4
Fig. 4
The landscape of mutational signatures involved in MM. a The 96-substitution class prevalence in all samples in the study from which NNMF extracted five main processes. b Representation of the five processes extracted by NNMF. c, d Barplots representing the absolute (c) and the relative (d) contribution of each mutational signature for each sample. e Hierarchical clustering based on the relative contribution of each mutational signature in each patient, according to the coding or noncoding status of each mutation. f Boxplot showing a strong association between nc-AID process and noncoding mutations. The p value was extracted by Wilcoxon test (wilcox.test R function). The whiskers are proportional to the interquartile range and are plotted with default parameters using the boxplot.stats R function
Fig. 5
Fig. 5
The prevalence, role and origin of localized hypermutation in MM. a Circos plot representing the distribution of all kataegis event among smoldering MM (blue dots) and symptomatic MM (orange dot). b Kataegis events were frequently found near rearrangements (black line representing the actual distance from the breakpoint). This association was higher than expected by chance (gray line). The rearrangements are broken down by type (blue line = inversion, red line = deletions, green line = ITD, and purple line = translocation). c The 96-mutational class histogram of the canonical AID signature extracted by NNMF on localized hypermutation events. d, e The absolute contribution of each involved mutational signature among all localized hypermutation regions within the IGH/IGK/IGL (d) and the non-IGH/IGK/IGL (e)
Fig. 6
Fig. 6
Mutational signature contribution during SMM progression. ac Three examples of different mutational signatures contribution during SMM progression. The nc-AID contribution was particularly enriched in cluster 1 (clonal events) of all patients. Conversely, its contribution was significantly decreased or virtually absent among all later events. This different chronological mutational signature activity was observed in all investigated cases, where all early clonal events were clustered together in a cluster enriched for nc-AID activity (d)

References

    1. Corre J, Munshi N, Avet-Loiseau H. Genetics of multiple myeloma: another heterogeneity level? Blood. 2015;125:1870–1876. doi: 10.1182/blood-2014-10-567370. - DOI - PMC - PubMed
    1. Manier, S. et al. Genomic complexity of multiple myeloma and its clinical implications. Nat. Rev. Clin. Oncol.14, 100–113 (2017). - PubMed
    1. Morgan GJ, Walker BA, Davies FE. The genetic architecture of multiple myeloma. Nat. Rev. Cancer. 2012;12:335–348. doi: 10.1038/nrc3257. - DOI - PubMed
    1. Rajkumar S. Smoldering multiple myeloma. Blood. 2015;125:3069–3075. doi: 10.1182/blood-2014-09-568899. - DOI - PMC - PubMed
    1. Rajkumar SV, et al. International Myeloma Working Group updated criteria for the diagnosis of multiple myeloma. Lancet Oncol. 2014;15:e538–e548. doi: 10.1016/S1470-2045(14)70442-5. - DOI - PubMed

Publication types