

Autophagy is required for proper meiosis of porcine oocytes maturing in vitro
- PMID: 30135500
- PMCID: PMC6105682
- DOI: 10.1038/s41598-018-29872-y
Autophagy is required for proper meiosis of porcine oocytes maturing in vitro
Abstract
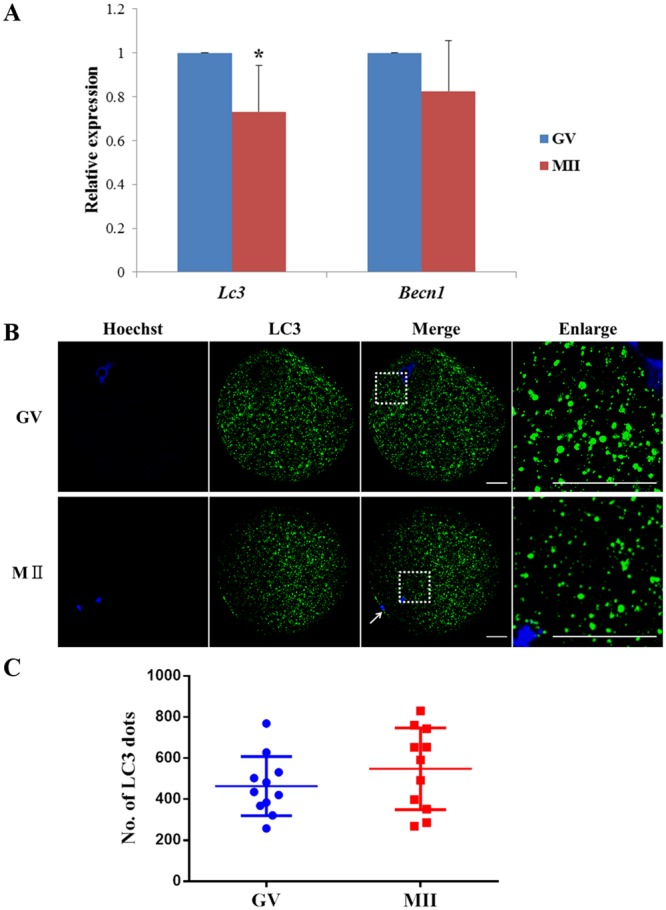
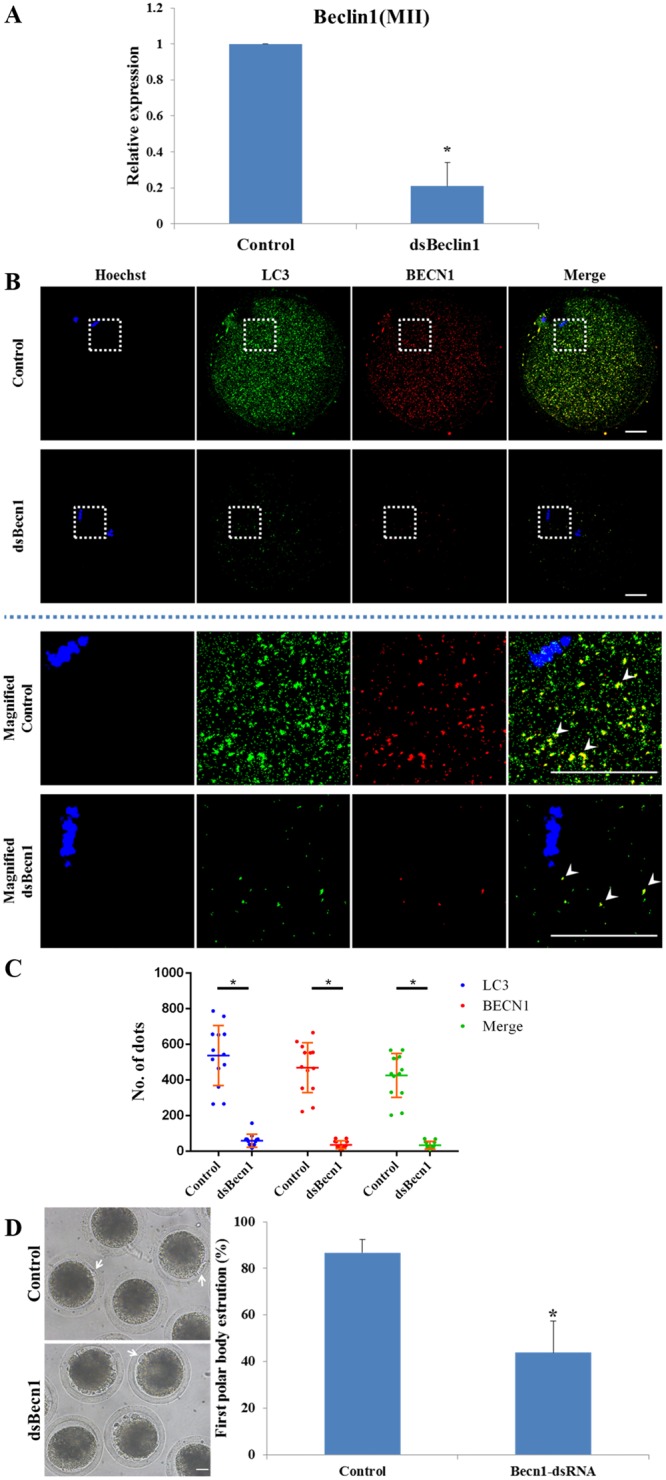
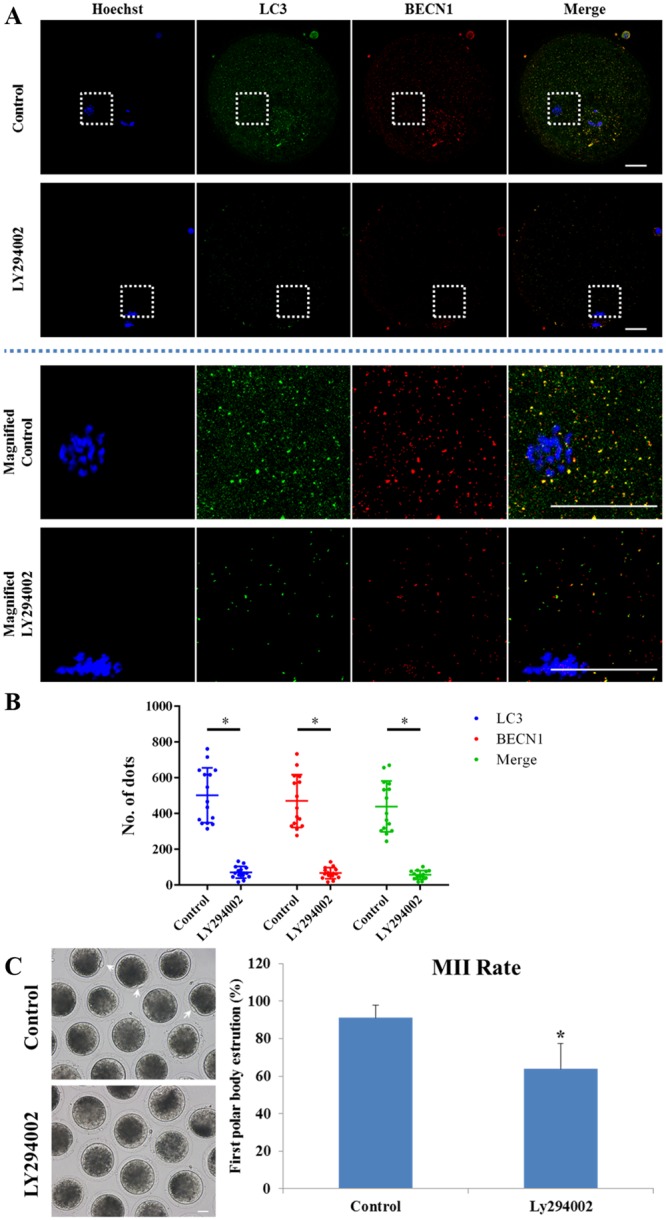
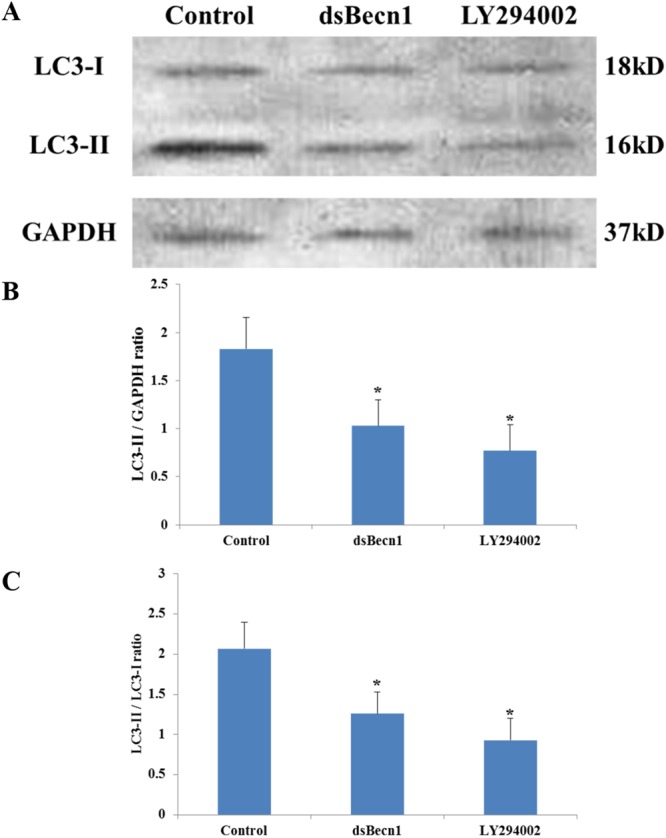
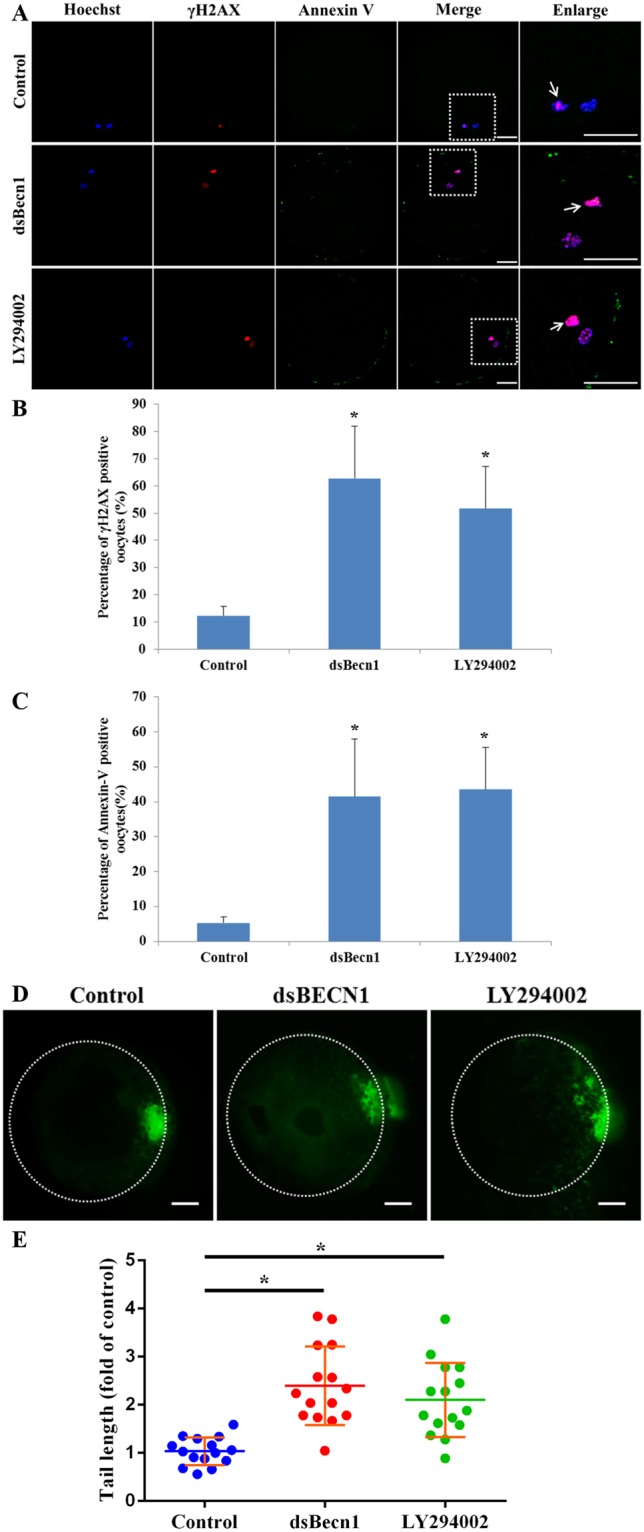
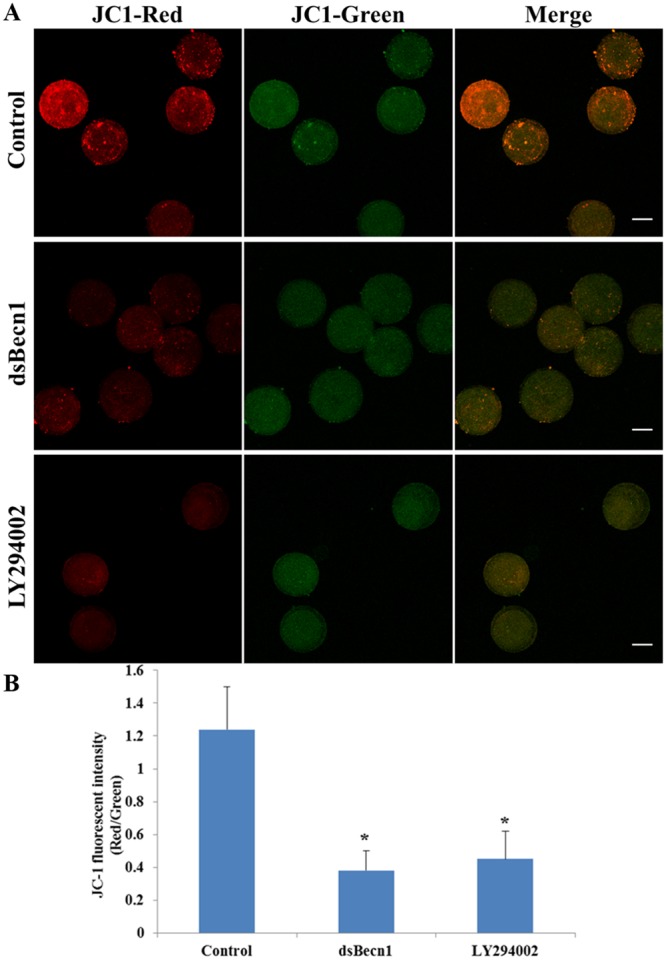
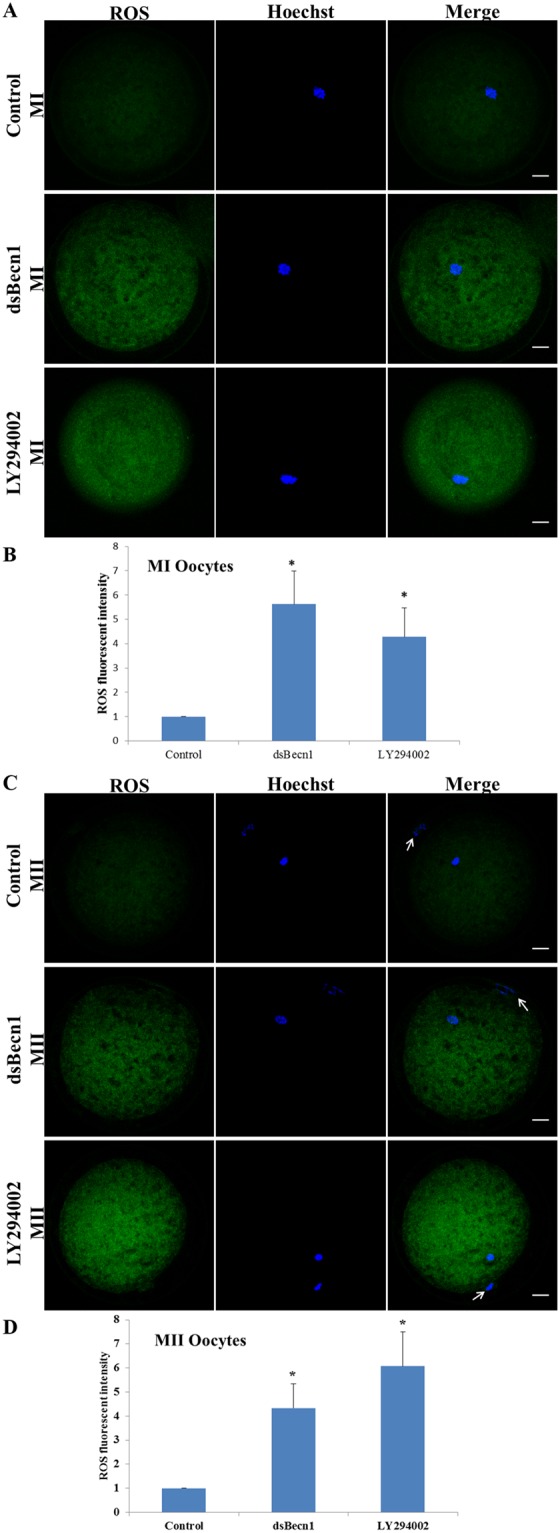
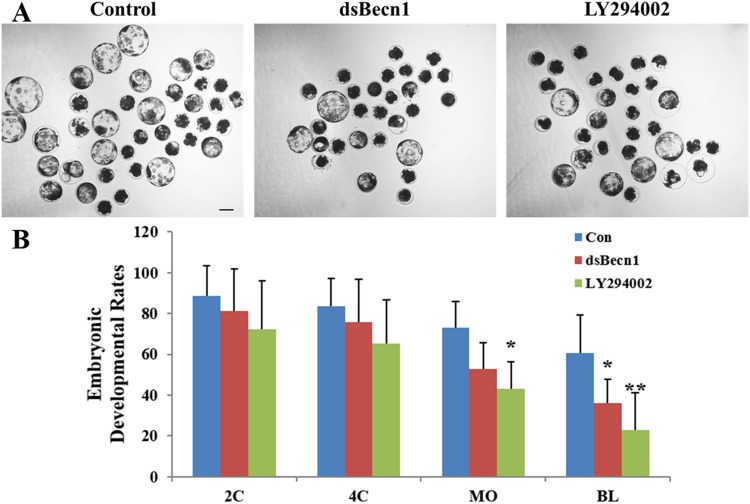
Autophagy is an essential cellular mechanism that degrades cytoplasmic proteins and organelles to recycle their components; however, the contribution of autophagy during meiosis has not been studied in porcine oocytes maturing in vitro. In this study, we observed that the autophagy-related gene, LC3, was expressed in porcine oocytes during maturation for 44 h in vitro. Knockdown of the autophagy-related gene, BECN1, reduced both BECN1 and LC3 protein expression levels. Moreover, BECN1 knockdown and treatment with the autophagy inhibitor, LY294002, during maturation of porcine oocytes in vitro impaired polar body extrusion, disturbed mitochondrial function, triggered the DNA damage response, and induced early apoptosis in porcine oocytes. Autophagy inhibition during oocyte maturation also impaired the further developmental potential of porcine oocytes. These results indicate that autophagy is required for the in vitro maturation of porcine oocytes.
Conflict of interest statement
The authors declare no competing interests.
Figures
Similar articles
-
Sodium fluoride exposure exerts toxic effects on porcine oocyte maturation.Sci Rep. 2017 Dec 6;7(1):17082. doi: 10.1038/s41598-017-17357-3. Sci Rep. 2017. PMID: 29213094 Free PMC article.
-
Lysosomal dysfunction disturbs porcine oocyte maturation and developmental capacity by disorganizing chromosome/cytoskeleton and activating autophagy/apoptosis.Theriogenology. 2019 Dec;140:44-51. doi: 10.1016/j.theriogenology.2019.08.019. Epub 2019 Aug 13. Theriogenology. 2019. PMID: 31437668
-
17β-estradiol improves the developmental ability, inhibits reactive oxygen species levels and apoptosis of porcine oocytes by regulating autophagy events.J Steroid Biochem Mol Biol. 2021 May;209:105826. doi: 10.1016/j.jsbmb.2021.105826. Epub 2021 Feb 10. J Steroid Biochem Mol Biol. 2021. PMID: 33581253
-
Bovine oocyte meiotic inhibition before in vitro maturation and its value to in vitro embryo production: does it improve developmental competence?Reprod Domest Anim. 2012 Aug;47(4):687-93. doi: 10.1111/j.1439-0531.2011.01924.x. Epub 2011 Oct 12. Reprod Domest Anim. 2012. PMID: 21988654 Review.
-
A comparative analysis of metabolism and viability in porcine oocytes during in vitro maturation.Anim Reprod Sci. 2007 Mar;98(1-2):72-96. doi: 10.1016/j.anireprosci.2006.10.006. Epub 2006 Oct 13. Anim Reprod Sci. 2007. PMID: 17110061 Review.
Cited by
-
A polysaccharide gel made of gellan gum improves oocyte maturation and embryonic development in pigs.J Reprod Dev. 2024 Oct 1;70(5):303-308. doi: 10.1262/jrd.2024-017. Epub 2024 Jul 13. J Reprod Dev. 2024. PMID: 39010241 Free PMC article.
-
Autophagy is a pro-survival adaptive response to heat shock in bovine cumulus-oocyte complexes.Sci Rep. 2020 Aug 13;10(1):13711. doi: 10.1038/s41598-020-69939-3. Sci Rep. 2020. PMID: 32792582 Free PMC article.
-
The Impact of Aging on Macroautophagy in the Pre-ovulatory Mouse Oocyte.Front Cell Dev Biol. 2021 Jun 29;9:691826. doi: 10.3389/fcell.2021.691826. eCollection 2021. Front Cell Dev Biol. 2021. PMID: 34268312 Free PMC article.
-
IGF2 improves the developmental competency and meiotic structure of oocytes from aged mice.Aging (Albany NY). 2020 Dec 9;13(2):2118-2134. doi: 10.18632/aging.202214. Epub 2020 Dec 9. Aging (Albany NY). 2020. PMID: 33318299 Free PMC article.
-
The autophagic inducer and inhibitor display different activities on the meiotic and developmental competencies of porcine oocytes derived from small and medium follicles.J Reprod Dev. 2019 Dec 18;65(6):527-532. doi: 10.1262/jrd.2019-112. Epub 2019 Nov 3. J Reprod Dev. 2019. PMID: 31685760 Free PMC article.
References
Publication types
MeSH terms
Substances
LinkOut - more resources
Full Text Sources
Other Literature Sources
