. 2018 Aug 22;8(1):12544.
doi: 10.1038/s41598-018-30492-9.

Ndr kinases regulate retinal interneuron proliferation and homeostasis

Affiliations

Ndr kinases regulate retinal interneuron proliferation and homeostasis

Hélène Léger et al. Sci Rep. .

Abstract

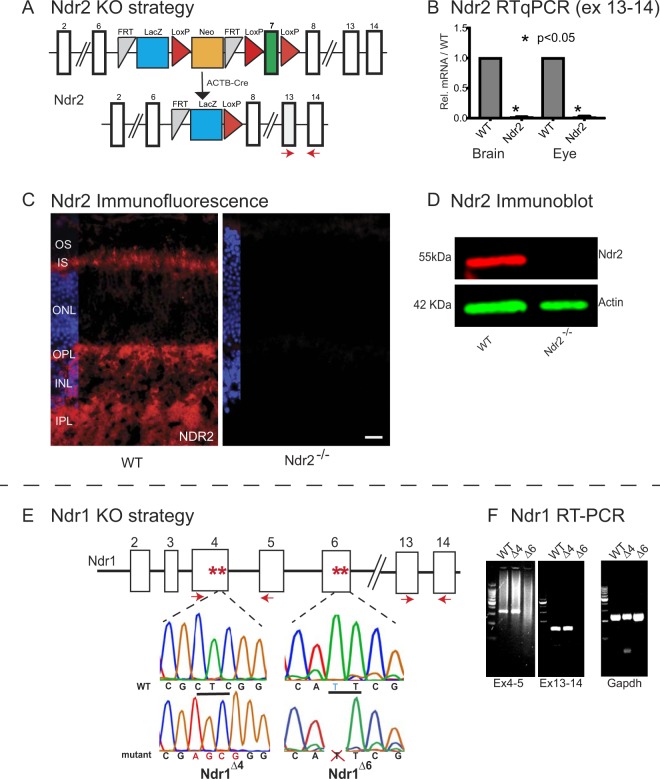
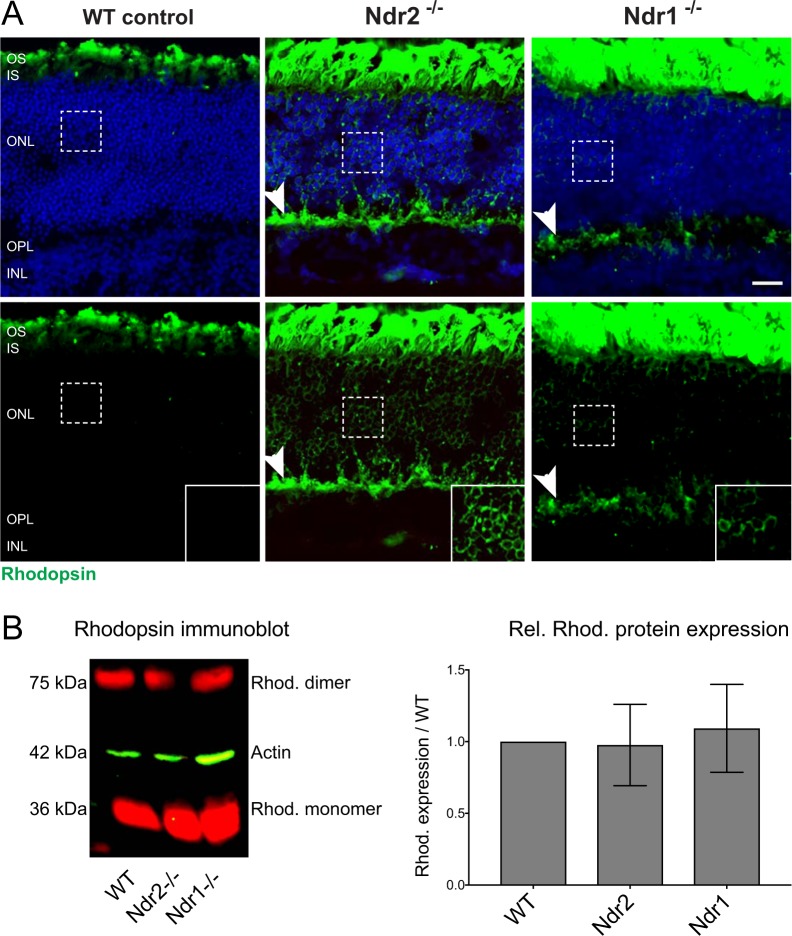
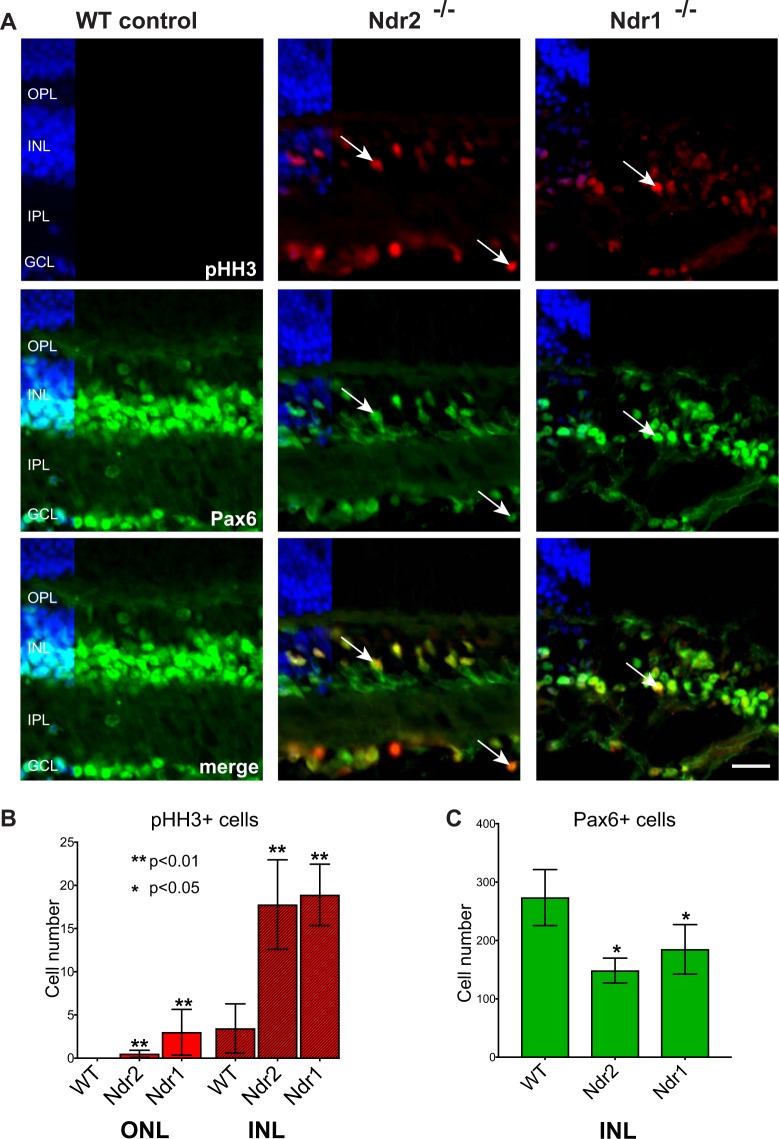
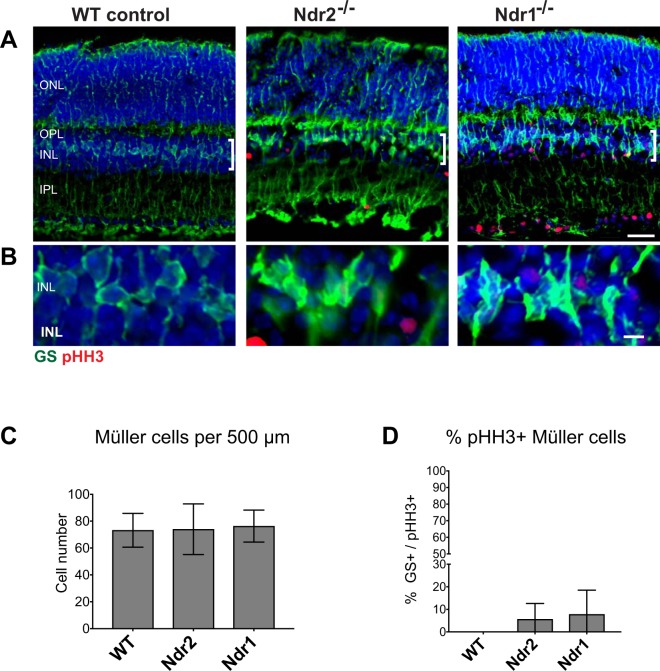
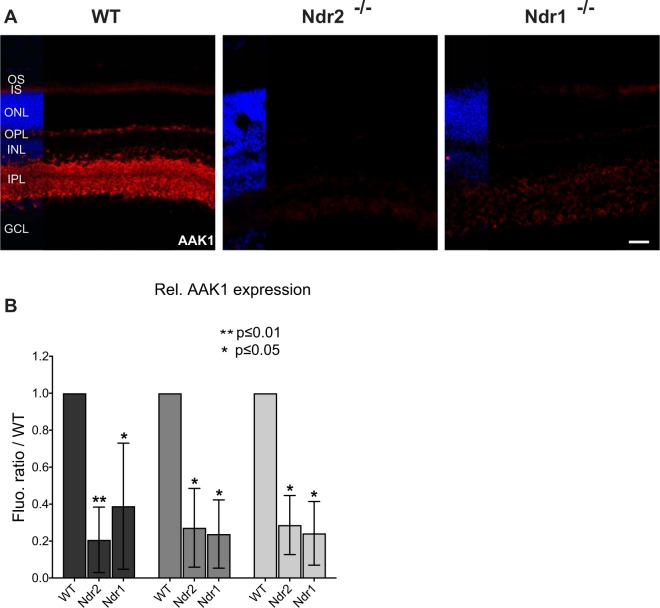
Ndr2/Stk38l encodes a protein kinase associated with the Hippo tumor suppressor pathway and is mutated in a naturally-occurring canine early retinal degeneration (erd). To elucidate the retinal functions of Ndr2 and its paralog Ndr1/Stk38, we generated Ndr1 and Ndr2 single knockout mice. Although retinal lamination appeared normal in these mice, Ndr deletion caused a subset of Pax6-positive amacrine cells to proliferate in differentiated retinas, while concurrently decreasing the number of GABAergic, HuD and Pax6-positive amacrine cells. Retinal transcriptome analyses revealed that Ndr2 deletion increased expression of neuronal stress genes and decreased expression of synaptic organization genes. Consistent with the latter, Ndr deletion dramatically reduced levels of Aak1, an Ndr substrate that regulates vesicle trafficking. Our findings indicate that Ndr kinases are important regulators of amacrine and photoreceptor cells and suggest that Ndr kinases inhibit the proliferation of a subset of terminally differentiated cells and modulate interneuron synapse function via Aak1.


Conflict of interest statement

The authors declare no competing interests.

Figures

Figure 1
Figure 1
Mouse Ndr1 and Ndr2 knockout strategy and confirmation. (A) The conditional-ready Ndr2/Stk38l deletion allele obtained from KOMP. Ndr2/Stk38l exon 7 (green box) is flanked by LoxP sites (red triangles) and excised by the cre recombinase under control of the actinB promoter to produce Ndr2 KO mice. LacZ is indicated by the blue box, Neo cassette is indicated by the orange box. RT-qPCR primers for Exons 13–14 are indicated by red arrows. (B) RT-qPCR data confirms Ndr2 deletion. cDNA was isolated from brain and eye tissue from P28 wild type (WT) and Ndr2 KO mice. Data are from 4 sets of RT-qPCRs, targeting exons 13 to 14, with each sample run in duplicate (p < 0.05, calculated by one-sample test). (C) Ndr2 immunofluorescence was performed on P28 WT and Ndr2 KO retinas. Nuclei were labeled with Hoechst 33342. IPL, inner plexiform layer; INL, inner nuclear layer; OPL, outer plexiform layer; ONL, outer nuclear layer; IS, inner segments; OS, outer segments. Scale bar = 20 μm. (D) Immunoblot of eye protein extracts probed with anti-Ndr2 and anti-actin antibodies. Uncropped images of this immunoblot are presented in Suppl. Fig. S1. (E) Two independent Ndr1/Stk38 alleles (Ndr1∆4, Ndr1∆6) were generated by distinct CRISPR-cas9 procedures and confirmed by DNA sequencing. The chromatograms of WT and Ndr1 KO alleles are presented. The Ndr1∆4 allele contains a mutation in Ndr1 exon 4, in which CTC (underlined) is replaced by AGCG (red) to yield a frame shift mutation. The Ndr1∆6 allele contains a single base deletion in exon 6 (blue T in WT chromatogram) to yield a frame shift mutation. Red asterisks represent stop codons introduced by indels. (F) RT-PCR reveal the presence of Ndr1 transcript containing exons 4–5 and exons 13–14 in retina cDNA from Ndr1∆4 and WT mice. There is no detectable Ndr1 transcript in Ndr1∆6 mice. GAPDH RT-PCR data serve as positive controls.
Figure 2
Figure 2
Retinal histology in adult Ndr KO mice. (A) Photomicrographs of H&E stained paraffin sections of retinas from P28 WT, Ndr2 KO, and Ndr1 KO mice (3 months postnatal). Scale bar, 25 μm. (B) Relative ONL and INL thickness of central and peripheral retina. The number of nuclei was counted manually in 10 vertical rows per section (see vertical black line), three sections per animal, n = 4 mice per genotype. Ndr1 KO data were obtained from 2 Ndr1∆4 KO and 2 Ndr1∆6 KO mice. Means ± SD and levels of significance were calculated using an unequal variance t-test.
Figure 3
Figure 3
Rod opsin mislocalization in Ndr KO mouse retinas. (A) Rhodopsin immunofluorescence (green) in retinal sections from P28 WT, Ndr2 KO and Ndr1 KO mice. Insets show aberrant perinuclear rhodopsin localization on Ndr KO retinas. Arrowhead points to aberrant opsin localization in the OPL. Nuclei labeled with Hoechst 33342 (blue). Scale bar, 20 μM. (B) Quantitative rhodopsin immunoblot shows similar levels of rhodopsin monomer and dimers and in WT, Ndr2 and Ndr1 KO mice neuronal retinal extracts. Relative levels of rhodopsin monomer and dimer from 4 independent experiments were normalized to actin and plotted against WT neuronal retinal extracts. Levels of significance were calculated using a one-way ANOVA test with p < 0.05.
Figure 4
Figure 4
Ndr1 and Ndr2 deletion promote retinal cell death. (A) Retinas from P28 WT, Ndr2 and Ndr1 KO mice were labeled with TUNEL (green). Nuclei labeled with Hoechst 33342 (blue). Insets (dashed boxes) are shown in Suppl. Fig. S2A. (B) Active caspase-3 (red) and Pax6 (green) immunofluorescence in WT, Ndr2 and Ndr1 KO retinas. Arrows show representative caspase 3-positive and Pax6-positive cells. Scale bars for (A and B) 20 μm. (C) Active caspase-3 (red) and syntaxin (green) in WT, Ndr2 and Ndr1 KO retinas. Images in C were acquired by confocal microscopy and visualized as single optical sections. Scale bar, 5 μm. (D) The number of TUNEL-positive nuclei were counted manually in 500 μm long region of interest (ROI) and plotted; n ≥ 3 mice per genotype. (E) The number of active caspase-3 positive nuclei were counted manually in 500 μm ROIs and plotted; n ≥ 2 mice per genotype. Error bars represent SD and asterisks indicate levels of significance using an unequal variance t-test (p < 0.05).
Figure 5
Figure 5
Ndr deletion promotes INL cell proliferation in differentiated mouse retina. (A) The presence of mitotic cells in P28 mouse retinas were examined in WT, Ndr2 KO and Ndr1 KO by phospho-histone H3 (pHH3) immunofluorescence (red). Pax6-positive cells (green) were simultaneously probed. Nuclei labeled with Hoechst 33342 (blue). Scale bar, 40 μm. (B) The number pHH3-positive nuclei and (C) Pax6-positive were quantified along 500 μm long regions of INL in ≥ 2 retinal sections per animal (n ≥ 3 animals per genotype). Error bars represent SD and asterisks indicate levels of significance using a one-way ANOVA test (p < 0.05).
Figure 6
Figure 6
Ndr deletion disrupts amacrine cell homeostasis in adult mouse retina. (A) Immunofluorescence microscopy of the mitotic marker pHH3 (green) and calretinin (red) in P28 WT and Ndr KO mouse retinas. Arrows point to representative pHH3 and calretinin-positive nuclei. Scale bar, 20 μm. (B) Confocal immunofluorescence microscopy of pHH3 (red) and the pan-amacrine protein syntaxin 1 (green) in the basal INL of P28 WT and Ndr KO mice. Arrows point to pHH3-positive cell with perinuclear syntaxin 1. Images were acquired by confocal microscopy and visualized as merged z-sections. Nuclei labeled with Hoechst 33342 (blue). Scale bar, 5 μM. (C) pHH3 (red) and HuD (green) immunofluorescence. (D) GAD65 (red) immunofluorescence. Scale bar, 40 μm. (E) The percentage of Pax6-positive, calretinin-positive syntaxin positive and HuD-positive mitotic (pHH3) cells from 500 μm long ROIs were quantified and plotted. (F) Relative GAD65 immunofluorescence within the INL of Ndr KO retinas was quantified and plotted as ratios to WT by counting the number of pixels within five 100 μm long ROIs per retinal section (n = 3 mice per genotype). SD and statistical significance were determined by unequal variance t-test (p < 0.05).
Figure 7
Figure 7
Ndr deletion does not significantly affect Müller cell distribution or proliferation. (A) Retinal sections from P28 WT, Ndr2 and Ndr1 KO were probed with antibodies to pHH3 (red) and the Müller cell marker glutamine synthetase (GS) (green). Scale bar, 20 μm. Brackets denote locations of Müller cell bodies (B). Representative images of GS-positive Müller cell bodies. (C) GS-positive cell bodies were quantified and plotted. (D) The percentage of GS-positive mitotic (pHH3-positive) cells from 500 μm long ROIs were plotted. Data were quantified from 500 μm long INL regions in ≥2 retinal sections per animal (n ≥ 3 animals per genotype). SD and levels of significance were determined using one-way ANOVA test (p < 0.05).
Figure 8
Figure 8
Differential gene expression in Ndr2 KO mouse retinas identified by RNA sequencing. (A) Heat map showing log2 values of mRNA expression in WT and Ndr2 KO retinas by RNA sequencing. 150 upregulated (top) and 190 downregulated (down) genes were identified in Ndr2 KO retinas after setting a threshold to log2 ≥1. (B) Gene ontology enrichment for up and down regulated genes in Ndr2 KO retina is shown for molecular function and biological process gene ontologies (p < 0.05, (FC ≥ I2I). Levels of significance were determined using a Fisher test with Bonferroni correction. (C) RNA seq data validation by RT-qPCR. Expression of select upregulated and down-regulated genes from the comparative RNA-seq experiments was measured by real-time quantitative PCR relative to GAPDH in mouse retina. Histograms represent the log2 fold expression calculated as 2−ΔΔCt between Ndr2 KO and WT (log2FC ≥ I1I). Means ± SD were determined from a minimum of 2 sets of RT-qPCR experiments with each sample run in duplicate. P values were calculated by one-sample t test (p < 0.05).
Figure 9
Figure 9
Ndr deletion disrupts Aak1 kinase expression. (A) Aak1 immunofluorescence (red) in retinal sections of P28 WT, Ndr2 and Ndr1 KO mice. DNA staining is shown in blue. Scale bar, 40 μm. (B) Relative AAK1 immunofluorescence levels were quantified by counting the number of pixels in five ROIs per retinal section (n = 3 mice per genotype). SD and levels of significance were determined by two-way ANOVA test (p < 0.01).

Similar articles

Cited by

References

    1. Agathocleous M, Harris WA. From progenitors to differentiated cells in the vertebrate retina. Annual review of cell and developmental biology. 2009;25:45–69. doi: 10.1146/annurev.cellbio.042308.113259. - DOI - PubMed
    1. Swaroop A, Kim D, Forrest D. Transcriptional regulation of photoreceptor development and homeostasis in the mammalian retina. Nat Rev Neurosci. 2010;11:563–576. doi: 10.1038/nrn2880. - DOI - PMC - PubMed
    1. Fan WJ, et al. Neural differentiation and synaptogenesis in retinal development. Neural regeneration research. 2016;11:312–318. doi: 10.4103/1673-5374.177743. - DOI - PMC - PubMed
    1. Baehr W, Frederick JM. Naturally occurring animal models with outer retina phenotypes. Vision research. 2009;49:2636–2652. doi: 10.1016/j.visres.2009.04.008. - DOI - PMC - PubMed
    1. Hartong DT, Berson EL, Dryja TP. Retinitis pigmentosa. Lancet. 2006;368:1795–1809. doi: 10.1016/S0140-6736(06)69740-7. - DOI - PubMed

Publication types

LinkOut - more resources