. 2018 Aug 22;9(1):3362.
doi: 10.1038/s41467-018-05871-5.

Experience-dependent structural plasticity targets dynamic filopodia in regulating dendrite maturation and synaptogenesis

Affiliations

Experience-dependent structural plasticity targets dynamic filopodia in regulating dendrite maturation and synaptogenesis

Chengyu Sheng et al. Nat Commun. .

Abstract

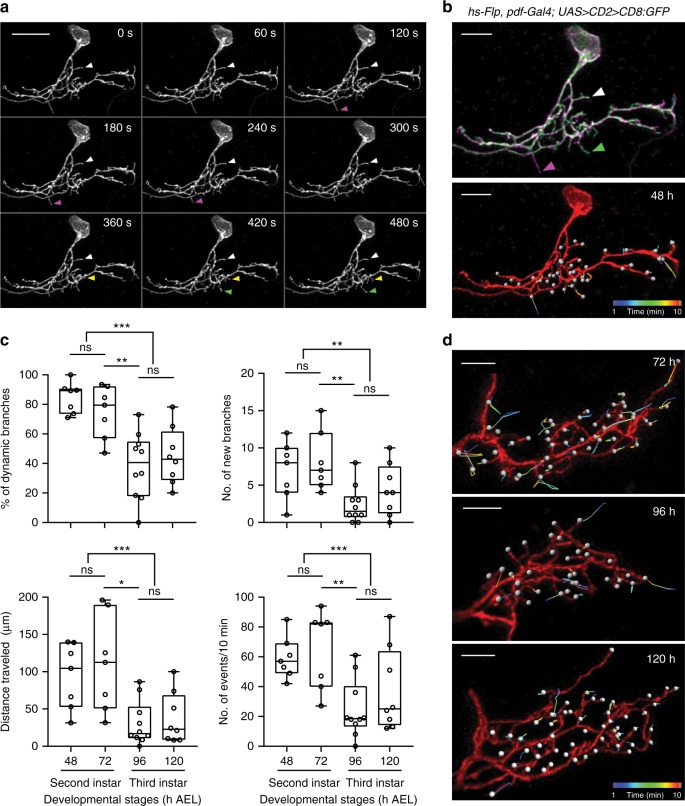
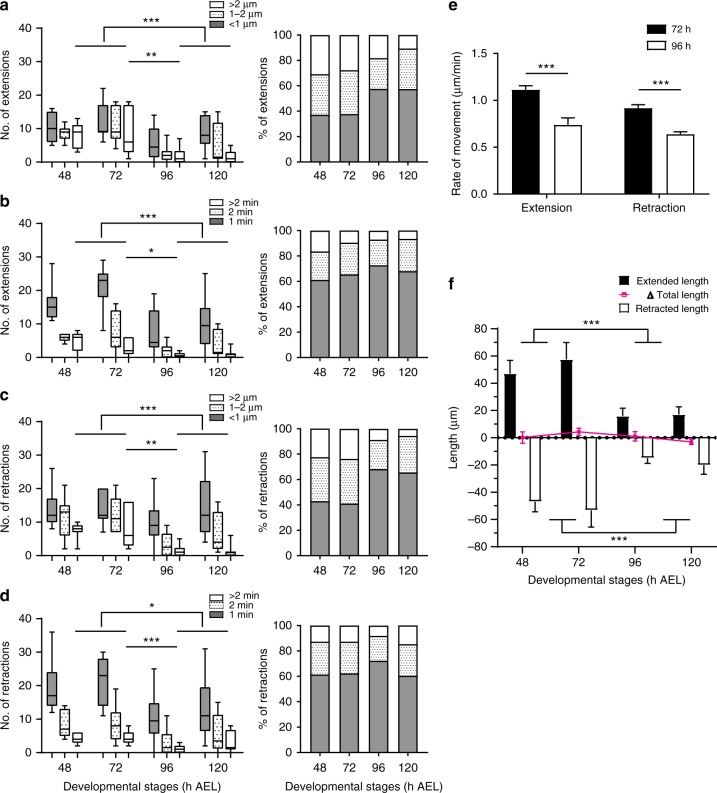
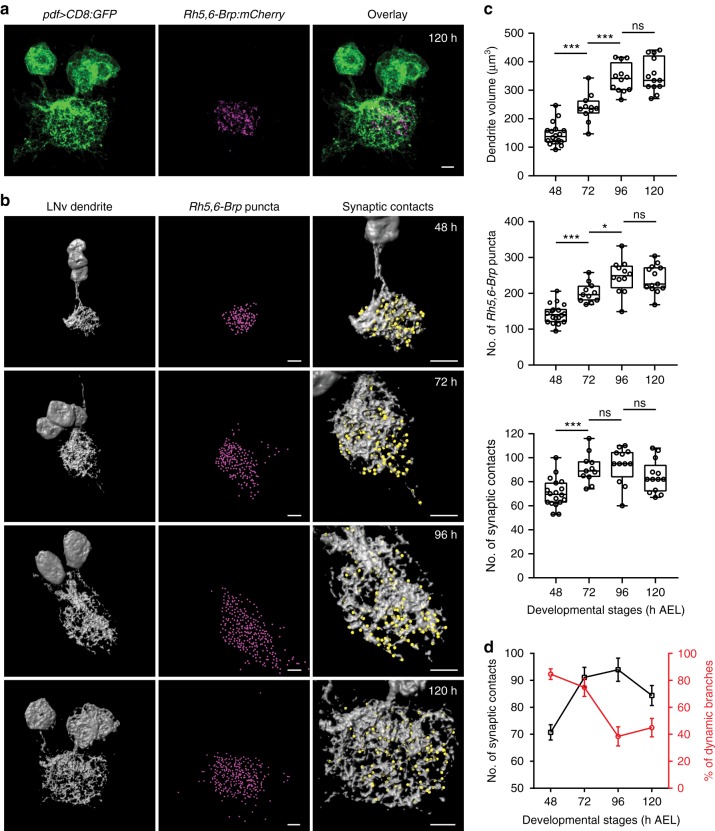
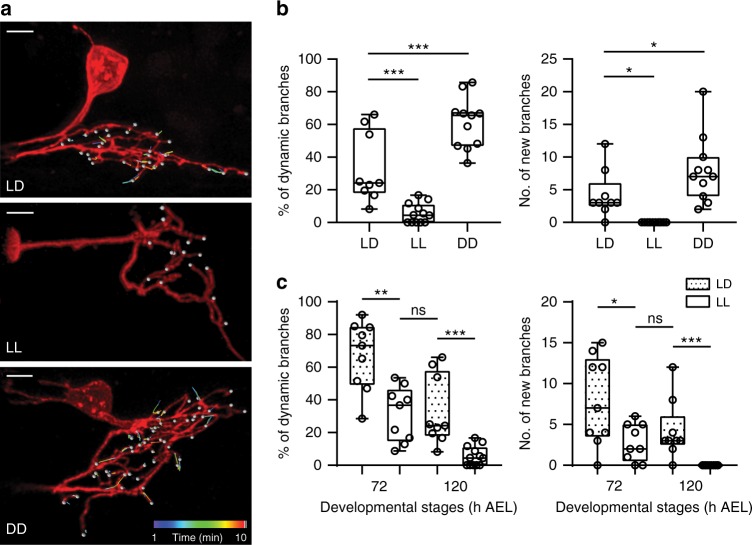
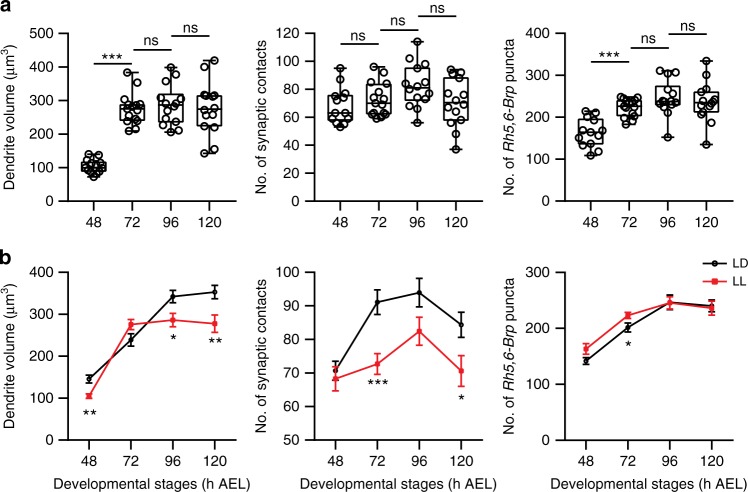
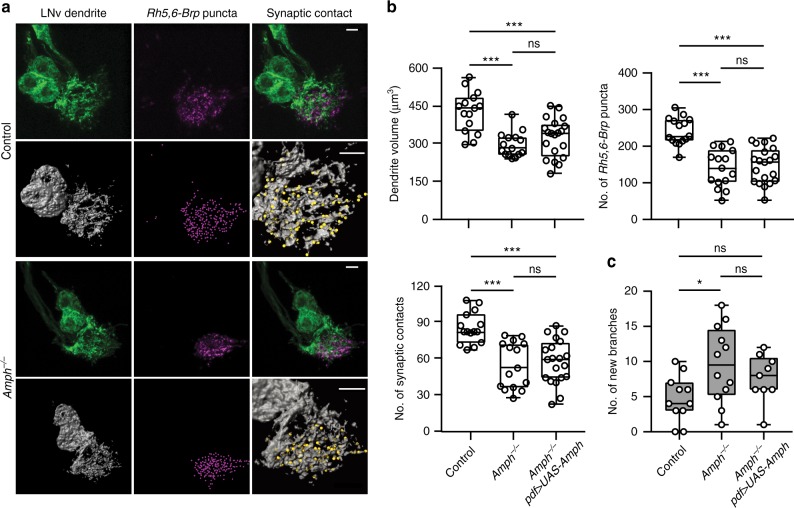
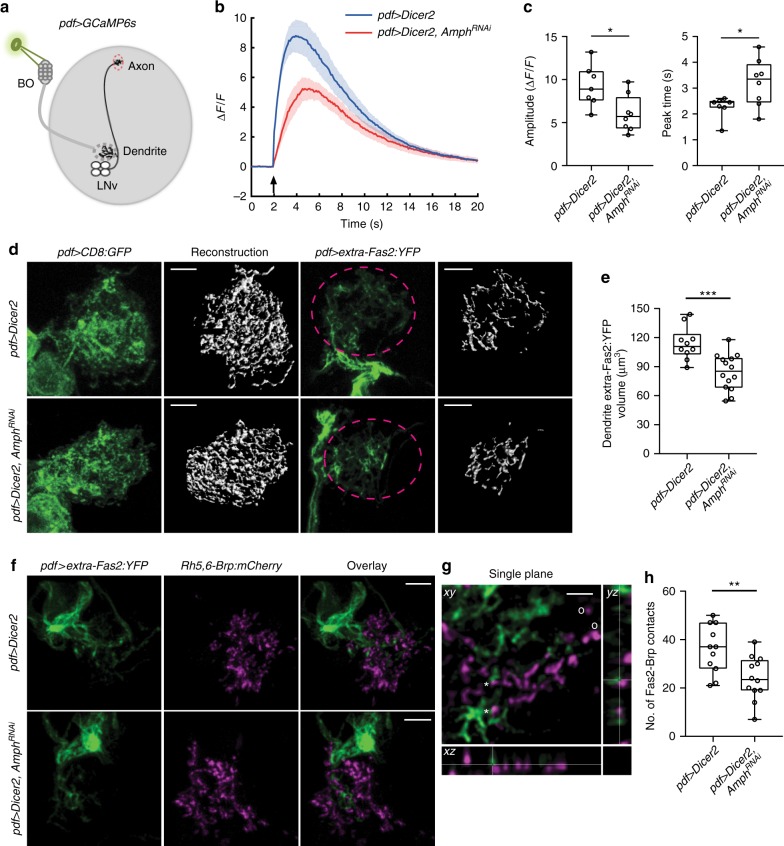
Highly motile dendritic protrusions are hallmarks of developing neurons. These exploratory filopodia sample the environment and initiate contacts with potential synaptic partners. To understand the role for dynamic filopodia in dendrite morphogenesis and experience-dependent structural plasticity, we analyzed dendrite dynamics, synapse formation, and dendrite volume expansion in developing ventral lateral neurons (LNvs) of the Drosophila larval visual circuit. Our findings reveal the temporal coordination between heightened dendrite dynamics with synaptogenesis in LNvs and illustrate the strong influence imposed by sensory experience on the prevalence of dendritic filopodia, which regulate the formation of synapses and the expansion of dendritic arbors. Using genetic analyses, we further identified Amphiphysin (Amph), a BAR (Bin/Amphiphysin/Rvs) domain-containing protein as a required component for tuning the dynamic state of LNv dendrites and promoting dendrite maturation. Taken together, our study establishes dynamic filopodia as the key cellular target for experience-dependent regulation of dendrite development.


Conflict of interest statement

The authors declare no competing interests.

Figures

Fig. 1
Fig. 1
Time-lapse 3D imaging of dynamic filopodia on developing LNv dendrites. a Examples of extension (green), retraction (magenta), newly appeared (yellow), and stable (white) branches on the dendritic arbor of a single-labeled LNv. Scale bar, 10 μm. A representative Z-projected time series is shown. b 4D tracing of branch tips provides accurate representations of dynamic events on the entire dendritic arbor. Top: Overlay of the first (magenta) and last frame (green) of the Z-projected time series. Bottom: The 3D rendering image of tracking trajectories generated by movements of dynamic filopodia. Branch tips are marked by white spots. c Decreased dendrite dynamics in mature neurons (3rd instar, 96 and 120 h) as compared to young neurons (2nd instar, 48 and 72 h). Transitions from dynamic to stable state occur between 72 to 96 h AEL. Data are presented as box plot (box, 25–75%; center line, median) overlaid with dot plot (individual data points). n = 7, 7, 10, and 8 for 48, 72, 96, and 120 h, respectively. Statistical significance was assessed by one-way ANOVA with Tukey’s post hoc test for all time points and two-tailed Student’s t-test for grouped comparisons (2nd vs 3rd instar). P-value from Tukey’s test for 72 vs 96 h is reported. The percentage of dynamic branches (Top left): ANOVA: F3, 28 = 11.68, P < 0.001; Tukey’s: P = 0.002; t-test: t30 = 5.834, P < 0.001. The number of newly appeared branches (Top right): ANOVA: F3, 28 = 4.826, P = 0.008; Tukey’s: P = 0.01; t-test: t30 = 3.553, P = 0.001. The distance traveled by branch tips (Bottom left): Tukey’s: P = 0.004; t-test: t30 = 4.551, P < 0.001. The total number of events in 10 min (Bottom right): ANOVA: F3, 28 = 5.8, P = 0.003; Tukey’s: P = 0.006; t-test: t30 = 3.997, P < 0.001. ns, not significant, *P < 0.05, **P < 0.01, ***P < 0.001. d Representative 3D rendering images of tracking trajectories generated by movements of dynamic filopodia in single-labeled LNvs collected at 72, 96, and 120 h. Scale bar, 5 μm
Fig. 2
Fig. 2
LNv dendrites change from dynamic to stable during development. a, b At all stages, most extensions are within 2 μm or lasted less than 2 min. More extension events that last longer than 2 min or travel further than 2 μm were observed in young neurons as compared to mature neurons. Distributions of distance and duration are shown. c, d Retractions behave similarly as extensions. Statistical significance was assessed by two-tailed Student’s t-test for extensions/retractions with distance more than 2 μm or duration more than 2 min. a P < 0.001, 2nd vs 3rd instar; P = 0.008, 72 vs 96 h. b P < 0.001, 2nd vs 3rd instar; P = 0.018, 72 vs 96 h. c P < 0.001, 2nd vs 3rd instar; P = 0.004, 72 vs 96 h. d P = 0.011, 2nd vs 3rd instar; P = 0.001, 72 vs 96 h. e Dendrites in young LNvs (72 h) extend and retract faster than the ones in mature LNvs (96 h). Statistical significance was assessed by sum-of-squares F test of slopes generated by linear fitting of the distance vs. duration. For extension: slope is 1.113 ± 0.044 for 72 h, and 0.738 ± 0.075 for 96 h. For retraction: slope is −0.917 ± 0.037 for 72 h, and −0.639 ± 0.025 for 96 h; P < 0.001 for both comparisons. n = 11, 72 h; n = 13, 96 h. f Cumulatively, young neurons (48 and 72 h) extend and retract significantly more than mature neurons (96 and 120 h), without affecting the total dendritic length. Statistical significance was assessed by two-tailed Student’s t-test. Extended length: P < 0.001; retracted length: P < 0.001. n = 7, 7, 10, and 8 for 48, 72, 96, and 120 h, respectively, for ad, and f. Data are presented as box plot (box, 25–75%; center line, median) for ad; Bar heights are means and error bars are SEM in ef; ns, not significant; *P < 0.05, **P < 0.01, ***P < 0.001
Fig. 3
Fig. 3
Temporal coupling of dendrite dynamics with synaptogenesis in LNvs. a Representative projected confocal images of the LNv dendrite (green) co-labeled with Rh5,6-Brp:mCherry (magenta). Scale bar, 5 μm. b The LNv dendrite volume (gray), the number of presynaptic terminals from the BN in the LON region (Rh5,6-Brp puncta, magenta spots) and the number of Brp puncta contacting the LNv dendrites (synaptic contacts, yellow spots) were analyzed using 3D reconstructions. Representative images for samples collected at the indicated time points are shown. Scale bar, 5 μm. c LNv dendrite volume (Top) increases during development until 96 h; Rh5,6-Brp puncta (Middle) shows similar trend and plateaus at 96 h; The number of synaptic contacts (Bottom) increases significantly from 48 to 72 h, then remains steady. n = 18, 11, 12, and 13 for 48, 72, 96, and 120 h, respectively. Statistical significance was assessed by one-way ANOVA followed by Tukey’s post hoc test. Volume (Top), ANOVA: F3, 50 = 60.19, P < 0.001; Tukey’s: P < 0.001, 48 vs 72 h and 72 vs 96 h; P = 0.949, 96 vs 120 h. Rh5,6-Brp puncta (Middle), ANOVA: F3, 50 = 30.03, P< 0.001; Tukey’s: P < 0.001, 48 vs 72 h; P = 0.015, 72 vs 96 h; P = 0.963, 96 vs 120 h. Synaptic contacts (Bottom), ANOVA: F3, 50 = 9.465, P < 0.001; Tukey’s: P = 0.001, 48 vs 72 h; P = 0.955, 72 vs 96 h; P = 0.278, 96 vs 120 h. Data are presented as box plot (box, 25–75%; center line, median) overlaid with dot plot (individual data points). ns, not significant; *P < 0.05, ***P < 0.001. d The number of synaptic contacts (black) reaches saturation at 72 h, coinciding with the peak of LNv dendrite dynamics (red). Trend lines were generated using data from Figs. 1c, 3c. Error bars represent SEMs
Fig. 4
Fig. 4
Experience-dependent modification of the dynamic state of LNv dendrites. a Representative tracking trajectories generated by movements of dynamic filopodia in single-labeled LNvs collected at 120 h AEL from larvae cultured in light dark (LD), constant light (LL), or constant darkness (DD). Scale bar, 5 μm. b Differential visual experiences provided by LL or DD during larval development generate opposite effects on dendrite dynamics in LNvs. Compared to LD, the percentage of dynamic branches, as well as the number of newly appeared branches, significantly increases in DD but decreased in LL. n = 9, 12, and 11 for LD, LL, and DD, respectively. Statistical significance was assessed by one-way ANOVA with Dunnett post hoc test. Dynamic branches (Left), ANOVA: F2, 29 = 39.441, P< 0.001; Dunnett: P < 0.001, LD vs others. New branches (Right), ANOVA: F2, 29 = 14.85, P < 0.001; Dunnett: P = 0.021, LD vs LL; P = 0.044, LD vs DD. c Compared to the LD group, young LNvs (72 h) cultured in LL have significantly reduced dendrite dynamics, close to the levels observed in mature LNv (120 h) cultured in LD. n = 9, 9, 9, and 12 for 72LD, 72LL, 120LD, and 120LL, respectively. Statistical significance was assessed by two-tailed Student’s t-test. Dynamic branches (Left): t16 = 4.012, P = 0.001, 72LD vs 72LL; t19 = 4.297, P < 0.001, 120LD vs 120LL; t16 = 0.194, P = 0.849, 72LL vs 120LD. New branches (Right): t16 = 2.59, P = 0.02, 72LD vs 72LL; t19 = 4.101, P < 0.001, 120LD vs 120LL; t16 = 1.017, P = 0.324, 72LL vs 120LD. Data are presented as box plot (box, 25–75%; center line, median) overlaid with dot plot (individual data points). ns, not significant; *P < 0.05, **P < 0.01, ***P < 0.001
Fig. 5
Fig. 5
Experience-dependent modifications of dendrite growth and synaptogenesis in LNvs. a LL conditions alter the temporal profile of dendrite growth and synapse formation. LNv dendrite volume and the number of presynaptic terminals from the BN in the LON region (Rh5,6-Brp puncta) plateaued at 72 h, while the number of Brp puncta contacting the LNv dendrites (synaptic contacts) remains unchanged from 48 h. n = 13, 15, 14, 14 for 48, 72, 96, 120 h, respectively. Statistical significance was assessed by one-way ANOVA with Tukey’s post hoc test. Volume (Left), ANOVA: F3, 52 = 32.38, P < 0.001; Tukey’s: P < 0.001, 48 vs 72 h; P = 0.956, 72 vs 96 h; P = 0.974, 96 vs 120 h. Synaptic contacts (Middle), ANOVA: F3, 52 = 2.493, P = 0.07; Tukey’s: P = 0.859, 48 vs 72 h; P = 0.284, 72 vs 96 h; P = 0.155, 96 vs 120 h. Rh5,6-Brp puncta (Right), ANOVA: F3, 52 = 12.96, P < 0.001; Tukey’s: P < 0.001, 48 vs 72 h; P = 0.369, 72 vs 96 h; P = 0.906, 96 vs 120 h. Data are presented as box plot (box, 25–75%; center line, median) overlaid with dot plot (individual data points). b Compared to the LD condition, LL produces a premature termination of synapse formation and dendrite volume expansion, without affecting the number of presynaptic terminals from the BN. Trend lines of the three parameters from LD or LL were plotted. Error bars represent SEMs. LD and LL compared at each developmental stage by two-tailed Student’s t-test. Volume (Left), 48 h: t29 = 3.398, P = 0.002; 96 h: t24 = 2.544, P = 0.018; 120 h: t25 = 2.801, P = 0.01. Synaptic contacts (Middle), 72 h: t24 = 3.825, P = 0.001; 120 h: t25 = 2.298, P = 0.03. Rh5,6-Brp puncta (Right), 72 h: t24 = 2.253, P = 0.034. ns, not significant; *P < 0.05, **P < 0.01, ***P < 0.001
Fig. 6
Fig. 6
RNAi knockdown of Amph elevates dendritic dynamics in LNv without affecting dendrite morphology. a Knocking-down Amph expression does not affect LNv dendrite morphology in both LD and LL conditions. Representative projected confocal images of LNvs collected at 120 h AEL are shown. Genotypes and culture conditions were as indicated. Dendritic field are circled with dashed lines (red). b Knocking-down Amph led to increased number of dynamic events at 120 h in LL. Representative cropped frames from live imaging series are shown. Extensions (green) and retractions (magenta) were only observed in the LNv expressing RNAi targeting Amph. Scale bar, 5 μm. c Knocking-down Amph in LNvs increases dendrite dynamics without affecting dendrite morphology. Representative tracking trajectories generated by movements of dynamic filopodia in single-labeled LNvs are shown. Genotypes are as indicated. d Compared to the control, both the percentage of dynamic branches and the number of newly appeared branches increase significantly in the Amph knockdown group. n = 13, pdf > Dicer2; n = 9, pdf > Dicer2, AmphRNAi. Statistical significance was assessed by two-tailed Student’s t-test. Dynamic branches (Top): t20 = 2.243, P = 0.036. New branches (Bottom): t20 = 4.657, P < 0.001. e Knocking-down Amph does not affect LNv dendrite volume or the number of Brp puncta contacting LNv dendrites (synaptic contacts). n = 12, pdf > Dicer2; n = 10, pdf > Dicer2, AmphRNAi. Statistical significance was assessed by two-tailed Student’s t-test. Volume (Top): t20 = 0.503, P = 0.62. Synaptic contacts (Bottom): t20 = 1.015, P = 0.322. Data are presented as box plot (box, 25–75%; center line, median) overlaid with dot plot (individual data points). ns, not significant; *P < 0.05, **P < 0.01, ***P < 0.001
Fig. 7
Fig. 7
Drosophila Amph regulates the dynamic state of LNv dendrites cell-autonomously. a Compared to the background control, amph null mutants (Amph−/−) have significant reductions of dendrite volume (green or gray), the number of presynaptic terminals (magenta), and synaptic contacts (yellow spots). Representative projected confocal images (Top) or 3D reconstructions (Bottom) are shown. Genotypes are as indicated. Scale bar, 5 μm. b The reduction of dendrite volume, Rh5,6-Brp puncta or synaptic contacts, in Amph−/− was not rescued by introducing an Amph transgene into LNvs (Amph−/−, pdf > UAS-Amph). n = 15, 15, and 20 for Control, Amph−/−, and Amph−/−, Pdf > UAS-Amph respectively. Statistical significance was assessed by one-way ANOVA with Tukey’s post hoc test. Volume (Top left), ANOVA: F2, 47 = 14.21, P < 0.001; Tukey’s: P < 0.001, Control vs others; P = 0.468, Amph−/− vs Amph−/−, Pdf > UAS-Amph. Rh5,6-Brp puncta (Top right), ANOVA: F2, 47 = 22.26, P < 0.001; Tukey’s: P < 0.001, Control vs others; P = 0.842, Amph−/− vs Amph−/−, Pdf > UAS-Amph. Synaptic contacts (Bottom left), ANOVA: F2, 47 = 14.99, P < 0.001; Tukey’s: P < 0.001, Control vs others; P = 0.876, Amph−/− vs Amph−/−, Pdf > UAS-Amph. c Elevated dendrite dynamics in Amph−/− is partially rescued by reintroducing Amph into LNvs. n = 11, 12, and 9 for Control, Amph−/−, and Amph−/−, Pdf > UAS-Amph respectively. Quantifications were from all four LNvs of larvae raised in LL to 120 h AEL. Statistical significance was assessed by one-way ANOVA with Tukey’s post hoc test. ANOVA: F2, 29 = 3.82, P = 0.034; Tukey’s: P = 0.026, Control vs Amph−/−; P = 0.284, Control vs Amph−/−, Pdf > UAS-Amph; P = 0.565, Amph−/− vs Amph−/−, Pdf > UAS-Amph. Scale bar, 5 μm. Data are presented as box plot (box, 25–75%; center line, median) overlaid with dot plot (individual data points). ns, not significant; *P < 0.05, **P < 0.01, ***P < 0.001
Fig. 8
Fig. 8
Amph is required for postsynaptic organization and normal synaptic transmission. a Schematic diagram for calcium imaging experiments. BO-mediated synaptic transmission is received by LNv dendrites (dashed gray circle) and measured by the changes of GCaMP6s signals in the axonal terminal region of LNvs (dashed red circle). b Knocking-down Amph led to reductions in light-induced responses in LNvs. The changes in GCaMP signal (ΔF/F) were plotted. Data are presented as line graph showing Mean ± SEM. Arrow indicates the delivery of the light stimulation. c Quantification reveals reduced amplitude and delayed peak time of calcium responses in LNvs expressing Amph RNAi. n = 7, pdf > Dicer2; n = 8, pdf > Dicer2, AmphRNAi. Statistical significance was assessed by two-tailed Student’s t-test. Amplitude: t13 = 2.742, P = 0.017. Peak time: t13 = 2.491, P = 0.027. d Disrupted dendritic Fas2 distribution in LNvs expressing Amph RNAi. While CD8:GFP (pdf > CD8:GFP, left) shows no change, the volume of dendritic extra-Fas2:YFP (pdf > extra-Fas2:YFP, right) is reduced in LNvs with Amph knockdown. Representative projected confocal images (green) and 3D reconstructions (gray) are shown. Scale bar, 5 μm. e Quantification of dendritic extra-Fas2:YFP based on 3D reconstructions. n = 10, pdf > Dicer2; n = 14, pdf > Dicer2, AmphRNAi. Statistical significance was assessed by two-tailed unpaired Student’s t-test. t22 = 3.969, P < 0.001. fh Amph knockdown reduces the synaptic distribution of Fas2. f Representative projected confocal images of LNvs are shown. Scale bar, 5 μm. Genotypes are as indicated. g A representative single optic section image illustrating the dendritic Fas2 (extra-Fas2:YFP, green) contacting the presynaptic site marked by Brp (Rh5,6-Brp, magenta). Contacts are indicated by *, non-contacts by o. Scale bar, 2 μm. h Quantifications of the number of contacts between Brp puncta and extra-Fas2:YFP. Knocking-down Amph led to reduced number of Fas2-Brp contacts. n = 11, pdf > Dicer2; n = 12, pdf > Dicer2, AmphRNAi. Statistical significance was assessed by two-tailed Student’s t-test. t21 = 2.988, P = 0.007. Data are presented as box plot (box, 25–75%; center line, median) overlaid with dot plot (individual data points). ns, not significant; *P < 0.05, **P < 0.01, ***P < 0.001

Similar articles

Cited by

References

    1. Wu GY, Cline HT. Stabilization of dendritic arbor structure in vivo by CaMKII. Science. 1998;279:222–226. doi: 10.1126/science.279.5348.222. - DOI - PubMed
    1. Portera-Cailliau C, Pan DT, Yuste R. Activity-regulated dynamic behavior of early dendritic protrusions: evidence for different types of dendritic filopodia. J. Neurosci. 2003;23:7129–7142. doi: 10.1523/JNEUROSCI.23-18-07129.2003. - DOI - PMC - PubMed
    1. Ziv NE, Smith SJ. Evidence for a role of dendritic filopodia in synaptogenesis and spine formation. Neuron. 1996;17:91–102. doi: 10.1016/S0896-6273(00)80283-4. - DOI - PubMed
    1. Wong WT, Faulkner-Jones BE, Sanes JR, Wong RO. Rapid dendritic remodeling in the developing retina: dependence on neurotransmission and reciprocal regulation by Rac and Rho. J. Neurosci. 2000;20:5024–5036. doi: 10.1523/JNEUROSCI.20-13-05024.2000. - DOI - PMC - PubMed
    1. Niell CM, Meyer MP, Smith SJ. In vivo imaging of synapse formation on a growing dendritic arbor. Nat. Neurosci. 2004;7:254–260. doi: 10.1038/nn1191. - DOI - PubMed

Publication types

LinkOut - more resources