. 2018 Aug;560(7720):601-606.
doi: 10.1038/s41586-018-0442-2. Epub 2018 Aug 22.

Structure of paused transcription complex Pol II-DSIF-NELF

Affiliations

Structure of paused transcription complex Pol II-DSIF-NELF

Seychelle M Vos et al. Nature. 2018 Aug.

Abstract

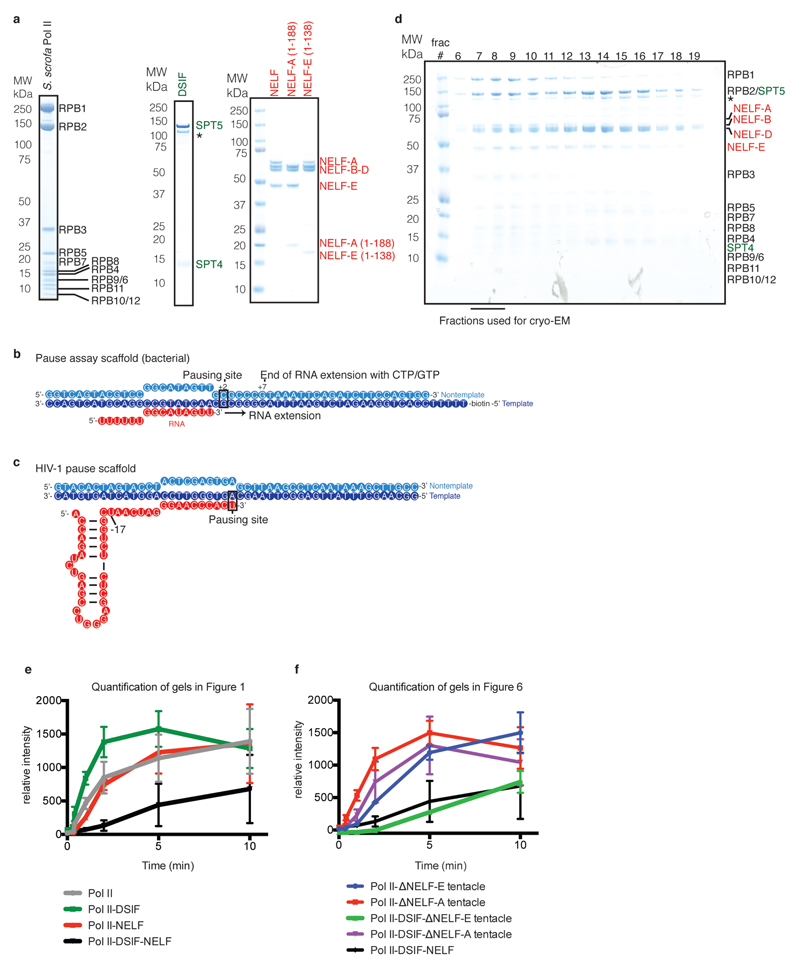
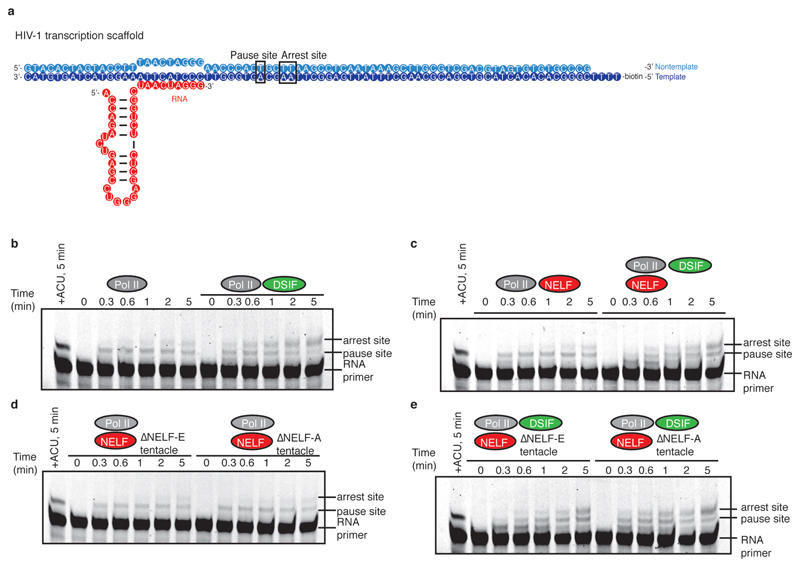
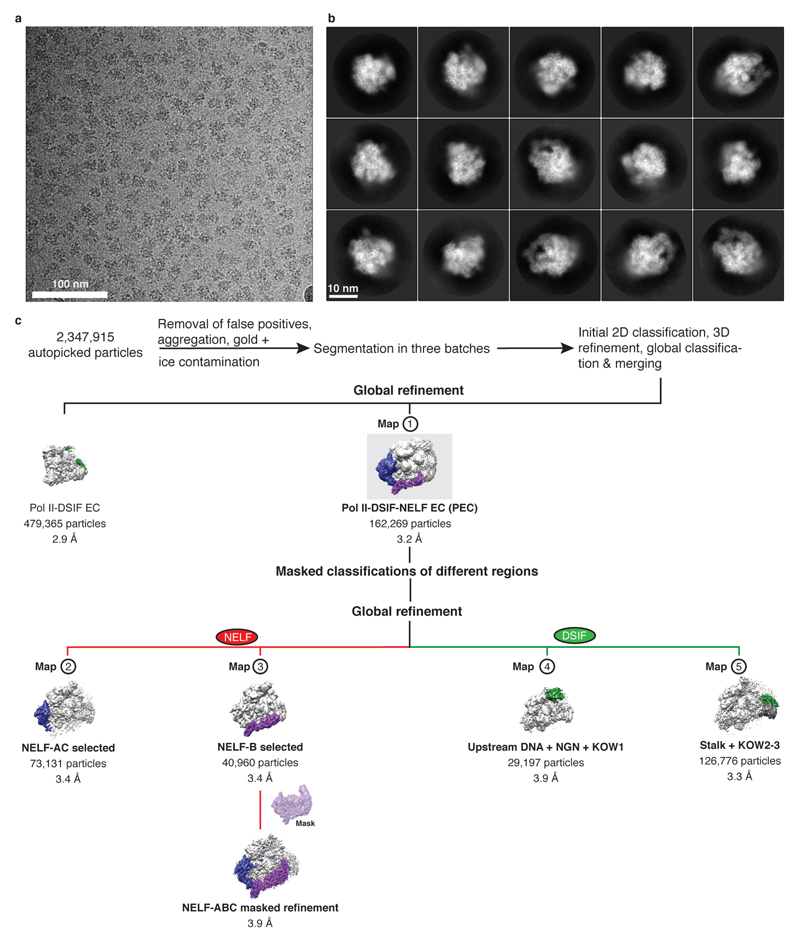
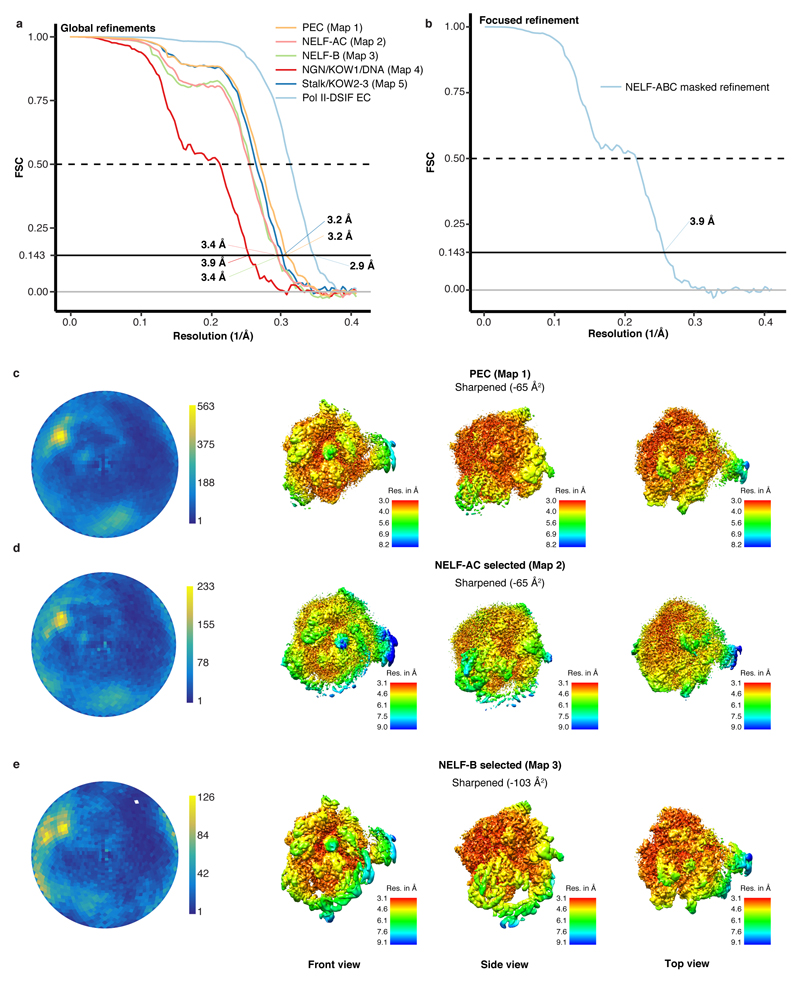
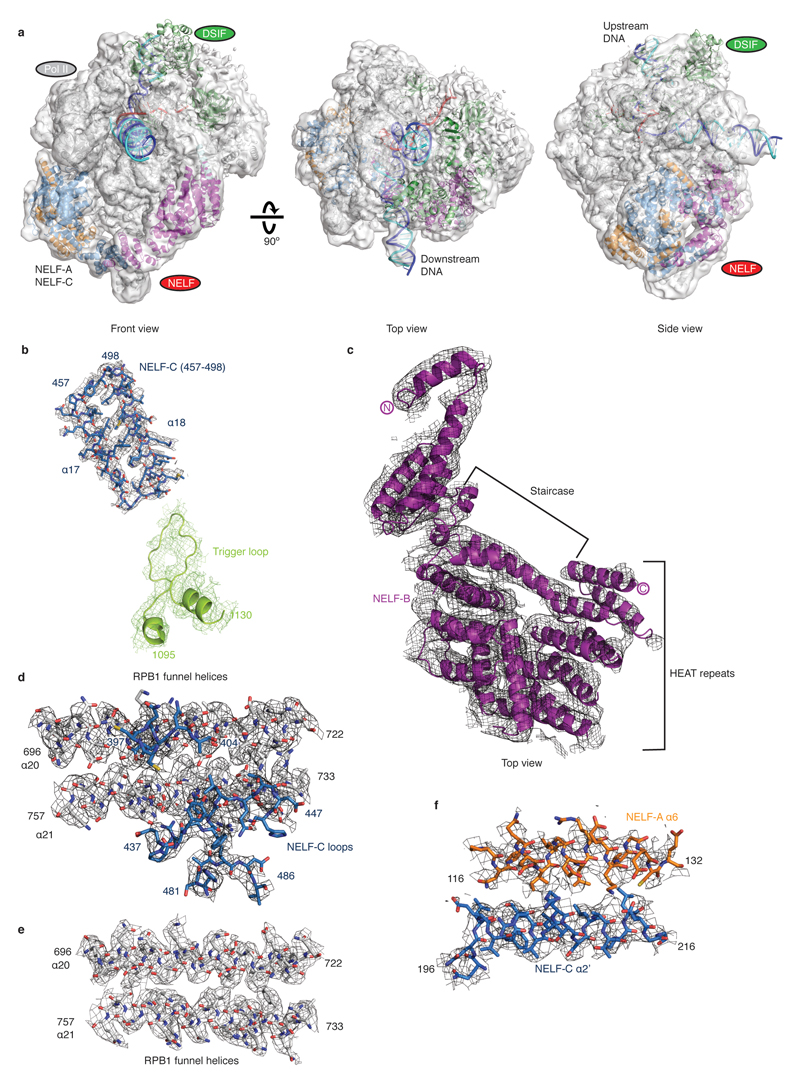
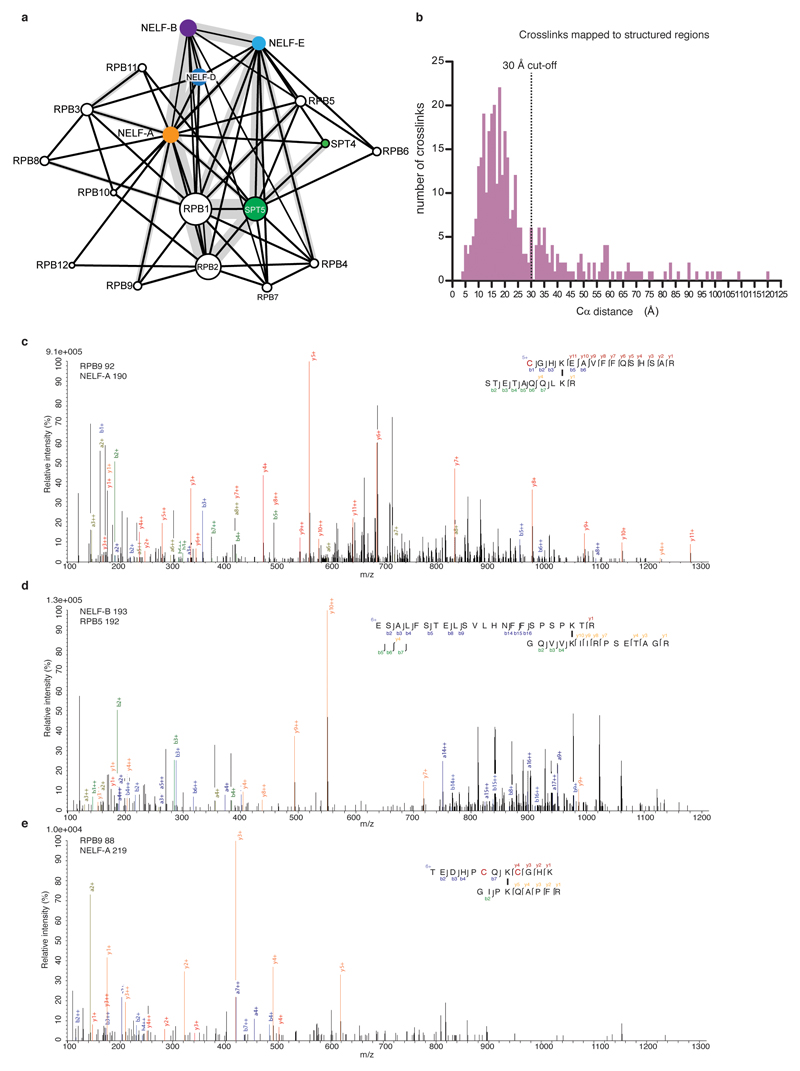
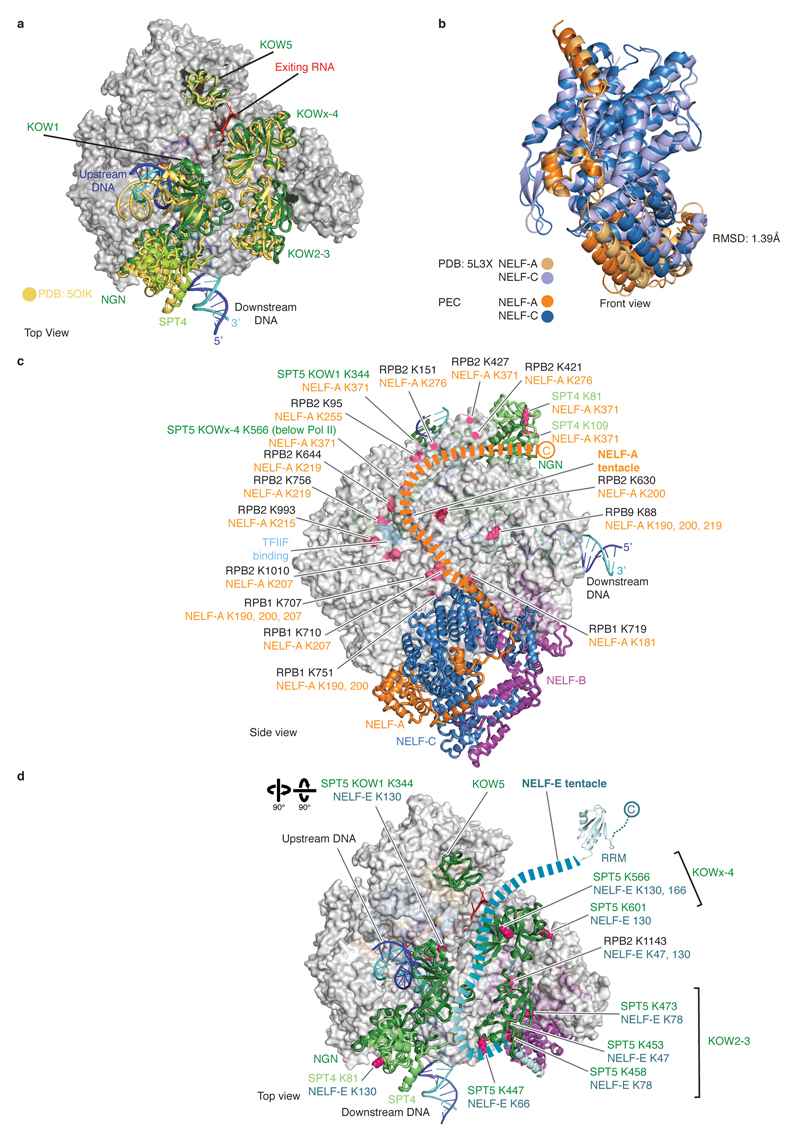
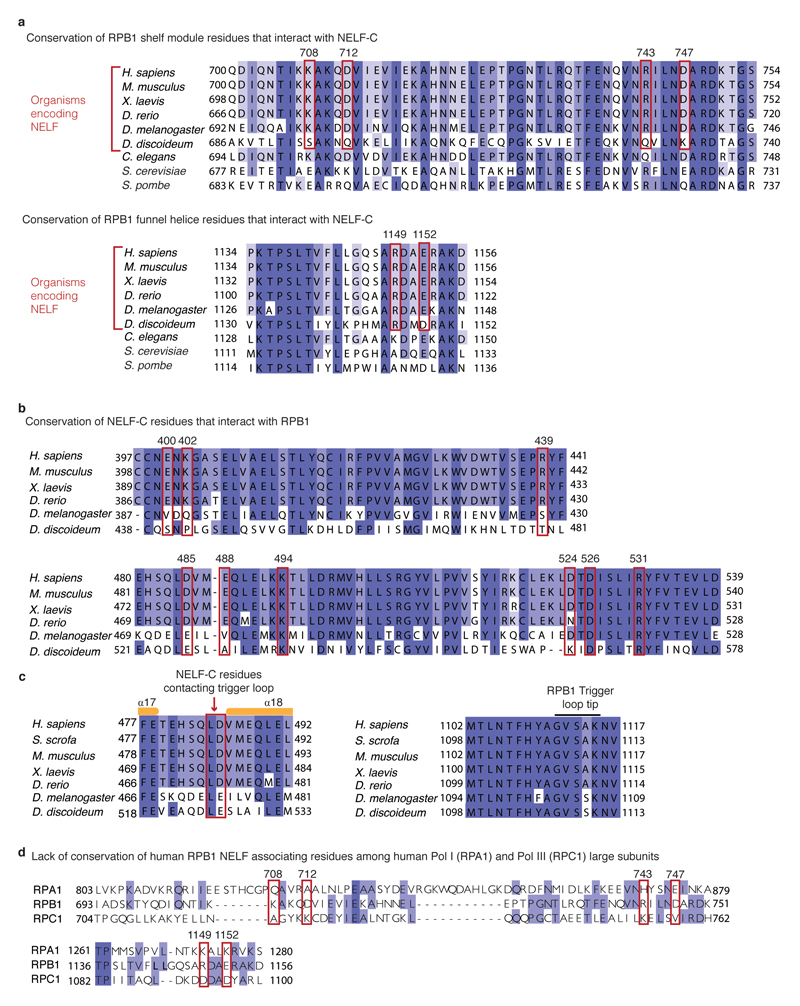
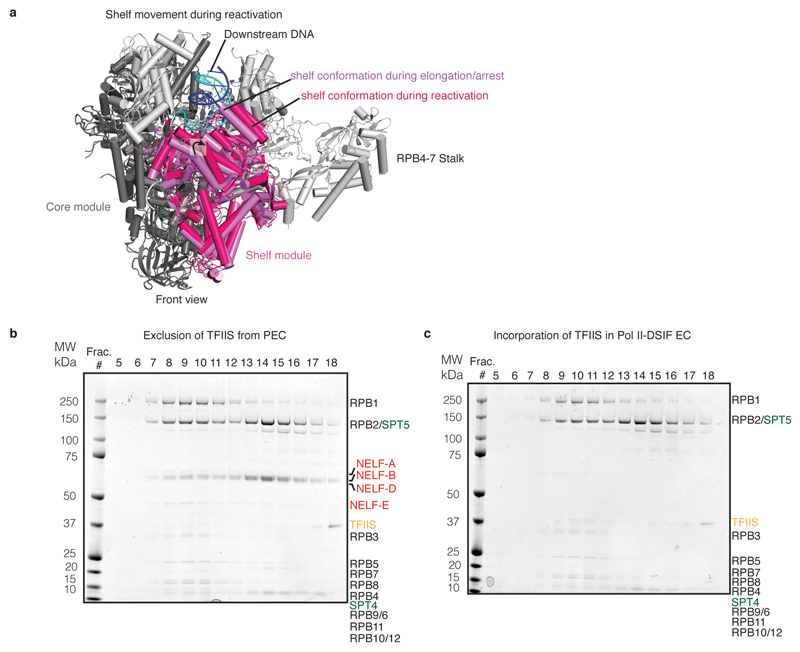
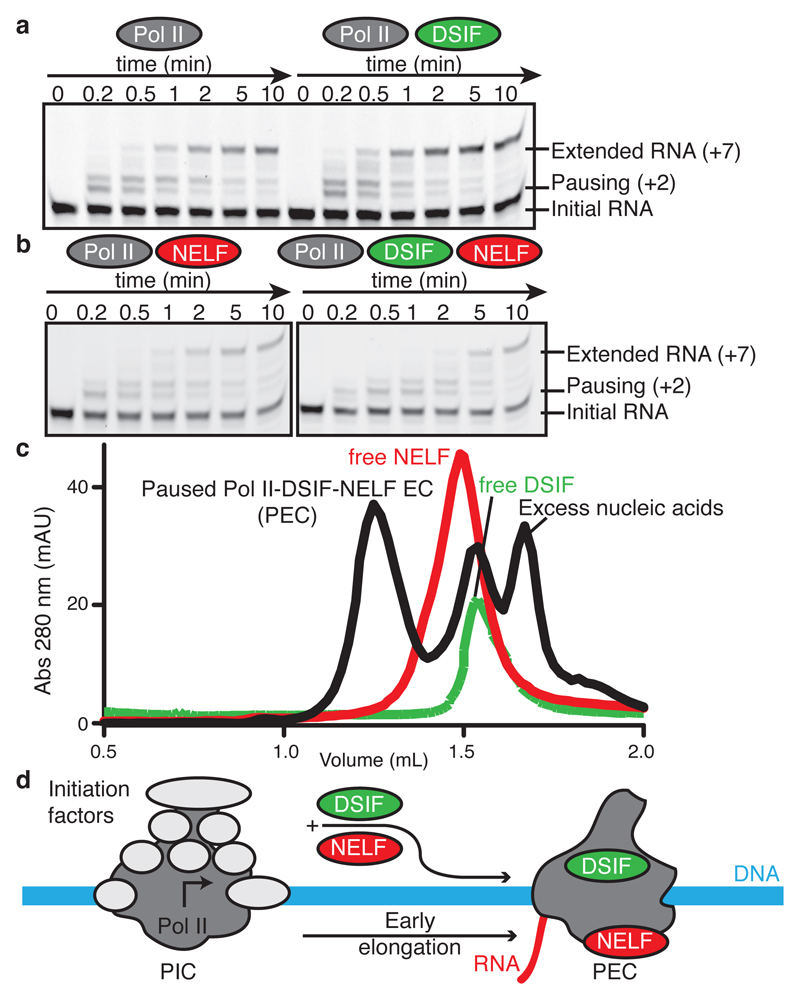
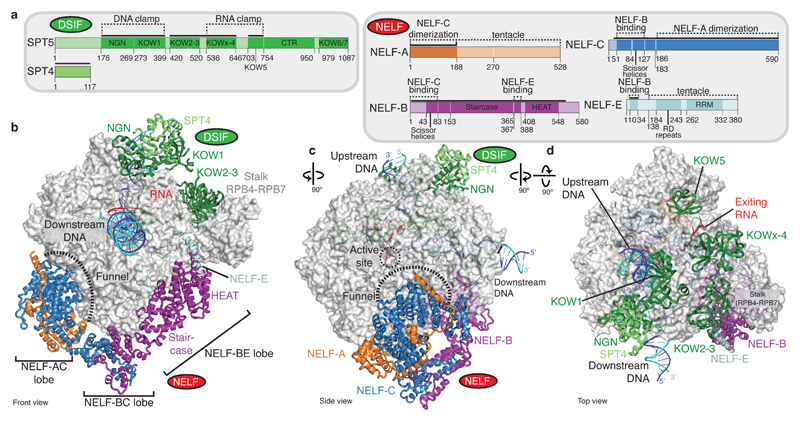
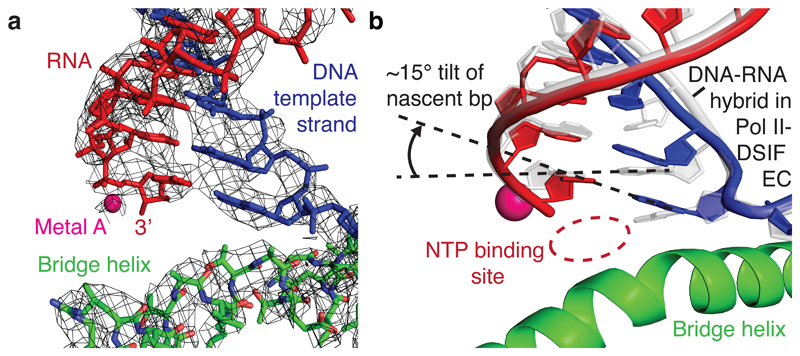
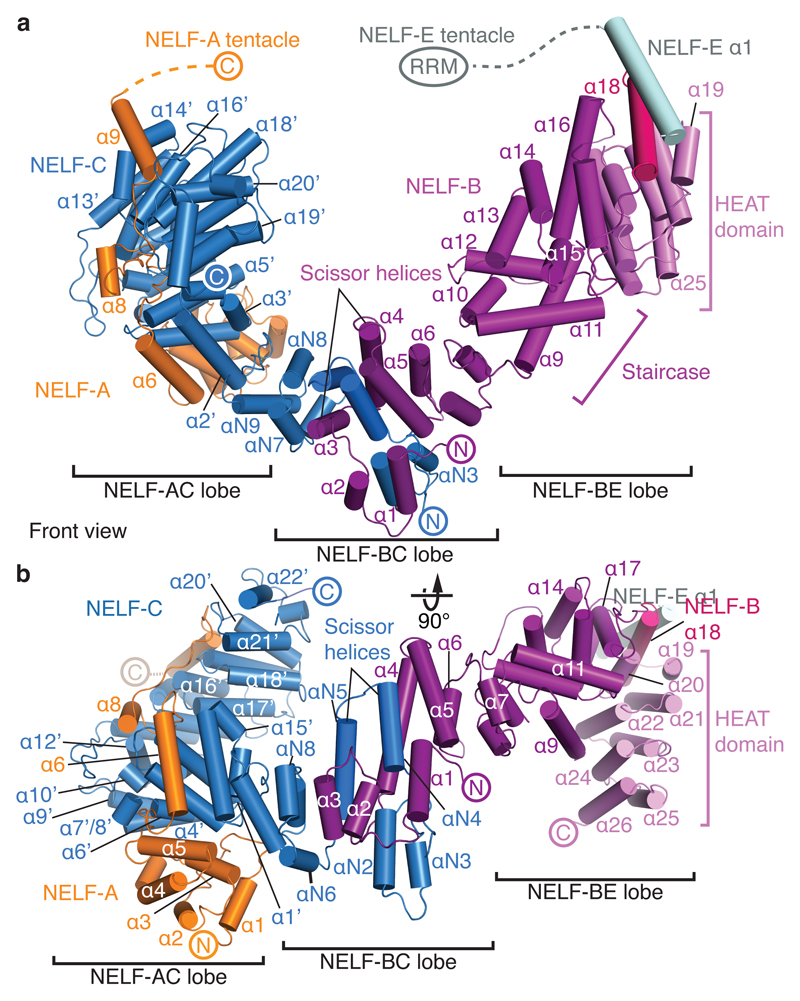
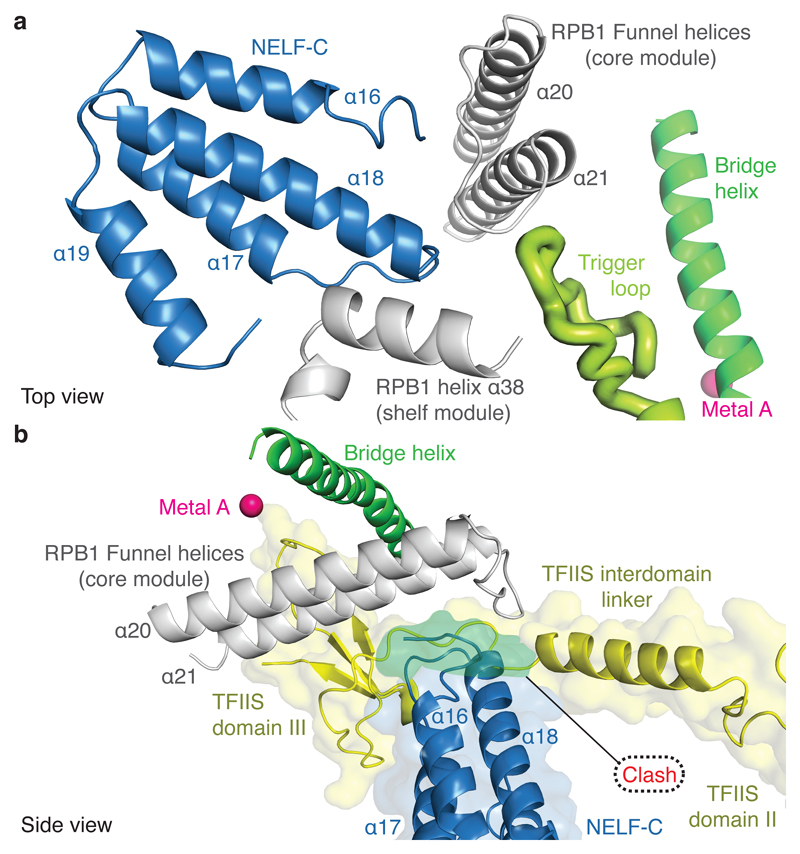
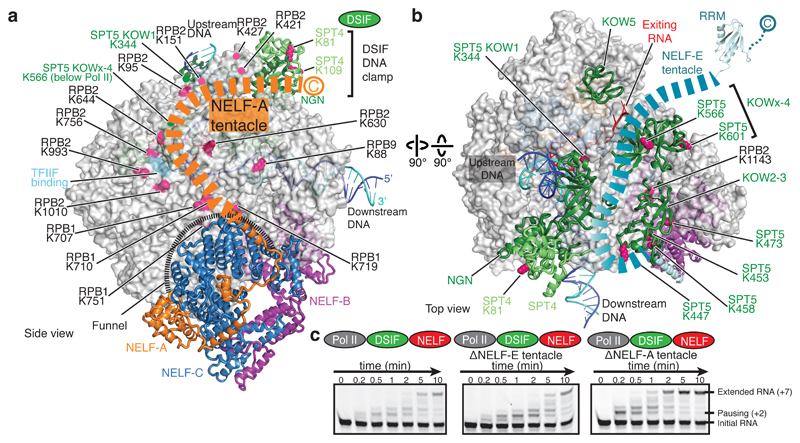
Metazoan gene regulation often involves the pausing of RNA polymerase II (Pol II) in the promoter-proximal region. Paused Pol II is stabilized by the protein complexes DRB sensitivity-inducing factor (DSIF) and negative elongation factor (NELF). Here we report the cryo-electron microscopy structure of a paused transcription elongation complex containing Sus scrofa Pol II and Homo sapiens DSIF and NELF at 3.2 Å resolution. The structure reveals a tilted DNA-RNA hybrid that impairs binding of the nucleoside triphosphate substrate. NELF binds the polymerase funnel, bridges two mobile polymerase modules, and contacts the trigger loop, thereby restraining Pol II mobility that is required for pause release. NELF prevents binding of the anti-pausing transcription elongation factor IIS (TFIIS). Additionally, NELF possesses two flexible 'tentacles' that can contact DSIF and exiting RNA. These results define the paused state of Pol II and provide the molecular basis for understanding the function of NELF during promoter-proximal gene regulation.


Conflict of interest statement

The author declare that they have no competing financial interest.

Figures

Extended Data Figure 1
Extended Data Figure 1. Protein preparation and nucleic acid scaffold design.
a. Quality of purified proteins used in this study. Purified proteins (0.9 µg) were run on 4-12% SDS-PAGE and stained with Coomassie blue. A star demarcates SPT5 lacking an N-terminal region. b. Nucleic acid scaffold used for RNA extension assays, ‘pause assay scaffold’. Template DNA is coloured in dark blue, non-template DNA is in light blue, and RNA is in red. c. Nucleic acid scaffold used for binding experiments and for cryo-EM analysis, ‘HIV-1 pause scaffold’. Coloured as in b. d. SDS-PAGE analysis of size exclusion fractions. Fractions used for cryo-EM analysis marked. e. Quantification of RNA extension assays shown in Figure 1. The amount of elongated product was measured for each time point. Points are the mean of three independent experiments and error bars represent the standard deviation between experiments. f. Quantification of RNA extension assays shown in Figure 6. The amount of elongated product was measured for each time point. Points are the mean of three independent experiments and error bars represent the standard deviation between experiments.
Extended Data Figure 2
Extended Data Figure 2. RNA extension assays on HIV-1 nucleic acid scaffold.
a. HIV-1 nucleic acid scaffold used for RNA extension assays. The sequence is slightly altered from that used for cryo-EM to allow extension for 8 bases prior to pausing. Known pause and arrest sites are marked on the sequence. b-e. Pol II ECs (75 nM) were reconstituted on the HIV-1 transcription scaffold (50 nM). A single reaction was incubated with ATP, CTP, and UTP (0.5 mM) for 5 minutes to indicate the pause site (far right lane). Buffer (b), DSIF (b), NELF (c), DSIF and NELF (c), NELF tentacle mutants (d), or DSIF and NELF tentacle mutants (e) (300 nM) were incubated with the Pol II EC. NTPs were added (0.5 mM) and aliquots were taken at specific time points. Only a fraction of the starting RNA is successfully elongated due to incomplete EC formation (see Methods for more information).
Extended Data Figure 3
Extended Data Figure 3. Cryo-EM data collection and processing.
a. Representative micrograph of PEC data collection shown at a defocus of -2.5 µm. The micrograph is representative of 11,740 micrographs. b. Representative 2D classes of PEC particles. c. Classification tree for data processing. Numbers used to identify each map are shown above the corresponding map.
Extended Data Figure 4
Extended Data Figure 4. Quality of cryo-EM data.
a-b. Estimation of average resolution. The lines indicate the Fourier shell correlation (FSC) between the half maps of the reconstruction. FSC curves are shown for each map. c-e. Angular distribution of particles from overall refinements and local resolution of selected refinements. Shading from blue to yellow indicates the number of particles at a given orientation. Reconstructions coloured by local resolution. Shading from red to blue indicates the local resolution according to the accompanying colour gradient. Absolute values are indicated. B-factors were used as indicated.
Extended Data Figure 5
Extended Data Figure 5. Fit of PEC structure in representative densities.
a. PEC structure fit in electron density contoured to 6 Å from Map 3. Front and Top views are shown. b-f. Electron density for various elements of the PEC structure shown as meshes. b. A loop connecting NELF-C helices 17 and 18 (Map 3, grey mesh) contacts the trigger loop (Map 2, limon mesh). c. NELF-B (Map 3) d. NELF-C contacts the RPB1 funnel helices (α20, α21). e. Funnel helices (α20, α21). f. NELF-AC interaction (A-α6, C-α2’).
Extended Data Figure 6
Extended Data Figure 6. Crosslinking-mass spectrometry analysis.
a. Overview of PEC crosslinks obtained with BS3. Subunits coloured as in Fig. 1. Thickness of the grey line connecting subunits signifies the number of crosslinks obtained between subunits. b. Histogram of unique crosslinks that were mapped onto our structure. Distances are measured between Cα pairs using Xlink analyzer for crosslinks with a score greater than 5. The number of unique crosslinks detected at each distance is indicated. A dotted black line marks the 30 Å distance cut-off for BS3. c-e. Representative spectra from crosslinking mass spectrometry experiments. Blue, red and dark blue correspond to b-, y-, and a-ions of peptide A, respectively. Green, orange, and dark green correspond to b-, y-, and a-ions of peptide B. Black bars drawn between lysines indicate crosslinking sites. Red highlighted “C” represent carbamido-methaylated cysteine residues. Relative intensity of m/z is plotted. Spectra are representative of 1 biological and 2 technical replicates.
Extended Data Figure 7
Extended Data Figure 7. Comparison of previous structures to PEC.
a. The PEC and Pol II-DSIF EC structures were aligned by their Pol II cores. Slight differences are observed in DSIF bound to the PEC (green) in comparison to Pol II-DSIF EC(yellow). b. The previously solved NELF-AC dimerization crystal structure (PDB ID 5L3X) and the NELF-AC dimerization domain from the PEC cryo-EM structure were aligned on the NELF-C subunit. The NELF-AC dimer widens when bound to Pol II (RMSD 1.39 Å). c. NELF-A tentacle crosslinks mapped onto structure. NELF-A and corresponding Pol II or DSIF residues are indicated. Related to Fig. 6. d. NELF-E tentacle crosslinks mapped onto structure. NELF-E and corresponding Pol II or DSIF residues are indicated. Related to Fig. 6.
Extended Data Figure 8
Extended Data Figure 8. Conservation of Pol II and NELF elements.
Sequence alignments were made using MAFFT and were visualized in Jalview. Sequences elements are coloured by identity. Darker shades of blue indicate higher levels of identity. Red boxes demarcate interacting residue. a. Conservation of RPB1 funnel helix and shelf module residues that interact with NELF-C. Organisms that encode for NELF are indicated. b. Conservation of NELF-C residues that interact with RPB1 funnel helix and shelf module residues. c. Conservation of NELF-C region that interact with the trigger loop and the RPB1 trigger loop. d. Conservation of Pol I (RPA1), Pol II (RPB1), and Pol III (RPC1) large subunits and putative NELF-C interaction interface.
Extended Data Figure 9
Extended Data Figure 9. TFIIS does not interact with the PEC.
a. Shelf movement relative to Pol II core during reactivation. An arrested Pol II crystal structure (PDB ID: 3PO2) and the crystal structure of its reactivation intermediate (PDB ID: 3PO3) were aligned on their Pol II core modules,(dark grey). The shelf module (pink) rotates away from the core module during reactivation. b. TFIIS does not bind the PEC. Fractions from size exclusion chromatography with Pol II, DSIF, NELF, and TFIIS. EC was incubated with DSIF, NELF, and TFIIS and applied to a Superose 6 column. The PEC is formed, but TFIIS does not migrate with the PEC. The experiment was performed twice. c. TFIIS binds the Pol II-DSIF EC. Fractions from size exclusion chromatography with Pol II, DSIF, and TFIIS. EC was incubated with DSIF and TFIIS. A stable Pol II-DSIF-TFIIS EC is formed. The experiment was performed twice.
Figure 1
Figure 1. Formation of paused Pol II-DSIF-NELF elongation complex (PEC).
a. DSIF alone does not stabilize Pol II pausing. Fluorescence-monitored RNA extension (Methods) on the pause assay scaffold (50 nM) with a 5’ FAM-labelled RNA, 75 nM Pol II (left) or Pol II and 237 nM DSIF (right). Reactions were quenched at various times after GTP/CTP (10 µM) addition and RNAs were separated on TBE urea gels. ECs were assembled two nucleotides before the consensus pause site (+2). The band above the +2 band stems from a backtracked species. The +2 site and extended RNA are marked. All experiments were performed at least 3 times. Quantification of gels in panels a and b can be found in Extended Data Fig. 1e. A fraction of the input RNA remains due to inefficient EC formation (Methods). b. DSIF and NELF are required for stable Pol II pausing. Experiments conducted as in a but in the presence of 237 nM NELF (left) or 237 nM DSIF and NELF (right). All experiments were performed at least three times. c. Formation of a stable paused Pol II-DSIF-NELF EC (PEC) on a Superose 6 size exclusion chromatography column. Curves show absorption at 280 nm milli absorption units (mAU) at specific elution volumes (mL). All experiments were performed three times. d. Schematic of conversion of the Pol II pre-initiation complex (PIC) to a promoter-proximally paused Pol II-DSIF-NELF EC (PEC).
Figure 2
Figure 2. Cryo-EM structure of the PEC.
a. Domain architecture of DSIF and NELF subunits. The colour code is used throughout. Solid black lines indicate modelled regions. b-d. Cartoon model viewed from the Pol II front (b), side (c), and top (d). Pol II is shown as a silver surface, DSIF and NELF as ribbon models. The active site metal ion A is depicted as a magenta sphere. DNA template and non-template strands are in blue and cyan, respectively. RNA is red.
Figure 3
Figure 3. Tilted DNA-RNA hybrid.
a. Cryo-EM density (grey mesh) for the DNA-RNA hybrid and bridge helix in the Pol II active site. b. Comparison of tilted DNA-RNA hybrid in the PEC structure (blue/red) with the post-translocated hybrid in the previously solved Pol II-DSIF EC structure (grey).
Figure 4
Figure 4. NELF structure.
a. Three-lobed NELF structure adopted in the PEC. Helices are shown as cylinders. NELF domains and elements are indicated. The view corresponds to the front view in Fig. 2b. b. The structure shown in a, but rotated by 90° around a horizontal axis.
Figure 5
Figure 5. NELF restricts Pol II mobility.
a. The NELF-AC dimer bridges the Pol II core and shelf modules. The loop connecting NELF-C helices 17 and 18 contacts the open trigger loop (light green). b. NELF sterically impairs TFIIS binding. A human Pol II-TFIIS structure (PDB ID 5IYC) was superimposed onto the PEC structure by matching the Pol II core modules. TFIIS is shown in yellow. The clashing region is shown in green.
Figure 6
Figure 6. NELF tentacles reach DSIF and RNA.
a. NELF-A tentacle. Residues 189-528 of NELF-A form a flexible tentacle that binds Pol II and DSIF. Lysine crosslinking sites are marked. b. NELF-E tentacle. Residues 139-363 of NELF-E form a flexible tentacle that extends over DSIF near exiting RNA. c. The NELF-A tentacle, but not the NELF-E tentacle, is required for pause stabilization. RNA extension assays performed as in Fig. 1. All experiments were performed at least three times. Quantification of gels can be found in Extended Data Fig. 1f.

Comment in

Similar articles

Cited by

References

    1. Shilatifard A, Conaway RC, Conaway JW. The RNA Polymerase II Elongation Complex. Annu Rev Biochem. 2003;72:693–715. - PubMed
    1. Bentley DL, Groudine M. A block to elongation is largely responsible for decreased transcription of c-myc in differentiated HL60 cells. Nature. 1986;321:702–706. - PubMed
    1. Kao S-Y, Calman AF, Luciw PA, Peterlin BM. Anti-termination of transcription within the long terminal repeat of HIV-1 by tat gene product. Nature. 1987;330:489–493. - PubMed
    1. Gilmour DS, Lis JT. RNA polymerase II interacts with the promoter region of the noninduced hsp70 gene in Drosophila melanogaster cells. Mol Cell Biol. 1986;6:3984–3989. - PMC - PubMed
    1. Strobl LJ, Eick D. Hold back of RNA polymerase II at the transcription start site mediates down-regulation of c-myc in vivo. EMBO J. 1992;11:3307. - PMC - PubMed

Publication types

MeSH terms