. 2018 Aug;560(7720):655-660.
doi: 10.1038/s41586-018-0444-0. Epub 2018 Aug 22.

RAP2 mediates mechanoresponses of the Hippo pathway

Affiliations

RAP2 mediates mechanoresponses of the Hippo pathway

Zhipeng Meng et al. Nature. 2018 Aug.

Abstract

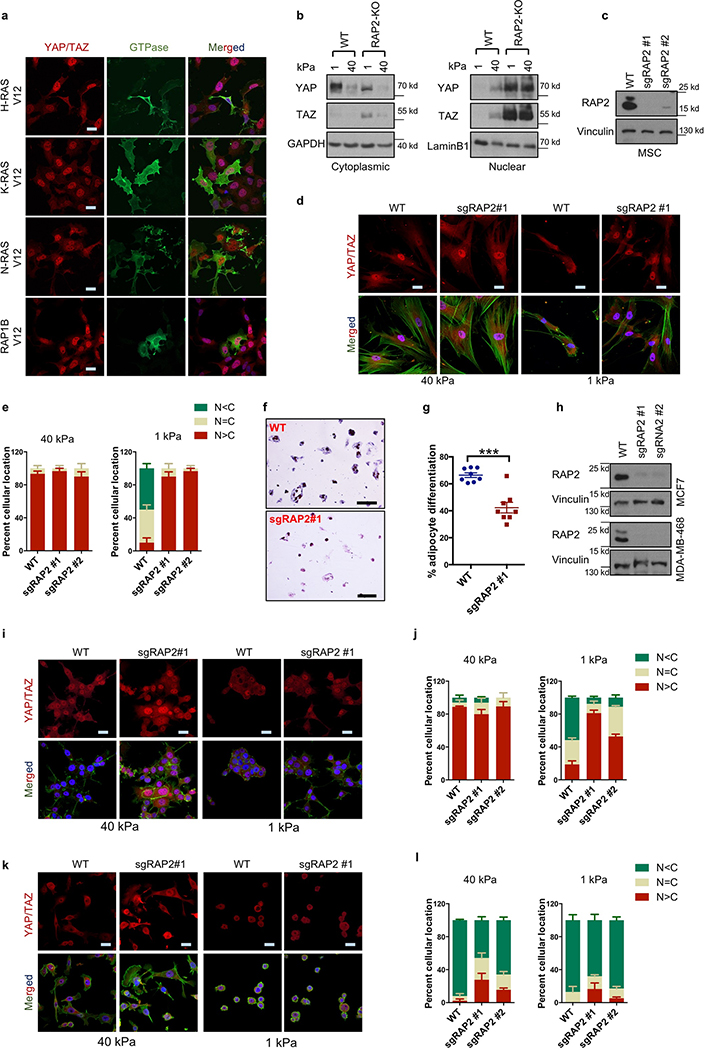
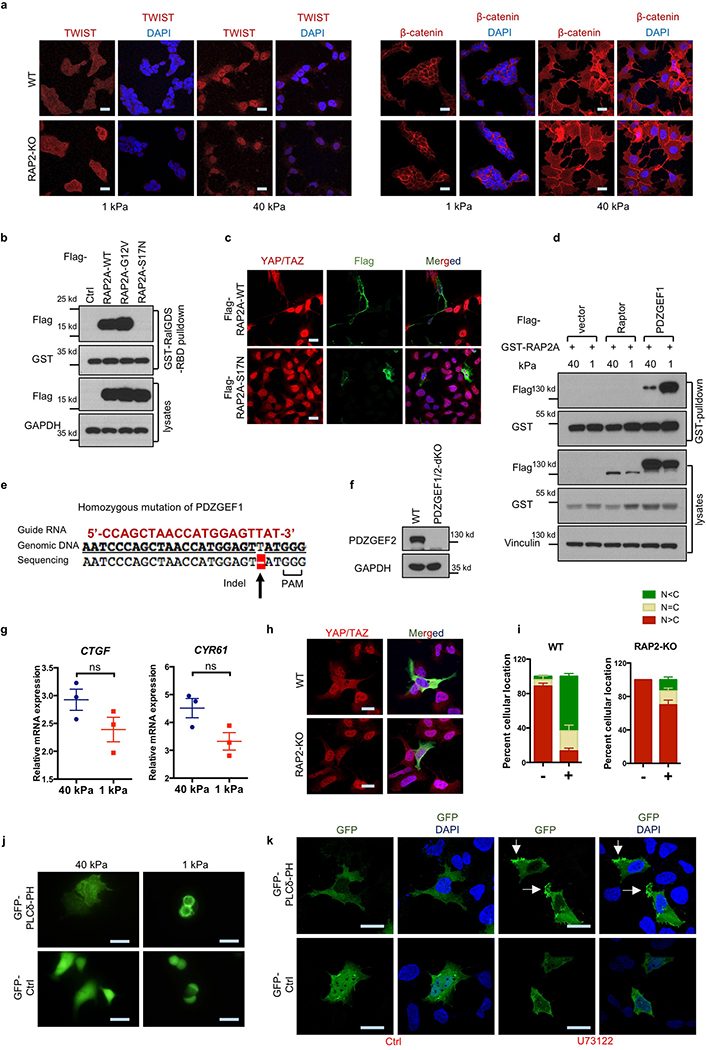
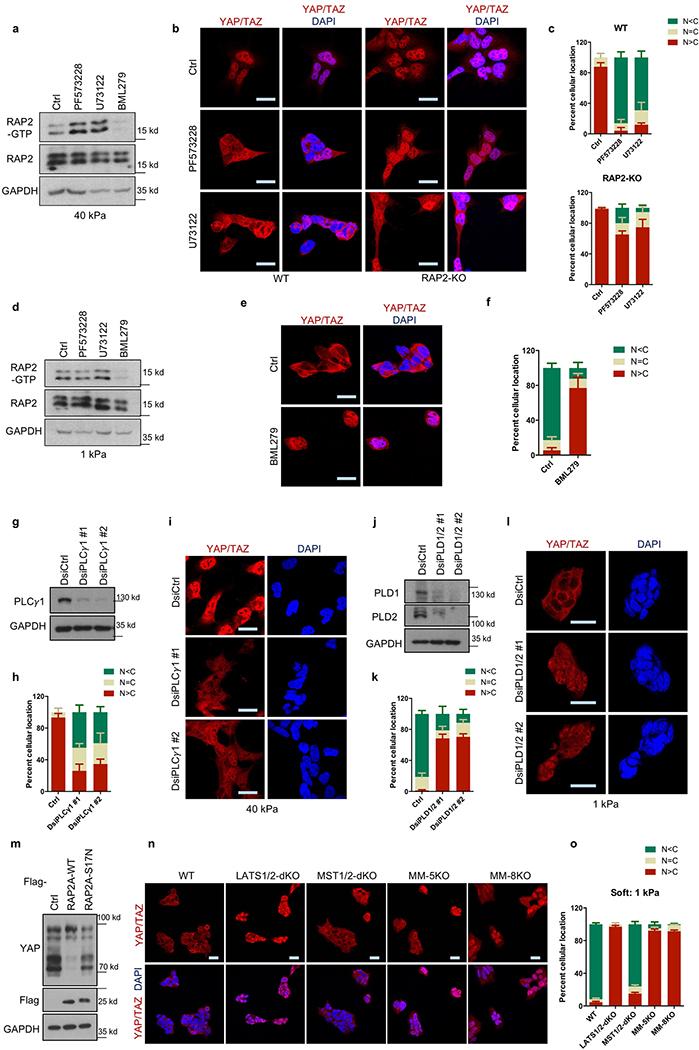
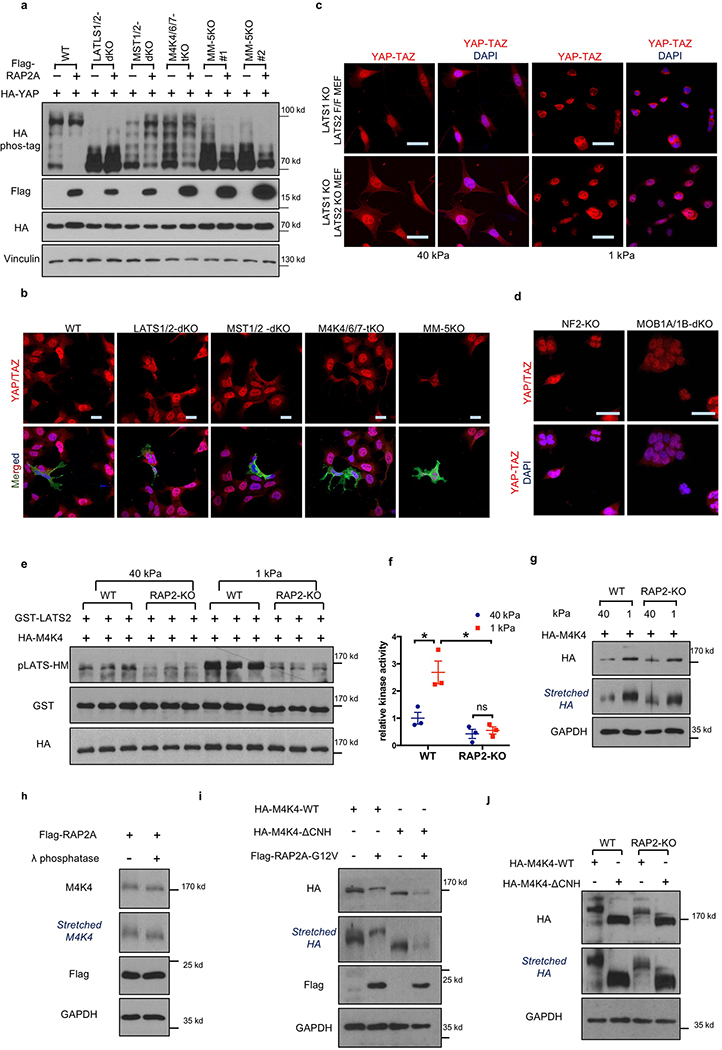
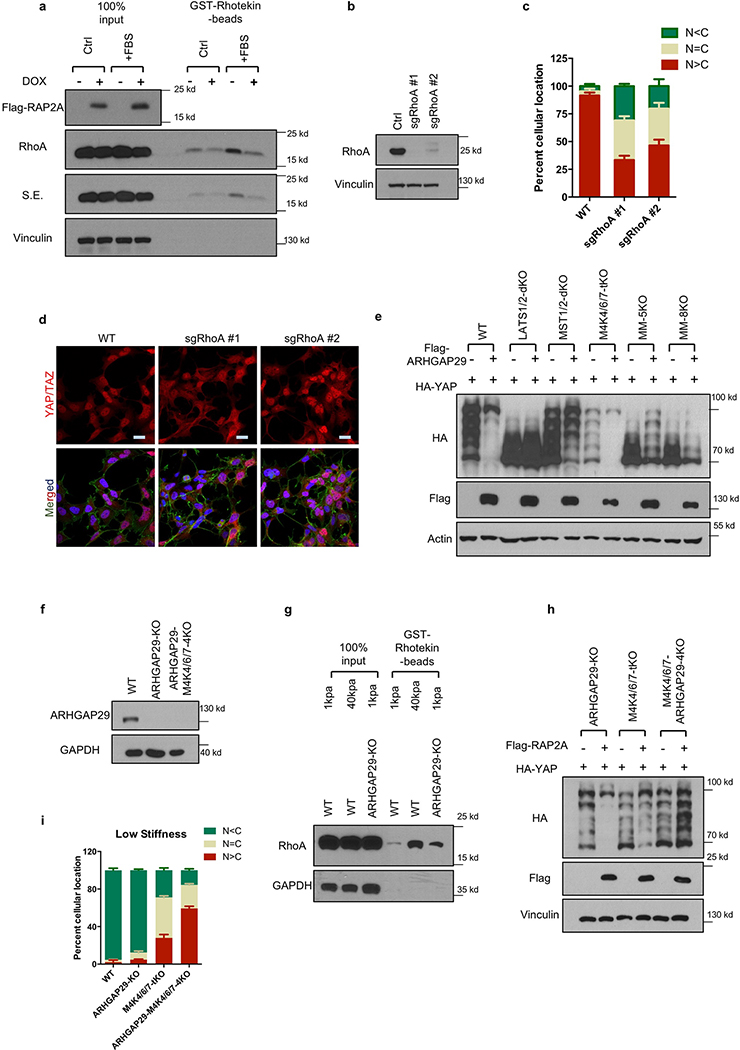
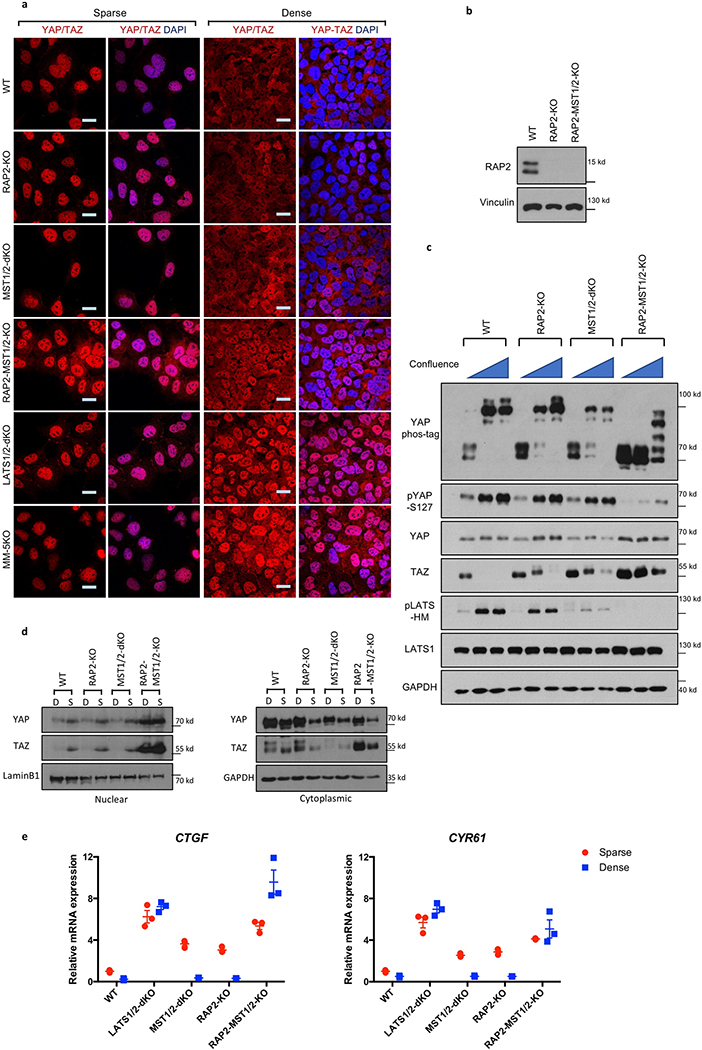
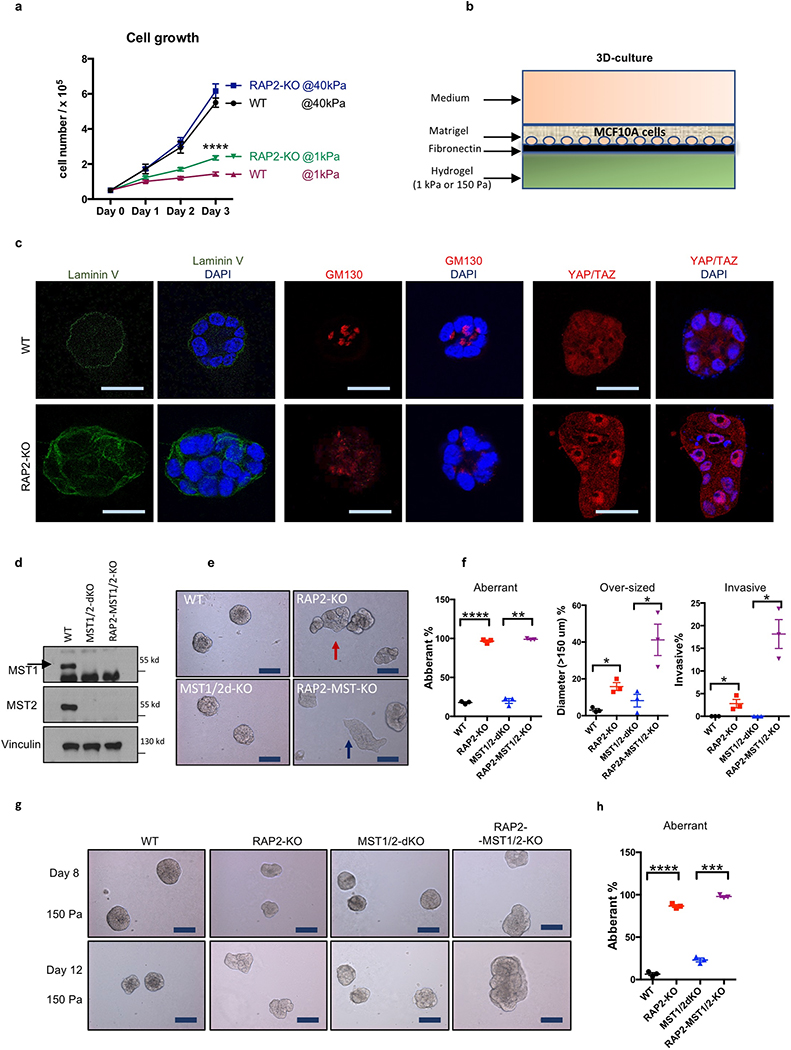
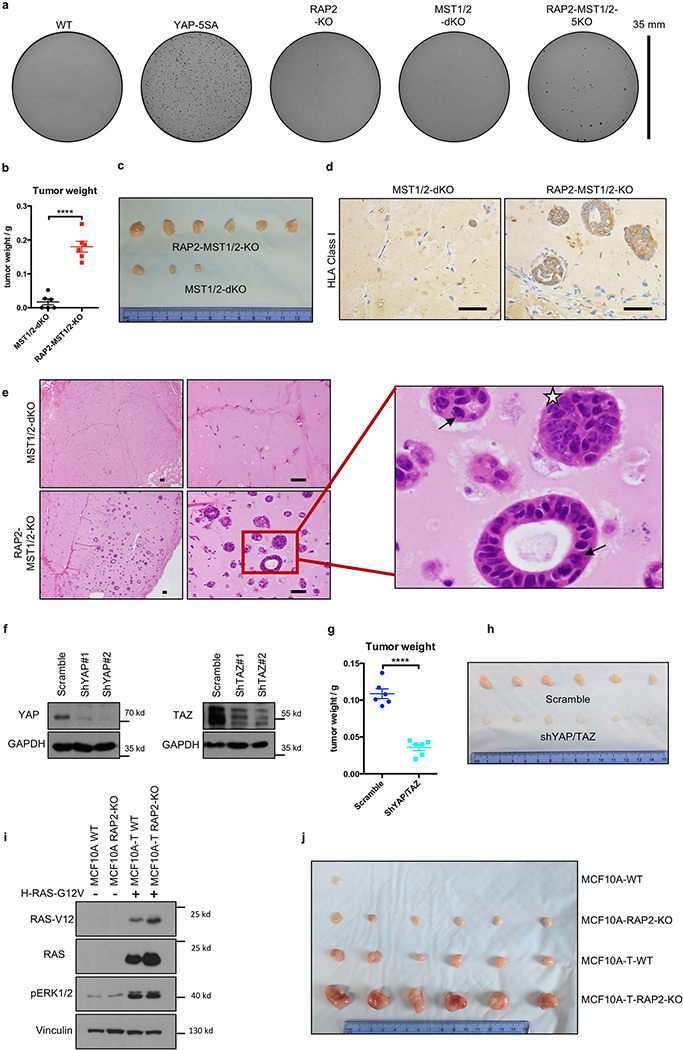
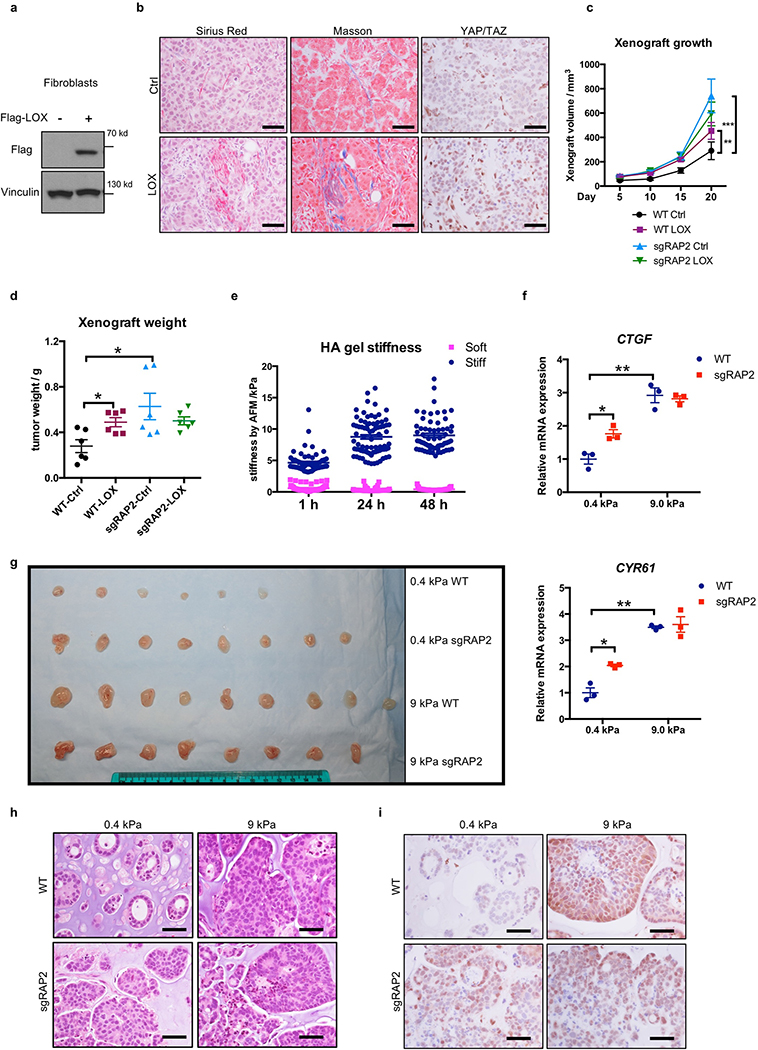
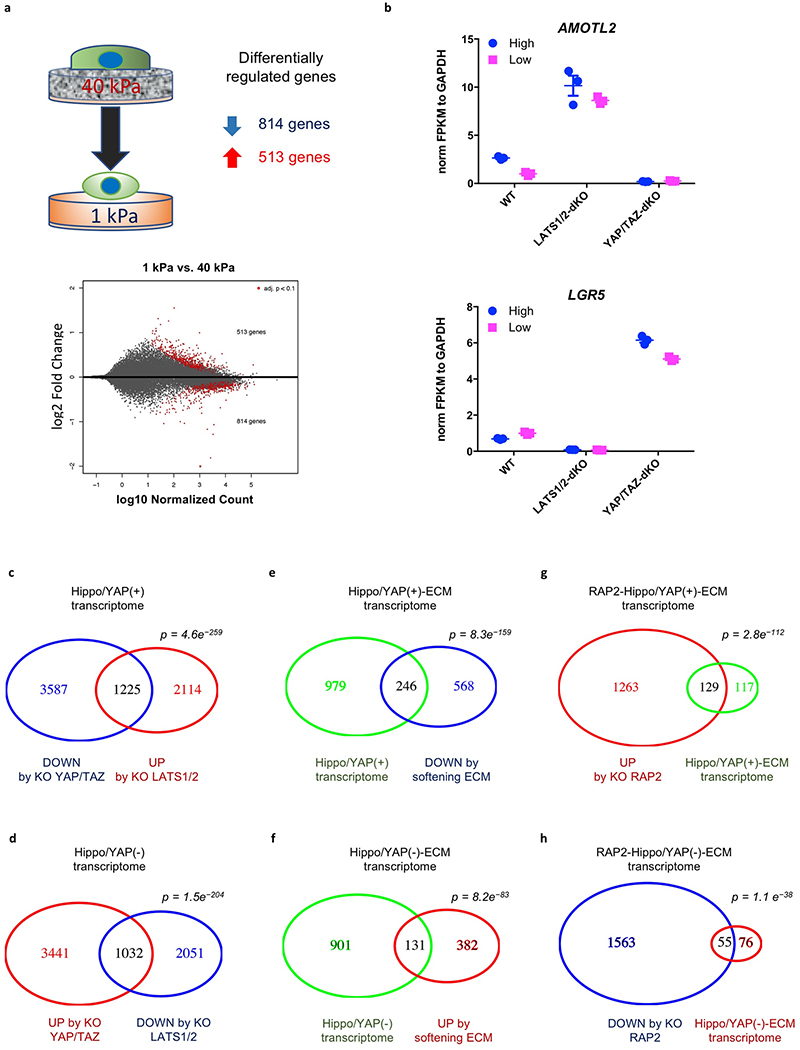
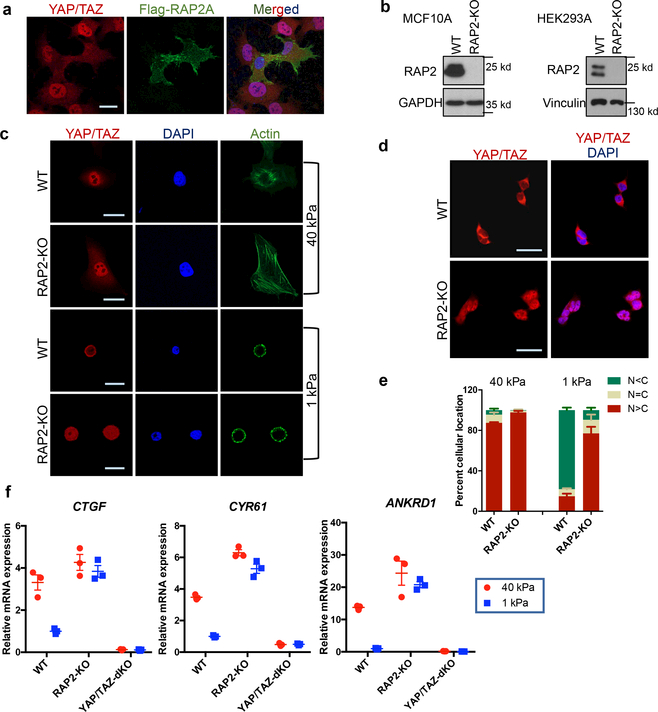
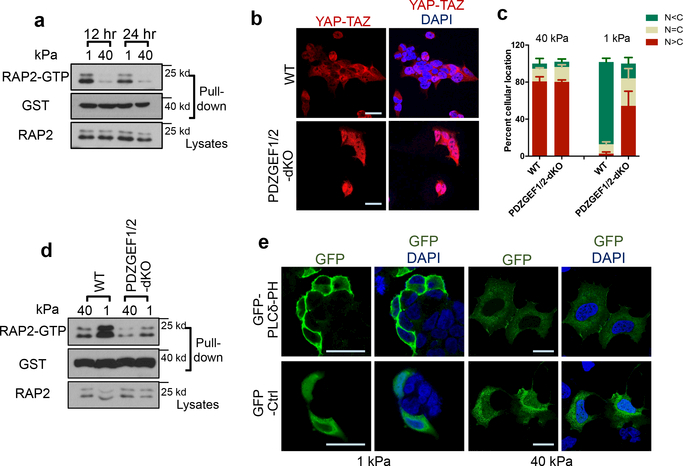
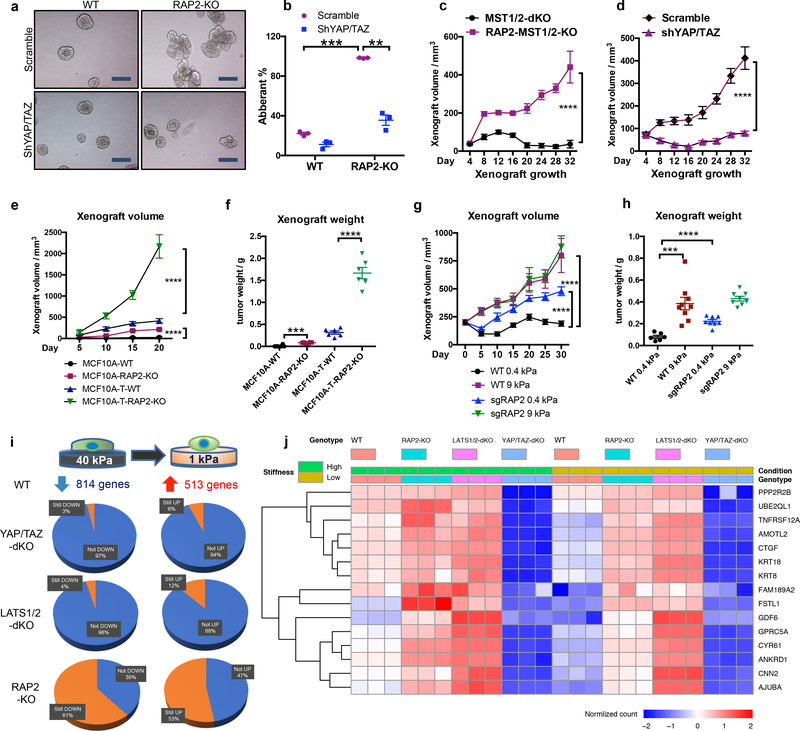
Mammalian cells are surrounded by neighbouring cells and extracellular matrix (ECM), which provide cells with structural support and mechanical cues that influence diverse biological processes1. The Hippo pathway effectors YAP (also known as YAP1) and TAZ (also known as WWTR1) are regulated by mechanical cues and mediate cellular responses to ECM stiffness2,3. Here we identified the Ras-related GTPase RAP2 as a key intracellular signal transducer that relays ECM rigidity signals to control mechanosensitive cellular activities through YAP and TAZ. RAP2 is activated by low ECM stiffness, and deletion of RAP2 blocks the regulation of YAP and TAZ by stiffness signals and promotes aberrant cell growth. Mechanistically, matrix stiffness acts through phospholipase Cγ1 (PLCγ1) to influence levels of phosphatidylinositol 4,5-bisphosphate and phosphatidic acid, which activates RAP2 through PDZGEF1 and PDZGEF2 (also known as RAPGEF2 and RAPGEF6). At low stiffness, active RAP2 binds to and stimulates MAP4K4, MAP4K6, MAP4K7 and ARHGAP29, resulting in activation of LATS1 and LATS2 and inhibition of YAP and TAZ. RAP2, YAP and TAZ have pivotal roles in mechanoregulated transcription, as deletion of YAP and TAZ abolishes the ECM stiffness-responsive transcriptome. Our findings show that RAP2 is a molecular switch in mechanotransduction, thereby defining a mechanosignalling pathway from ECM stiffness to the nucleus.


Conflict of interest statement

Competing interests

Dr. Kun-Liang Guan is a co-founder of Vivace Therapeutics.

Figures

Extended Data Figure 1.
Extended Data Figure 1.. RAP2 is involved in YAP/TAZ regulation by matrix stiffness.
a.YAP/TAZ localization is not significantly affected by H-, K-, N-RAS, or RAP1B overexpression. HEK293A cells were cultured on high stiffness hydrogels. Overexpression of HA-tagged H-RAS, K-RAS, N-RAS, and Flag-tagged RAP1B are indicated. Merged, combined signals of YAP/TAZ (red), transfected small GTPases (green), and DAPI (blue, staining for DNA). Scale bar, 25 μm. The images are representative of two independent experiments with similar results. b. Subcellular fractionation of WT and RAP2A/B/C-triple knock (RAP2-KO) HEK293A cells at low or high stiffness. The images are representative of two independent experiments with similar results. c. CRISPR-mediated RAP2A/B/C deletion in adipocyte-derived mesenchymal stem cells (MSCs) by lentiviral transduction. Single guide RNAs targeting RAP2A, RAP2B, and RAP2C (sgRAP2) were individually cloned into lentiCRISPR v2 (Addgene #52961) plasmids. sgRAP2 #1 and #2 were two sets of three single guide RNAs targeting RAP2A, RAP2B, and RAP2C with unique sequences for each RAP2 isoform. Adipocyte-derived MSCs were infected with the sgRAP2 lentiviruses with a MOI of 10 and selected by puromycin. After puromycin selection, the pooled cells were examined for the RAP2 protein expression. The images are representative of two independent experiments with similar results. d. RAP2 is required for the low stiffness-induced cytoplasmic localization of YAP/TAZ in MSCs. The MSCs with CRISPR-mediated RAP2A/B/C deletion were seeded on 40 kPa and 1 kPa collagen-coated hydrogels, cultured for 24 hours, and then stained for YAP/TAZ. The results are representative of 3 biologically independent samples showing similar results. Merged, combined signals of YAP/TAZ (red), F-actin (green), and DAPI (blue). Scale bar, 25 μm. e. The YAP/TAZ localization distribution is presented as mean+SEM for cells with more nuclear (N>C), more cytoplasmic (N
Extended Data Figure 2.
Extended Data Figure 2.. RAP2 is activated at low matrix stiffness involving PDZGEF1/2.
a. RAP2 has no effect on localization of TWIST and β-catenin at different matrix rigidities. Immunofluorescence staining of TWIST and β-catenin in WT and RAP2-KO HEK293A cells grown on soft (1 kPa) and stiff (40 kPa) fibronectin-coated hydrogels. Low stiffness induced cytoplasmic localization of TWIST similarly in WT and RAP2-KO cells. Stiffness had no significant effect on β-catenin localization in HEK293A cells. Scale bar, 25 μm. The images are representative of 3 independent experiments with similar results. b. GST-RalGDS-RBD specifically binds to the active RAP2A in the pulldown assay. HEK293A cells were transfected with plasmids expressing RAP2A WT, G12V mutant (constitutively GTP-binding), or S17N mutant (GTP-binding deficient) and then seeded onto soft hydrogels. The cells were lysed 24 hours after seeding and the lysates were incubated with glutathione agarose beads that were pre-loaded with GST-RalGDS-RBD. The beads were washed and subjected to Western blot analyses with the indicated antibodies. The images are representative of 2 independent experiments with similar results. c. GTP-binding/activity of RAP2A is required to induce YAP/TAZ cytoplasmic translocation. Merged, combined signals from YAP/TAZ (red), Flag (green), and DAPI (blue). Scale bar, 25 μm. The images are representative of 2 independent experiments with similar results. d. ECM stiffness regulates the interaction between RAP2A and PDZGEF1. GST-RAP2A plasmids were co-transfected with Flag-Raptor (a negative control) or Flag-PDZGEF1 into HEK293A cells. The cells were thereafter seeded on stiff and soft hydrogels. 24 hours after seeding, the cells were lysed and the lysates were incubated with glutathione agarose beads for 6 hours. Then the beads were washed and subjected to Western blot analyses. The images are representative of 2 independent experiments with similar results. e. Sanger DNA sequencing confirmed the homozygous deletion of a ‘T’ nucleotide in PDZGEF1 genomic DNAs in the PDZGEF1/2-dKO HEK293A cells. f. Western blot showing the absence of PDZGEF2 expression in PDZGEF1/2-dKO HEK293A cells. The images are representative of 2 independent experiments with similar results. g. The repression on YAP/TAZ target genes CTGF and CYR61 by low stiffness was compromised in PDZGEF1/2-dKO cells. Expression of CTGF and CYR61 in PDZGEF1/2-dKO HEK293A cells on soft and stiff matrices was measured by quantitative Real-time PCR. ns, not significant, two-tailed t-test, n=3 biological independent samples. Data are represented as mean±SEM. h. RAP2 is required for PDZGEF1 to induce cytoplasmic localization of YAP/TAZ. Immunofluorescence showing YAP/TAZ localization after ectopic expression of a Flag-tagged PDZGEF1 in WT and RAP2-KO cells at high stiffness. Merged, combined signals from Flag-PDZGEF1 (green), YAP/TAZ (red), and DAPI (blue). Scale bar, 25 μm. i. Quantification of the results in Panel h. ‘+’ denotes the Flag-PDZGEF1-transfected cells and ‘−’ denotes cells that were not transfected. Data are represented as mean+SEM. n=3 biologically independent samples. j. Stiffness influences cellular PIP2. The PIP2 reporter GFP-PLCδ-PH domain, which binds to PIP2, was imaged with a Nikon inverted microscope in cells at low or high stiffness. Cells grown at high stiffness display diffused PIP2 localizations while cells at low stiffness show enrichment of PIP2 at the plasma membrane. The image represents 2 independent experiments with similar results. Scale bar, 25 μm. k. Inhibition of PLC alters cellular PIP2 distribution. Immunofluorescence of cells treated with 5 μM PLC inhibitor U73122 at high stiffness. GFP was detected with anti-GFP immunofluorescence. PIP2 enrichment, indicated by arrows, was observed. Scale bar, 25 μm. The image represents 2 independent experiments with similar results.
Extended Data Figure 3.
Extended Data Figure 3.. FAK, PLC𝛾1, and PLD1/2 are involved in RAP2 activation and Hippo pathway activation in response to stiffness.
a. FAK inhibitor PF573228 and PLC inhibitor U73122 promote RAP2-GTP loading at high stiffness. The images represent two biologically independent experiments with similar results. b. RAP2 functions downstream of FAK and PLC to regulate YAP/TAZ localization. YAP/TAZ localization was imaged in cells cultured at high stiffness and treated with 10 μM FAK inhibitor PF573228 or 5 μM PLC inhibitor U73122. Scale bar, 25 μm. The image represents 3 (WT treated with PF573228 or U73122; RAP2-KO ctrl) or 4 (WT ctrl; RAP2-KO treated with PF573228 or U73122) biologically independent samples with similar results. c. The localization distribution in Panel b is presented as mean+SEM. n=3 (WT treated with PF573228 or U73122; RAP2-KO ctrl) or 4 (WT ctrl; RAP2-KO treated with PF573228 or U73122) biologically independent samples. d. PLD1/2 inhibitor BML279 suppresses RAP2-GTP binding at low stiffness. The images represent two independent experiments with similar results. e. Inhibition of PLD increases nuclear YAP/TAZ in cells at low stiffness. Cells growing at low stiffness were treated with 5 μM PLD inhibitor BML279. Scale bar, 25 μm. The image represents 7 (ctrl) or 5 (BM279) biologically independent samples with similar results. f. The localization distribution in Panel e is presented as mean+SEM. n=7 (ctrl) or 5 (BML279) biologically independent samples. g. Western blot showing PLC𝛾1 knockdown by Duplex siRNAs (DsiRNAs). Two independent siRNAs were used. The image represents 2 independent experiments with similar results. h. PLC𝛾1 knockdown decreases nuclear YAP/TAZ at high stiffness. Quantification of YAP/TAZ localization in PLC𝛾1 knockdown and control cells growing on 40 kPa hydrogels. The YAP/TAZ localization distribution is presented as mean+SEM. n=3 biologically independent samples. i. Representative images of YAP/TAZ localization in cells with PLC𝛾1 knockdown. Scale bar, 25 μm. The image represents 3 biologically independent experiments with similar results. j. Western blot showing PLD1/2 knockdown. Two independent DsiRNAs were used. The image represents 2 independent experiments with similar results. k. PLD1/2 knockdown increases nuclear YAP/TAZ at low stiffness. Quantification of YAP/TAZ localization in PLD1/2 knockdown and control cells growing on 1 kPa hydrogels. The YAP/TAZ localization distribution is presented as mean+SEM. The results are from 3 biologically independent samples. l. Representative images of YAP/TAZ localization in cells with PLD1/2 knockdown. Scale bar, 25 μm. The image represents 3 biologically independent experiments with similar results. m. WT, but not the GTP binding-deficient (S17N), RAP2A induces YAP phosphorylation. YAP phosphorylation was analyzed by phos-tag SDS-PAGE in HEK293A cells stably expressing WT or the S17N mutant RAP2A at high stiffness. The image represents 2 independent experiments with similar results. n. Hippo pathway components are involved in YAP/TAZ regulation by stiffness. HEK293A cell lines with deletion of Hippo components were cultured at low stiffness (1 kPa). Deletion of Hippo components includes LATS1/2, MST1/2, MM-5KO (MST1/2-MAP4K4/6/7–5KO), and MM-8KO (MST1/2-MAP4K1/2/3/4/6/7–8KO). The image represents 3 biologically independent experiments with similar results. Scale bar, 25 μm. o. Quantification of immunofluorescence of the samples in Panel n. The YAP/TAZ localization distribution is presented as mean+SEM. n=3 biologically independent samples.
Extended Data Figure 4.
Extended Data Figure 4.. RAP2 activates MAP4K4 and induces YAP phosphorylation.
a. Hippo pathway components are required for RAP2A to induce YAP/TAZ phosphorylation. RAP2A is overexpressed in the indicated knockout HEK293A cells. The Western images represent 2 independent experiments with similar results. Two clones of MM-5KO cells were used for this experiment. b. RAP2A acts through the Hippo pathway to induce YAP/TAZ cytoplasmic localization. Flag-RAP2A was transfected into HEK293A cell lines with deletion of different core Hippo pathway components as indicated. YAP/TAZ localization was analyzed by immunofluorescence. Merged, combined signals from Flag-RAP2A (green), YAP/TAZ (red), and DAPI (blue). Scale bar, 25 μm. The image represents 3 biologically independent experiments with similar results. c. YAP/TAZ localization in LATS1−/− LATS2 Flox/Flox (LATS1-KO LATS2-F/F) and LATS1−/− LATS2−/− (LATS1/2-dKO) MEFs. Scale bar, 25 μm. The image represents 2 biologically independent experiments with similar results. d. YAP/TAZ localization in NF2-KO and MOB1A/1B-dKO HEK293A cells. Scale bar, 25 μm. The image represents 2 biologically independent experiments with similar results. e. Low matrix stiffness activates MAP4K4 in a RAP2-dependent manner. Plasmids expressing HA-tagged MAP4K4 were transfected into WT and RAP2-KO HEK293A cells. 24 hours after seeding on 40 kPa or 1 kPa hydrogels, HA-MAP4K4 proteins were immuno-precipitated and then used for in vitro kinase assay, in which recombinant full-length GST-tagged LATS2 protein was used as a substrate. The LATS2 phosphorylation by MAP4K4 was detected by an a phospho-specific antibody recognizing the phosphorylated hydrophobic motif of LATS1/2. Results were from triplicated experiments that were biologically independent. f. Quantification of the kinase assay (in Panel e) shown as mean±SEM. The relative LATS2 phosphorylation was normalized by the protein levels of HA-MAP4K4 and defined as MAP4K4 kinase activity. *, n=3 biologically independent samples, two-tailed t-test, p = 0.027 (WT-1 kPa vs. RAP2 KO-1 kPa) or 0.037 (WT-1 kPa vs. WT-40 kPa); ns, not significant. g. The lysates of WT and RAP2-KO HEK293A cells growing on stiff and soft hydrogels were analyzed by Western blot for MAP4K4 migration. ‘Stretched’ image was generated by vertically extending the same Western image directly above it in order to better visualize the MAP4K4 mobility shift. The image represents 2 independent experiments with similar results. h. Phosphatase treatment increases MAP4K4 migration on SDS-PAGE. Lambda phosphatase was used to treat cell lysates of RAP2A-expressing HEK293A cells. Then the cell lysates were analyzed by Western blot. These results indicated that the altered migration of MAP4K4 was correlated with its phosphorylation. The image represents 2 independent experiments with similar results. i. RAP2A promotes MAP4K4 phosphorylation (slower band migration) dependent on its citron domain. Flag-RAP2A-G12V plasmid was co-transfected with MAP4K4 WT or the citron domain deletion mutant (ΔCNH) into HEK293A cells. The image represents 2 independent experiments with similar results. j. RAP2 is required for the reduced MAP4K4 mobility. WT and citron domain deletion mutant of MAP4K4 were transfected into WT and RAP2-KO HEK293A cells. The image represents 2 independent experiments with similar results.
Extended Data Figure 5.
Extended Data Figure 5.. RAP2 inhibits RhoA GTPase through ARHGAP29.
a. RAP2A expression inhibits endogenous RhoA GTP-binding. HEK293A cells with doxycycline-inducible expression of RAP2A were established and the expression of Flag-RAP2A was induced by doxycycline. RhoA activity was determined by a GST-Rhotekin-RBD pulldown assay. S.E. denotes a short exposure of the RhoA Western blot. The image represents 2 independent experiments with similar results. b. Western blot confirms CRISPR-mediated RhoA gene editing. HEK293A cells were transfected with CRISPR plasmids targeting RhoA and selected with puromycin for 3 days. Two different guide RNAs were used to generate two RhoA knockout pools (sgRhoA #1 and #2). The image represents 2 independent experiments with similar results. c. CRISPR-mediated deletion of RhoA leads to increased cytoplasmic localization of YAP/TAZ in HEK293A at high stiffness. The localization distribution is presented as mean+SEM. n=6 biologically independent samples. d. Representative immunofluorescence images for Panel c. Scale bar, 25 μm. e. ARHGAP29 induces YAP phosphorylation in a Hippo pathway-dependent manner. MM-5KO, a HEK293A clone with deletion of MST1/2-MAP4K4/6/7 genes. MM-8KO, deletion of MST1/2-MAP4K1/2/3/4/6/7 genes. YAP phosphorylation was detected by phos-tag gels. The image represents two independent experiments with similar results. f. Immunoblot showing deletion of ARHGAP29 in HEK293A WT and MAP4K4/6/7-tKO cells. The image represents 2 independent experiments with similar results. g. Deletion of ARHGAP29 compromises Rho inhibition by low matrix stiffness. WT and ARHGAP29-KO HEK293A cells were cultured at indicated stiffness and then assayed for RhoA activity with GST-Rhotekin-RBD binding assay. The image represents two independent experiments with similar results. h. Combined deletion of ARHGAP29 and MAP4K4/6/7 abolishes YAP phosphorylation induced by RAP2A. HA-YAP was co-transfected with vector or Flag-RAP2A into HEK293A cells cultured at high stiffness. HA-YAP phosphorylation was detected by phos-tag SDS PAGE. The image represents 2 independent experiments with similar results. i. Combined deletion of ARHGAP29 and MAP4K4/6/7 blocks low stiffness-induced YAP cytoplasmic localization. Quantification of YAP/TAZ localization in HEK293A cells with deletion of ARHGAP29 and/or MAP4K4/6/7 at low stiffness in Fig. 3e. The YAP/TAZ localization distribution is presented as mean+SEM. n=3 biologically independent samples.
Extended Data Figure 6.
Extended Data Figure 6.. RAP2 contributes to cell density-induced YAP/TAZ inactivation.
a. YAP/TAZ cytoplasmic translocation caused by cell contact involves RAP2 and the Hippo pathway. Scale bar, 25 μm. MM-5KO is a HEK293 cell line with deletion of MST1/2-MAP4K4/6/7 five genes. RAP2-MST-KO denotes the cell line with deletion of RAP2A/B/C-MST1/2 five genes. The image represents 3 biologically independent experiments with similar results. b. Western blot showing absence of RAP2 proteins in RAP2-KO and RAP2-MST1/2-KO cells. Note that part of the results is shown in Fig. 1b and are from the same experiment. The image represents 2 independent experiments with similar results. c. YAP/TAZ phosphorylation induced by cell contact requires RAP2 and MST1/2. The Western blot shows YAP phosphorylation of cells with low, medium, or high confluences. The image represents 2 independent experiments with similar results. d. Deletions of RAP2A/B/C and MST1/2 interfere with YAP/TAZ regulation by cell density. Subcellular fractionations were performed for WT, RAP2-KO, MST1/2-dKO, RAP2-MST1/2-KO HEK293A cells cultured at low (S, sparse) or high density (D, dense). GAPDH and LaminB1 are markers for cytoplasmic and nuclear fraction, respectively. The image represents 2 independent experiments with similar results. e. RAP2A/B/C and MST1/2 are required for YAP/TAZ target gene regulation by cell density. Quantitative RT-PCR was performed to determine the expression of YAP/TAZ target genes CTGF and CYR61 of the above cells at low or high confluence. Data are represented as mean±SEM. n=3 biologically independent samples.
Extended Data Figure 7.
Extended Data Figure 7.. RAP2 prevents aberrant acinus growth of MCF10A cells on soft matrices.
a. RAP2 deletion selectively enhances HEK293A cell growth on soft matrix. WT and RAP2-KO HEK293A cells were seeded on stiff or soft matrices, and cell numbers were recorded as mean± SEM every day. ****, two-way ANOVA test, p < 0.0001, WT vs. RAP2-KO cells cultured at 1 kPa, n=3 biologically independent samples. b. Diagram showing the model of 3-D culture of MCF10A cells. c. RAP2 deletion causes abnormal acinus growth and cell polarity defects in MCF10A cells. Immunofluorescence staining of acini for cell polarity markers, Laminin V and GM130, and YAP/TAZ in WT and RAP2-KO MCF10A cells cultured for 6 days were shown. Scale bar, 25 μm. The images represent 3 independent experiments with similar results. d. Western blot showing deletion of MST1/2 genes in WT and RAP2-KO cells. The arrow indicates the specific band for MST1. The image represents 2 independent experiments with similar results. e. Representative images showing acinus formation of various genetically engineered MCF10A cells at 1 kPa. Red arrows indicate aberrant acini. Blue arrows indicate invasive cell morphology. Scale bar, 100 μm. The results are representative of two independent experiments with similar results. f. Quantification of aberrant, oversized, and invasive acini in Panel e. The percentage of the cells is presented as mean±SEM. Two-tailed t-tests were used for statistical analyses of aberrant and oversized clones in n=3 biologically independent samples. Aberrant: ****, p=0.0000062; ***, p= 0.0012; Over-sized: *, p= 0.017 (for WT vs. RAP2-KO) or 0.046 (for MST1/2-dKO vs. RAP2-MST1/2-KO). For analysis of invasive clones, one-tailed t-test was used as no invasive clones were observed in either WT or MST1/2-dKO cells. *, p = 0.047 (for WT vs. RAP2-KO) or 0.029 (for MST1/2-dKO vs. RAP2-MST1/2-KO). n=3 biologically independent samples. g. Representative images showing acinus formation of various genetically engineered MCF10A cells at 150 Pa. Scale bar, 100 μm. The image represents 2 biologically independent experiments with similar results. h. Quantification of aberrant acini in Panel g. The results are from 3 biologically independent samples. Two-tailed t-tests were used for statistical analyses of aberrant clones in n=3 biologically independent samples. ****, p = 0.000045; ***, 0.00011.
Extended Data Figure 8.
Extended Data Figure 8.. RAP2 deletion contributes to aberrant acinus growth and tumorigenesis of MCF10A cells in a YAP/TAZ-dependent manner.
a. Representative images showing soft-agar assays of MCF10A cells. Overexpression of the constitutively active YAP-5SA (mutation of all the five LATS1/2 phosphorylation serines to alanines in YAP) strongly promotes anchorage-independent growth. Combined deletion of RAP2 and MST1/2, but not either group alone, also causes anchorage-independent growth of MCF10A cells. The image represents 3 biologically independent experiments with similar results. Scale bar, 35 mm. b. RAP2 inhibits tumorigenicity of MST1/2-dKO MCF10A cells. MST1/2-dKO and RAP2-MST1/2-KO MCF10A were injected into NOD/SCID mice for tumor growth. Tumor weight on Day 32 after injection is presented as mean±SEM. ****, n=6 biologically independent xenografts, p = 0.000025. A two-tailed t-test was performed. c. An image showing the tumor size. Only 3 very small xenografts were recovered from the initial 6 s.c. injections for MST1/2-dKO cells. The image represents 6 biologically independent xenografts for each group that were initially made in the NOD/SCID mice. d. Immunohistochemistry staining with an antibody recognizing human HLA Class I. The results showed that only the acinus structures in the xenografts were formed by MCF10A cells. The stroma cells negative for HLA Class I were derived from the host mice. The image represents 2 biologically independent experiments with similar results. Scale bar, 50 μm. e. Hematoxylin & eosin staining of the xenografts from the MST1/2-dKO MCF10A cells revealed that largely hypocellular connective tissue was observed as stroma from the host animals. In contrast, RAP2-MST1/2-KO xenografts showed MCF10A cell-derived acinus and duct structures exhibiting nuclear polymorphisms, irregular nuclear contour, hyperchromasia, prominent nucleoli (noted by the star in the image), and pathological mitosis (noted by the arrows in the image). The image represents 2 biologically independent experiments with similar results. Scale bar, 50 μm. f. Western blot showing knockdown of YAP or TAZ by lentiviral shRNAs in the RAP2-MST1/2-KO MCF10A cells. shYAP#2 and shTAZ#1 were used for the xenograft studies. The image represents 2 independent experiments with similar results. g. Knockdown of YAP/TAZ inhibits tumor growth of RAP2-MST1/2-KO MCF10A cells. Tumor weight on Day 32 is presented as mean±SEM. ****, a two-tailed t-test was performed, n=6, p = 0.000010. h. The image of the xenografts in NOD/SCID mice, in which 6 biologically independent xenografts were generated for each group. i. Western blot showing the expression of H-Ras-G12V mutant in MCF10A-T cells, which were generated by expression of the oncogenic mutant H-RAS. H-RAS expression activates ERK whereas RAP2 deletion has no effect on ERK. The comparable phosphorylation levels of ERK1/2 in WT and RAP2-KO MCF10A-T cells indicate that the difference in xenograft growth was not due to difference in ERK1/2 activity. The image represents two independent experiments with similar results. j. The image of the MCF10A and MCF10A-T xenografts in nude mice, in which 6 biologically independent xenografts were generated for each group and yielded similar results.
Extended Data Figure 9.
Extended Data Figure 9.. RAP2 deletion selectively promotes MCF7 malignancy at low stiffness in vivo.
a. Western blot showing the LOX overexpression in NIH3T3 fibroblasts. Ectopic LOX expression is known to promote cross-linking of ECM proteins and thus increase matrix stiffness. The image represents 2 independent experiments with similar results. b. RAP2 is involved in the xenograft growth enhancement caused by LOX-overexpressing fibroblasts. Xenografts were generated with co-injection of 0.4 × 10⁶ fibroblasts (control and Flag-LOX-overexpressing) and 2.0 × 10⁶ MCF7 cells. The xenografts were harvested on Day 6 and then were examined for collagen deposition and crosslinking and YAP/TAZ localization. LOX overexpression led to a woven-like structure of collagens in the xenografts based on the Sirius Red staining (red color for collagens) and Masson staining (blue color for collagens), and increased nuclear YAP/TAZ proteins. The image represents 3 biologically independent experiments with similar results. Scale bar, 50 μm. c. LOX-induced tumor growth requires RAP2. Xenografts were generated with co-injection of 0.4 × 10⁶ NIH3T3 and 2.0 × 10⁶ MCF7 cells. The growth of the xenografts with different combinations of NIH3T3 and MCF7 cells was measured and shown as mean±SEM. RAP2A/B/C deletion promoted MCF7 tumor growth as well as masked the enhancement effects by the co-injected LOX expressing fibroblasts. **, two-way ANOVA test, (WT MCF7 + WT NIH3T3) cells vs (WT MCF7 +LOX-overexpressing NIH3T3) cells, n=6 biologically independent samples, p < 0.0027. ***, two-way ANOVA test, (sgRAP2 MCF7 + WT NIH3T3) cells vs (WT MCF7 + WT NIH3T3) cells, n=6 biologically independent samples, p = 0.002. d. The tumor weights were shown as mean±SEM. *, two-tailed t-test, n=6 biologically independent xenografts, p=0.014 for (WT MCF7 + WT NIH3T3) cells vs (WT MCF7 +LOX-overexpressing NIH3T3) cells, or 0.029 (sgRAP2 MCF7 + WT NIH3T3) cells vs (WT MCF7 + WT NIH3T3) cells. e. The elasticity/stiffness of the ‘soft’ and the ‘stiff’ semi-synthetic hyaluronan (HA)-derived gels was measured by atomic force microscopy. The results are presented as mean±SEM. The measurements were made for >55 times for each stiffness at each different time. f. RAP2 inhibits expression of YAP/TAZ target gene CTGF and CYR61 at low stiffness, but not at high stiffness. Quantitative real-time PCR analyses of YAP/TAZ target genes CTGF and CYR61 in WT and sgRAP2 MCF7 cells (as in Extended Data Fig. 1g) cultured in vitro for 48 hours in the soft or the stiff HA gels. The relative mRNA levels are presented as mean±SEM. n=3 biologically independent samples. Two-tailed t-test was used for analyses. For CTGF, *, sgRAP2 vs. WT at 0.4 kPa, p=0.020; **, 0.4 kPa vs. 9.0 kPa for WT, p=0.0032. For CYR61, *, sgRAP2 vs. WT, p=0.025; **, 0.4 kPa vs. 9.0 kPa for WT, p=0.0033. g. The image of the xenograft tumors. For the WT cells at 0.4 kPa, 8 independent xenografts were initially generated in nude mice. However, due to the animal deaths, only 6 xenografts were recovered. For WT cells at 9 kPa, 9 independent xenografts were generated. For sgRAP2 cells at both 0.4 kPa and 9 kPa, 8 independent xenografts were generated. h. RAP2 deletion preferentially promotes MCF7 malignancy at low stiffness. The HE staining of the MCF7 xenografts. WT cells embedded in 0.4 kPa matrix produced mostly tubular and some cribriform structures while those embedded in 9 kPa matrix produced mostly solid nests, as well as more marked cellular pleomorphism and nuclear atypia. sgRAP2 cells already showed more malignant architecture and morphology at 0.4 ka, while at high stiffness (9 kPa) sgRAP2 and WT cells exhibited similar morphology. The image represents 3 biologically independent experiments with similar results. Scale bar, 50 μm. i. Immunohistochemistry for YAP/TAZ in the xenografts. RAP2 deletion increased nuclear YAP/TAZ. The image represents 3 biologically independent experiments with similar results. Scale bar, 50 μm.
Extended Data Figure 10.
Extended Data Figure 10.. RAP2 mediates regulation of ECM stiffness transcriptome by Hippo pathway.
a. MA-plot of WT cells in low stiffness vs. WT in high stiffness. Three biologically independent samples were assayed for each condition. Differentially expressed genes (adjusted p-value <0.1) are colored in red. P values for deferential expression were derived using Wald test and corrected using the procedure of Benjamini and Hochberg with default functions in DESeq2. b. Dot plot showing expression level of AMOTL2 and LGR5. AMOTL2 and LGR5 are YAP/TAZ-dependent and stiffness-regulated genes. High and low denote high stiffness (40 kPa) and low stiffness (1 kPa). Data are presented as mean±SEM. n=3 biologically independent samples. c. Venn diagram comparing down-regulated genes by YAP/TAZ knockout at high stiffness and up-regulated genes by LATS1/2 knockout at low stiffness. P-value: hypergenometric test. The result represents analyses of 3 biological replicates for each condition. d. Venn diagram comparing up-regulated genes by YAP/TAZ knockout at high stiffness and down-regulated genes by LATS1/2 knockout at low stiffness. P-value: hypergeometric test. The result represents analyses of 3 biological replicates for each condition. e. Venn diagram comparing overlapped genes in Panel c and down-regulated genes by low stiffness. P-value: hypergenometric test. The result represents analyses of 3 biological replicates for each condition. f. Venn diagram comparing overlapped genes in Panel d and up-regulated genes by low stiffness. P-value: hypergeometric test. The result represents analyses of 3 biological replicates for each condition. g. Venn diagram comparing overlapped genes in Panel e and up-regulated genes by RAP2 knockout at low stiffness. P-value: hypergenometric test. The result represents analyses of 3 biological replicates for each condition. h. Venn diagram comparing overlapped genes in Panel f and down-regulated genes by RAP2 knockout at low stiffness. P-value: hypergeometric test. The result represents analyses of 3 biological replicates for each condition.
Figure 1|
Figure 1|. RAP2 mediates YAP/TAZ regulation by ECM stiffness.
a. Overexpression of Flag-RAP2A induces YAP/TAZ cytoplasmic translocation in HEK293A cells on a stiff (40 kPa) matrix. Merged, combined signals from YAP/TAZ (red), Flag (green), and DAPI (blue). b. Immunoblot showing RAP2A/B/C deletion (RAP2-KO) in MCF10A and HEK293A cells. c. Immunofluorescence showing that RAP2-KO MCF10A cells, unlike WT cells, retain nuclear YAP/TAZ at low stiffness (1 kPa). The experiments in Panel b,c were repeated independently twice with similar results. d. RAP2A/B/C deletion in HEK293A cells blocks YAP/TAZ cytoplasmic localization by low stiffness. e. Quantification of YAP/TAZ localization, presented as mean+SEM, in HEK293A cells. N<C, less YAP/TAZ in nucleus than in cytoplasm. N=C, similar levels of YAP/TAZ in cytoplasm and nucleus. N>C, more YAP/TAZ in nucleus than in cytoplasm. f. RAP2 is required for regulation of YAP/TAZ target genes CTGF, CYR61, and ANKRD1 by stiffness in HEK293A cells. Data are presented as mean±SEM. For Panel e,f, n=3 biologically independent samples. Scale bar, 25 μm.
Figure 2|
Figure 2|. ECM stiffness acts via PDZGEF1/2 to regulate RAP2.
a. RAP2 is activated by low stiffness. Pulldown of GTP-bound RAP2 from cells at 1 kPa and 40 kPa using GST-RalGDS-RBD. b. PDZGEF1/2 deletion compromises YAP/TAZ translocation at 1 kPa. c. Quantification of YAP/TAZ localization, presented as mean+SEM, in Panel b. n=3 (40 kPa) or 4 (1 kPa) biologically independent samples. d. PDZGEF1/2 mediate RAP2 regulation by stiffness. Experiments were similar to Panel a. e. High stiffness reduces PIP2 enrichment at the plasma membrane. A GFP-tagged PIP2 reporter PLCδ-PH domain was transfected into cells and detected with anti-GFP antibodies. The experiments in Panel a,d,e were repeated independently twice with similar results. Scale bar, 25 μm.
Figure 3.|
Figure 3.|. RAP2 inhibits YAP/TAZ through MAP4K4/6/7 and ARHGAP29.
a. RAP2 is important for stiffness-regulated phosphorylation of LATS1/2 and YAP/TAZ. Phos-tag gel detects YAP phosphorylation by mobility shift. pLATS-HM detects LATS phosphorylation in the hydrophobic motif. b. Expression of MAP4K4-WT, but not the Citron domain-deleted mutant (ΔCNH), rescued YAP/TAZ localization in MM-8KO (MST1/2-MAP4K1/2/3/4/6/7–8KO) cells at low stiffness. Merged, combined signals from HA-MAP4K4 (green), YAP/TAZ (red), and DAPI (blue). c. Overexpression of ARHGAP29 WT, but not the GAP domain-deleted mutant (-ΔGAP), induced YAP phosphorylation. LPA treatment, which activates RhoA, is indicated. d. Knockout of ARHGAP29 and MAP4K4/6/7 blocked RAP2A-induced YAP/TAZ cytoplasmic localization. Merged, combined signals from Flag-RAP2A (green), YAP/TAZ (red), and DAPI (blue). e. Co-deletion of ARHGAP29 and MAP4K4/6/7 blocked YAP/TAZ cytoplasmic translocation at 1 kPa. For Panel a-e, the experiments were repeated twice independently with similar results. f. A model showing a signaling axis by which stiffness regulates YAP/TAZ. The dotted lines indicate an actin/cytoskeleton-mediated pathway reported previously (ref 7). Scale bar in, 25 μm.
Figure 4.|
Figure 4.|. RAP2 suppresses cell transformation and regulates the ECM stiffness transcriptome through Hippo/YAP.
a. YAP/TAZ knockdown suppresses the aberrant acinus growth caused by RAP2A/B/C deletion in MCF10A cells. Scale bar, 100 μm. b. Quantification of aberrant acini from 3 hydrogels is shown as mean±SEM. Two-tailed t-test: ***, RAP2-KO vs. WT, p=0.00022; **, shYAP/TAZ vs. Scramble, p=0.0067. c. MST1/2-dKO and RAP2-MST1/2-KO MCF10A cells were s.c. injected into NOD/SCID mice. The tumor volume is shown as mean±SEM. ****, two-way ANOVA test, n=6 biologically independent xenografts, p<0.0001. d. RAP2-MST1/2-KO MCF10A cells with scramble or YAP/TAZ-targeting shRNAs were injected into NOD/SCID mice. The tumor volume is presented as mean±SEM. ****, two-way ANOVA test, n=6 biologically independent xenografts, p<0.0001. e. MCF10A and MCF10A-T cells with RAP2 deletion were injected into nude mice. The tumor volume is presented as mean+SEM. ****, two-way ANOVA test, n=6 biologically independent xenografts, p<0.0001. f. Tumor weights on Day 20 from Panel e are presented as mean±SEM. Two-tailed t-test: ***, n=6, p=0.0001; ****, n=6, p = 0.00007. g. MCF7 cells with lentivirus-mediated CRISPR deletion of RAP2 (sgRAP2) embedded in 200 μl 0.4 or 9.0 kPa HA gels were injected into nude mice. The xenograft volume was shown as mean±SEM. ****, two-way ANOVA test, n=6 (WT, 0.4 kPa), 8 (sgRAP2, 0.4 or 9.0 kPa), or 9 (WT, 9.0 kPa) biologically independent xenografts, p < 0.0001. h. Tumor weights on Day 31 from Panel g are presented as mean±SEM. Two-tailed t-test: ***, n=6 or 9, p = 0.0006; ****, n=6 or 8, p=0.00002. i. Expression of genes down- or up-regulated by low stiffness in WT cells was assessed by RNA-sequencing and compared with YAP/TAZ-dKO, LATS1/2-dKO, and RAP2-KO cells. j. A Heat-map of representative ECM-responsive genes regulated by RAP2 and the Hippo pathway.

Comment in

References

    1. Humphrey JD, Dufresne ER & Schwartz MA Mechanotransduction and extracellular matrix homeostasis. Nat Rev Mol Cell Biol 15, 802–812, doi:10.1038/nrm3896 (2014). - DOI - PMC - PubMed
    1. Meng Z, Moroishi T & Guan KL Mechanisms of Hippo pathway regulation. Genes Dev 30, 1–17, doi:10.1101/gad.274027.115 (2016). - DOI - PMC - PubMed
    1. Halder G, Dupont S & Piccolo S Transduction of mechanical and cytoskeletal cues by YAP and TAZ. Nat Rev Mol Cell Biol 13, 591–600, doi:10.1038/nrm3416 (2012). - DOI - PubMed
    1. Aragona M et al. A mechanical checkpoint controls multicellular growth through YAP/TAZ regulation by actin-processing factors. Cell 154, 1047–1059, doi:10.1016/j.cell.2013.07.042 (2013). - DOI - PubMed
    1. Codelia VA, Sun G & Irvine KD Regulation of YAP by mechanical strain through Jnk and Hippo signaling. Curr Biol 24, 2012–2017, doi:10.1016/j.cub.2014.07.034 (2014). - DOI - PMC - PubMed

Publication types

MeSH terms

Substances