. 2018 Aug;560(7720):644-648.
doi: 10.1038/s41586-018-0439-x. Epub 2018 Aug 22.

A multi-cohort study of the immune factors associated with M. tuberculosis infection outcomes

Affiliations

A multi-cohort study of the immune factors associated with M. tuberculosis infection outcomes

Roshni Roy Chowdhury et al. Nature. 2018 Aug.

Erratum in

Abstract

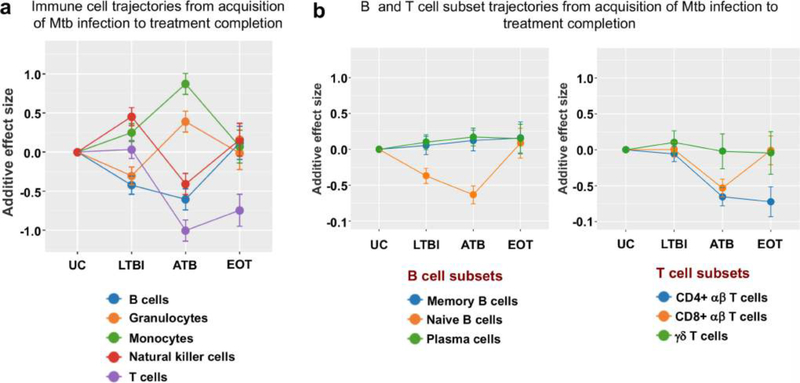
Most infections with Mycobacterium tuberculosis (Mtb) manifest as a clinically asymptomatic, contained state, known as latent tuberculosis infection, that affects approximately one-quarter of the global population1. Although fewer than one in ten individuals eventually progress to active disease2, tuberculosis is a leading cause of death from infectious disease worldwide3. Despite intense efforts, immune factors that influence the infection outcomes remain poorly defined. Here we used integrated analyses of multiple cohorts to identify stage-specific host responses to Mtb infection. First, using high-dimensional mass cytometry analyses and functional assays of a cohort of South African adolescents, we show that latent tuberculosis is associated with enhanced cytotoxic responses, which are mostly mediated by CD16 (also known as FcγRIIIa) and natural killer cells, and continuous inflammation coupled with immune deviations in both T and B cell compartments. Next, using cell-type deconvolution of transcriptomic data from several cohorts of different ages, genetic backgrounds, geographical locations and infection stages, we show that although deviations in peripheral B and T cell compartments generally start at latency, they are heterogeneous across cohorts. However, an increase in the abundance of circulating natural killer cells in tuberculosis latency, with a corresponding decrease during active disease and a return to baseline levels upon clinical cure are features that are common to all cohorts. Furthermore, by analysing three longitudinal cohorts, we find that changes in peripheral levels of natural killer cells can inform disease progression and treatment responses, and inversely correlate with the inflammatory state of the lungs of patients with active tuberculosis. Together, our findings offer crucial insights into the underlying pathophysiology of tuberculosis latency, and identify factors that may influence infection outcomes.


Conflict of interest statement

Competing interests The authors declare no competing interests.

Figures

Extended Data Fig. 1 |
Extended Data Fig. 1 |. Broad alterations of peripheral immune cell distributions in LTBI.
PBMCs from 14 latently infected and 14 uninfected participants of a South African adolescent cohort were characterized using CyTOF with antibody panel 1 (Supplementary Table 2), followed by Citrus analysis and clustering. This unsupervised hierarchical clustering analysis produced a branching structure (dendrogram) that allowed the grouping of total live cells into known immune cell compartments (contoured). Cell clusters are represented as nodes (circles) in this Citrus-derived circular dendrogram, which delineates lineage relationships that were identified from the data. Cluster granularity (that is, cell subset specificity) increases from the centre of the diagram to the periphery. a, Annotation of cluster hierarchy plots based on surface marker expression. The expression intensity of each marker used for cell population characterization is overlaid per cluster on the Citrus circular dendrogram and is indicated, independently for each marker, by the coloured gradient for which the range corresponds to the arcsinh-transformed expression of the median marker expression measured across all Citrus clusters. For each marker, we also provide a dot plot graph demonstrating the marker labelling in the manually gated indicated population. b, Citrus plots showing, based on cell-surface protein expression, clusters (in red, designated A–F) that exhibit significantly different abundances (SAM analysis with FDR < 1%) between the uninfected and latently infected individuals. Individual cell clusters are mapped to well-established, gross-cell types: B cells (CD19+), CD8+ αβ T cells (CD3+TCRβ+CD8+), CD4+ αβ T cells (CD3+TCRβ+CD4+), γδ T cells (CD3+TCRδ+), monocytes (CD3CD19CD33+CD14+HLA-DR+), NK cells (CD3CD19CD14HLA-DRCD16+CD56bright/dim), identifiable by annotated shaded background groupings. c, The phenotype and the composition of cells in each of the stratifying cell subsets (A–F), identified by Citrus analysis. d, Percentages of NK cells and B cells determined by manual gating of 20 additional samples using CyTOF antibody panel 2 (left; Supplementary Table 2) and 32 samples using flow cytometry (right). e, Percentages of CD4+ αβ T cells, CD8+ αβ T cells and γδ T cells in uninfected controls and latently infected individuals, analysed by CyTOF (n = 24 per group; top) and flow cytometry (n = 16 per group; bottom). Throughout, P values were derived using a Mann–Whitney U-test. Mean and error bars representing the 95% confidence intervals are shown for each comparison.
Extended Data Fig. 2 |
Extended Data Fig. 2 |. Enhanced effector function response in LTBI.
a, Cell subsets, shown as red nodes in a Citrus-derived circular dendrogram and designated as 1–5, were identified as significantly different in abundance (SAM analysis at FDR < 1%) based on CyTOF analysis of effector and cell-surface molecule expression on PBMCs (antibody panel 1, Supplementary Table 2) from uninfected controls and individuals with LT BI (n = 14 per group) after 4-h PMA and ionomycin stimulation. Mapping of individual cell clusters to established, grosscell types are identified by annotated shaded background groupings. b, Expression intensity of selected effector molecules is indicated by the coloured gradient for which the range corresponds to the arcsinh-transformed expression of the median marker expression measured across all C itrus clusters. c, Effector molecule expression and the composition of cells in each of the stratifying cell clusters (1–5), identified by Citrus analysis. d, viSNE analysis of GZMB expression level in immune-cell subsets, representative of 14 uninfected and 14 individuals with LTBI (the colour gradient corresponds to the arcsinh-transformed expression level). e, Quantification of intracellular GZMB expression level in NK cells, CD8+ αβ T cells and γδ T cells in uninfected controls and individuals with LTBI (n = 14 per group). P values were derived using a Mann–Whitney U-test. Mean and error bars representing the 95% confidence intervals are shown for each comparison. f, Dot plots from CyTOF analysis of CD16+GZMBhigh cells within each lymphocyte subset, representative of 14 uninfected controls and 14 individuals with LTBI. g, Gating strategy for ADCC. ADCC was measured using NK-resistant P815 cells, which were either coated with antibody (2.4G2) or left uncoated (control), and labelled with the intracellular dye CFSE, followed by the DNA dye 7AAD. CFSE+7AAD+ cells were defined as dead target cells.
Extended Data Fig. 3 |
Extended Data Fig. 3 |. Alterations in plasma protein levels in LTBI.
The relative levels of plasma proteins (Supplementary Table 3), shown on a log2 scale, between uninfected controls and individuals with LTBI (n = 27 per group). Plasma proteins that were present at significantly higher levels (a) and significantly lower levels (b) in individuals with LTBI. Plasma protein quantification was performed using the proximity extension assay. P values were derived using a unpaired two-tailed Student’s t-test. Mean and error bars representing the 95% confidence intervals are shown for each comparison.
Extended Data Fig. 4 |
Extended Data Fig. 4 |. Changes in frequencies of peripheral B cell subsets in LTBI, active TB and after treatment.
Forest plots for estimated frequencies of B cell subsets: naive B cells, memory B cells and plasma cells. a, Comparison between the uninfected state (n = 189) and LTBI (n = 145). b, Comparison between LTBI (n = 409) and active T B (n = 543). c, Comparison between active TB (n = 76) and end-of-treatment (n = 97). Cohort GSE identifiers are listed on the left. In the plots, boxes represent the standardized mean difference in estimated cellular proportions in a cohort between two comparison groups. The size of the box is proportional to the sample size of a given cohort. Lines indicate the 95% confidence interval of the corresponding effect sizes. Diamonds indicate the summary effect size (Summary), obtained by integrating the effect sizes from individual cohorts. The width of the diamond corresponds to its 95% confidence interval. The P values and q values for the summary effect sizes are shown above each plot.
Extended Data Fig. 5 |
Extended Data Fig. 5 |. Changes in frequencies of peripheral T cell subsets, monocytes and granulocytes in LTBI, active TB and after treatment.
Forest plots for estimated frequencies of CD4+αβ T cells, CD8+αβ T cells, monocytes and granulocytes. a, Comparison between the uninfected state (n = 189) and LTBI (n = 145). b, Comparison between LTBI (n = 409) and active TB (n = 543). c, Comparison between active TB (n = 76) and end-of-treatment (n = 97). Boxes represent the standardized mean difference in estimated cellular proportions in a cohort between two comparison groups. The size of the box is proportional to the sample size of a given cohort. Lines indicate the 95% confidence interval of the corresponding effect sizes. Diamonds indicate the summary effect size (Summary), obtained by integrating the effect sizes from individual cohorts. The width of the diamond corresponds to its 95% confidence interval. The P values and q values for the summary effect sizes are shown above each plot.
Extended Data Fig. 6 |
Extended Data Fig. 6 |. Comparison of the frequencies of peripheral NK cells, B cells and T cells between uninfected controls and patients with active TB.
Forest plots comparing changes in the levels of NK cells, B cells and T cells between uninfected individuals (n = 191) and patients with active TB (n = 178). Boxes represent the standardized mean difference in estimated cellular proportions in a cohort between two comparison groups. The size of the box is proportional to the sample size of a given cohort. Lines indicate the 95% confidence interval of the corresponding effect sizes. Diamonds indicate the summary effect size (Summary), obtained by integrating the effect sizes from individual cohorts. The width of the diamond corresponds to its 95% confidence interval. The P values and q values for the summary effect sizes are shown above each plot.
Extended Data Fig. 7 |
Extended Data Fig. 7 |. Trajectories of different immune cell populations from the acquisition of Mtb infection to end-of-treatment.
Changes in the frequency distribution patterns of different peripheral leukocyte populations (a) and B and T cell subpopulations (b) at the different stages of infection. Lines indicate cumulative effect size scores starting from a healthy baseline level up to treatment of active TB disease. Error bars indicate corresponding standard errors.
Extended Data Fig. 8 |
Extended Data Fig. 8 |. Correlation between peripheral NK cell percentage and lung inflammation.
Correlation plot showing the relationship between estimated peripheral NK cell frequencies in patients with active TB at week 4 after treatment initiation and total glycolytic activity index (TGAI) of the lung measured by PET–CT imaging at the corresponding time point. The line represents the best fit and the shaded area the 95% confidence interval. NK cell frequencies were determined by deconvolution.
Extended Data Fig. 9 |
Extended Data Fig. 9 |. Synchronization of the adolescent cohort who underwent QuantiFERON conversion following Mtb acquisition.
To identify changes in peripheral NK cell frequencies after acquisition of Mtb infection by cell-mixture deconvolution analysis, the timescale of the gene expression dataset (GSE116014) was realigned according to the time of first infection diagnosis instead of study enrolment, allowing the identification of gene-expression profiles obtained before infection diagnosis. Each individual is represented by a horizontal bar. The length of the bar represents the number of days between study enrolment and diagnosis with Mtb infection. During follow-up, each individual transitioned from an uninfected state (blue) to infected state (brown), that is, underwent QFT conversion. The black circles represent time points for which gene-expression data were available. Pre-infection (Pre) data (180–360 days) were compared to data obtained at the time of infection diagnosis or the nearest time point after diagnosis (Post) (0–360 days).
Fig. 1 |
Fig. 1 |. Schematic representation of the experimental design.
a, Identification of immune features distinguishing uninfected and latently infected individuals from a cohort of South African adolescents. t-SNE, t-distributed stochastic neighbour embedding. viSNE, visualization using t-SNE. b, Analysis of changes in immune cell subset abundance at different stages of infection and end-of-treatment using cell-type deconvolution of transcriptomic data from multiple cohorts, and fluorescence-activated cell sorting (FAC S) analysis of PBMCs from an adult Chinese cohort. c, Evaluation of changes in NK cell frequencies in longitudinal cohorts, for individuals who (1) acquired Mtb infection (QuantiFERON converters); (2) progressed from LTBI to active TB, and (3) patients with active TB who proceeded to treatment completion; and their correlations with pulmonary pathology as measured by PET–CT imaging. ATB, active tuberculosis; EOT, end-of-treatment; UC, uninfected controls.
Fig. 2 |
Fig. 2 |. Immune state of TB latency identified in a cohort of South African adolescents.
a,b, Frequencies of cell subsets were defined by surface marker (a) and effector molecule (b) expression that are present in significantly (FDR < 1% by SAM analysis) different abundances between uninfected controls and individuals with LT BI (n = 14 per group) as determined by Citrus analysis of CyTOF results (Extended Data Figs. 1, 2). c, Cytolytic responses of NK cells isolated from PBMCs of uninfected controls and individuals with LT BI (n = 10 per group), quantified by calcein-release from calcein-labelled target (K562) cells upon lysis. d, Percentages of CD16+GZMBhigh cells within each lymphocyte subset in uninfected controls and individuals with LT BI (n = 14 per group) (Extended Data Fig. 2f). e, ADCC response of total PBMCs from uninfected controls and individuals with LTBI (n = 12 per group) as determined by antibody-mediated killing of CFSE-labelled target (P815) cells (Extended Data Fig. 2g). f, Frequencies of phosphorylated ribosomal protein S6 (pS6)+ cells within T cell subsets under different stimulation conditions in uninfected controls and individuals with LTBI (n = 10 per group). g, Volcano plot of plasma protein abundance in uninfected controls and individuals with LTBI (n = 27 per group) (Supplementary Table 3). Throughout, P values were derived using a Mann–Whitney U-test, unless otherwise stated. Mean and error bars representing the 95% confidence intervals are shown for each comparison. See Supplementary Table 1.
Fig. 3 |
Fig. 3 |. Peripheral lymphocyte distributions at different infection stages from global cohorts.
Forest plots comparing changes in the levels of NK cells, B cells and T cells were calculated using cell-mixture deconvolution. a, Comparison between uninfected controls (n = 189) and individuals with LTBI (n = 145). b, Comparison between individuals with LT BI (n = 409) and patients with active TB (n = 543). c, Comparison between patients with active TB before (n = 76) and after six months of treatment (end-of-treatment) (n = 97). Cohort GSE identifiers are listed on the left. Boxes represent the standardized mean difference in estimated cellular proportions in a cohort between two comparison groups (effect size). The size of the box is proportional to the sample size of a given cohort. Whiskers represent the 95% confidence interval of the corresponding standardized mean difference in cellular proportions. Diamonds represent the overall difference in cellular proportions between two groups by integrating the standardized mean differences across all individual cohorts-summary effect sizes (Summary). The width of the diamond corresponds to its 95% confidence interval. The q values (FDR) for the summary effect sizes are shown above each plot. d, Percentages of peripheral NK cells, B cells and T cells in a Chinese cohort of uninfected controls (n = 24), individuals with LTBI (n = 17) and patients with active T B (n = 23) assessed by flow cytometry. P values were derived using a one-way ANOVA with Tukey’s multiple comparisons test. Mean and error bars representing the 95% confidence intervals are shown for each comparison. See Supplementary Tables 4, 5.
Fig. 4 |
Fig. 4 |. Correlations between peripheral NK cell percentages and disease progression, treatment response and inflammation in the lung.
a, Changes in peripheral NK cell percentages in South African adolescents after acquisition of Mtb infection (Extended Data Fig. 9, n = 17) were determined by cell-mixture deconvolution. Pre-infection (Pre) gene-expression data (180–360 days) were compared to data obtained at the time of infection diagnosis or the nearest time point after diagnosis (0–360 days) (Post). b, Changes in peripheral NK cell percentages during progression from LTBI to active disease at different time points before TB diagnosis and non-progressors over a span of two years (Supplementary Table 6) were determined by cell-mixture deconvolution (17 progressors and 41 non-progressors) (left) and flow cytometry (12 progressors and 20 non-progressors) (right). All P values were derived using a Wilcoxon rank-sum test. Mean and error bars representing the 95% confidence intervals are shown. c, Receiver operating characteristic curves of the potential of estimated NK cell frequencies as a predictor of TB disease progression. d, Estimated NK cell percentages in patients with active TB from the Catalysis-TB cohort at baseline (pre-treatment) and at various time points during treatment. Definite cure indicates sputum culture negative by month 6 after treatment initiation (n = 76); no cure indicates sputum culture positive after six months of treatment initiation (n = 7). P values were derived using a Wilcoxon rank-sum test. Mean and error bars representing the 95% confidence intervals are shown. e, Correlation plot showing the relationship between estimated peripheral NK cell frequencies in patients with active TB at baseline (pre-treatment) and total glycolytic activity index (TGAI) measured by PET–CT imaging of the lungs at baseline. The line represents the best fit and the shaded area the 95% confidence interval. NK cell frequencies were determined by deconvolution.

References

    1. Houben RM & Dodd PJ The global burden of latent tuberculosis infection: a re-estimation using mathematical modelling. PLoS Med. 13, e1002152 (2016). - PMC - PubMed
    1. Shea KM, Kammerer JS, Winston CA, Navin TR & Horsburgh CR Jr. Estimated rate of reactivation of latent tuberculosis infection in the United States, overall and by population subgroup. Am. J. Epidemiol 179, 216–225 (2014). - PMC - PubMed
    1. WHO. Global Tuberculosis Report. http://www.who.int/tb/publications/global_report/en/ (2017).
    1. Spitzer MH & Nolan GP Mass cytometry: single cells, many features. Cell 165, 780–791 (2016). - PMC - PubMed
    1. Mahomed H et al. Predictive factors for latent tuberculosis infection among adolescents in a high-burden area in South Africa. Int. J. Tuberc. Lung Dis 15, 331–336 (2011). - PubMed

Publication types

MeSH terms