. 2018 Sep;561(7722):258-262.
doi: 10.1038/s41586-018-0448-9. Epub 2018 Aug 22.

Parkin and PINK1 mitigate STING-induced inflammation

Affiliations

Parkin and PINK1 mitigate STING-induced inflammation

Danielle A Sliter et al. Nature. 2018 Sep.

Retraction in

Abstract

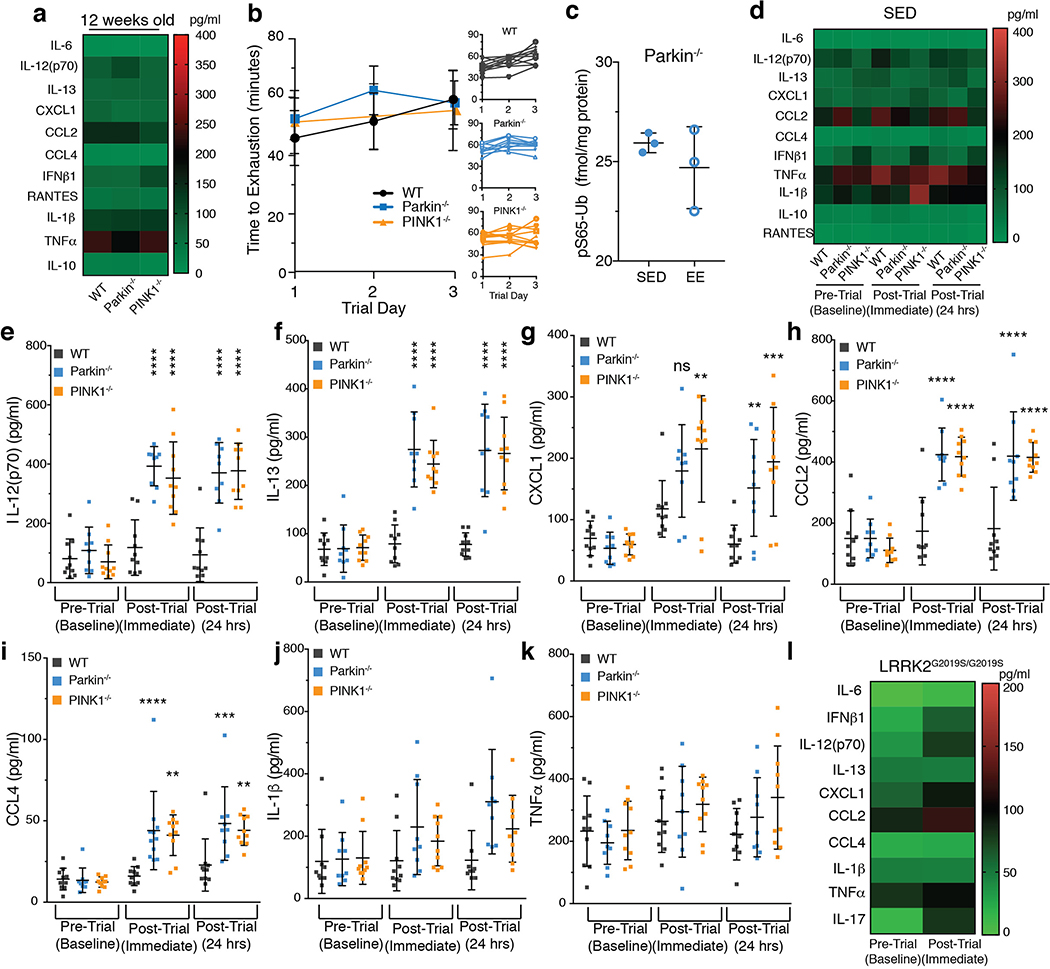
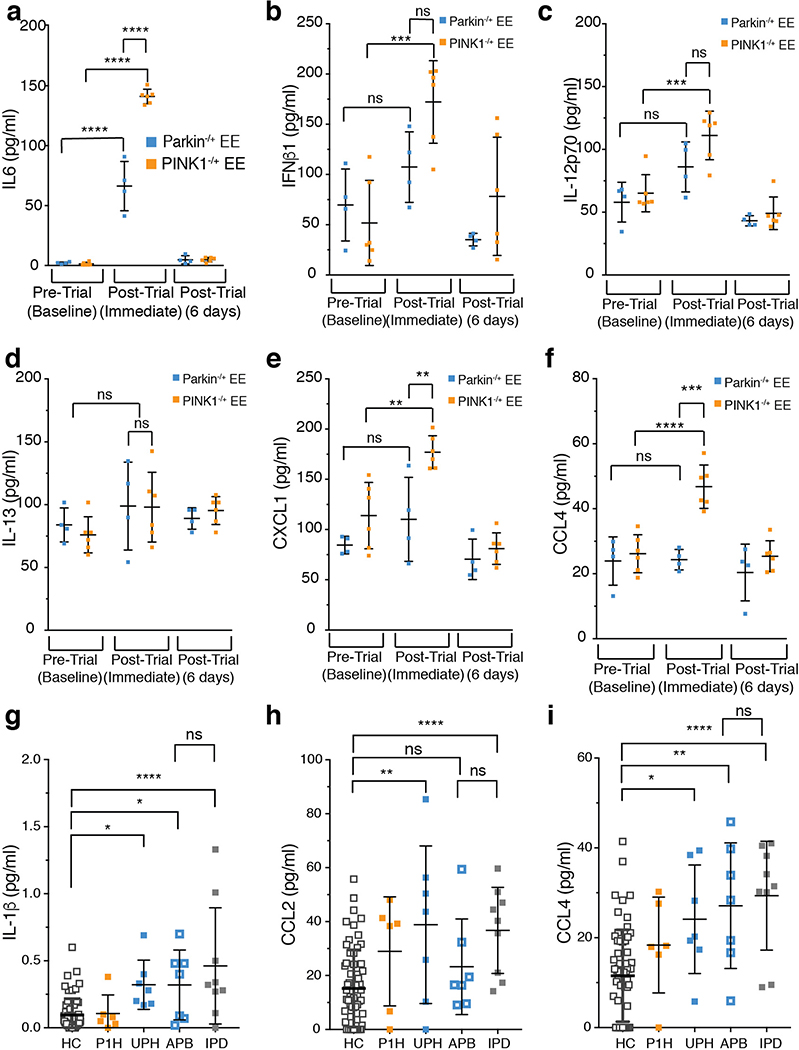
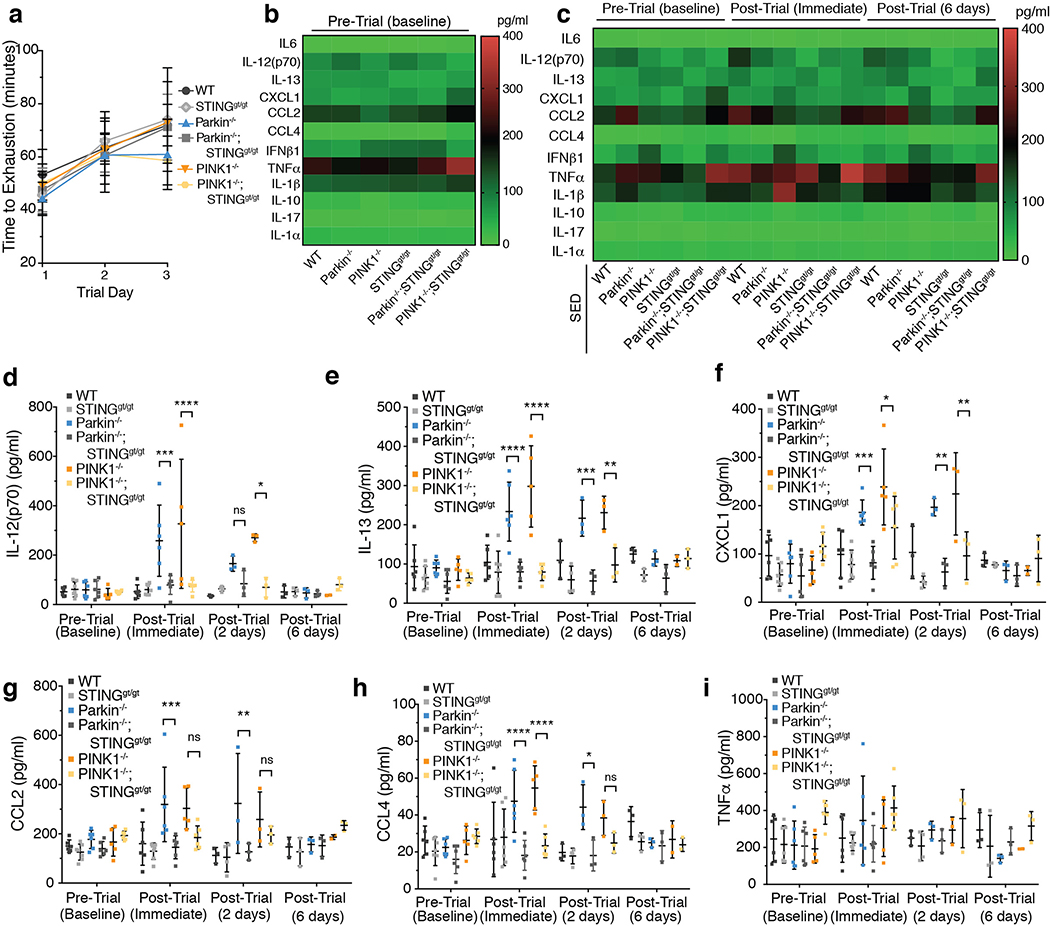
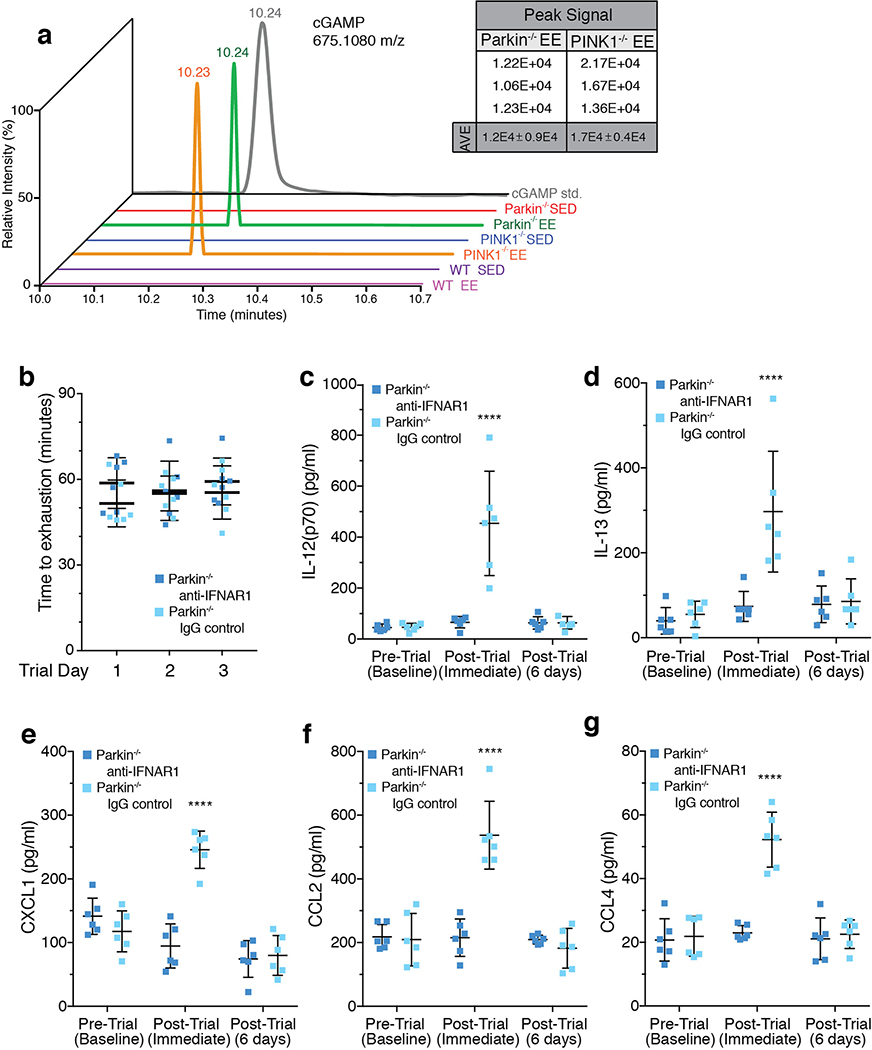
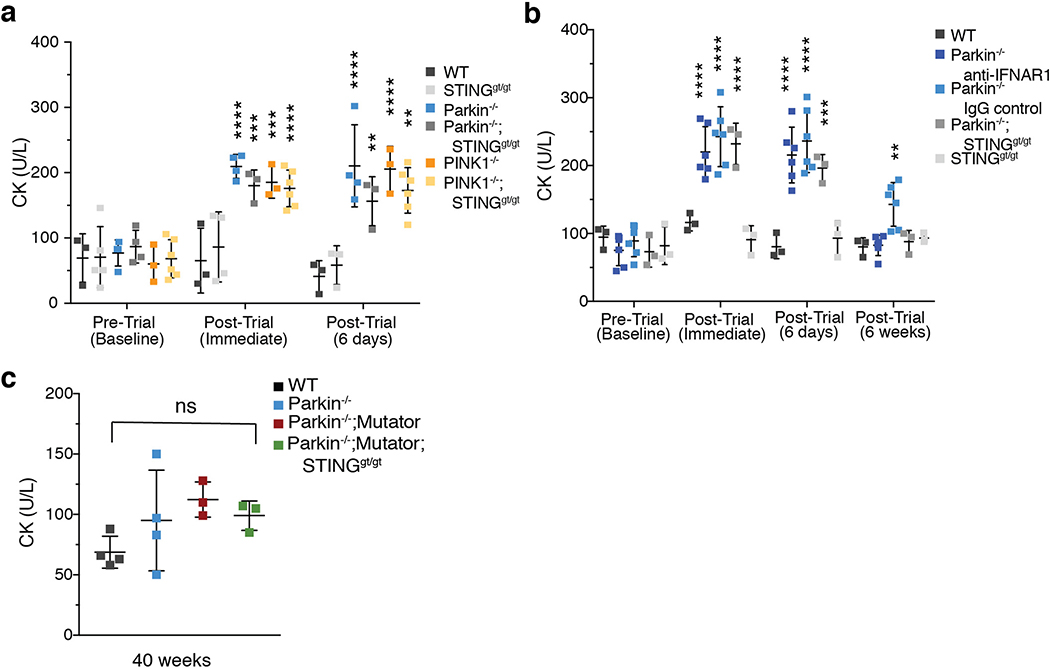
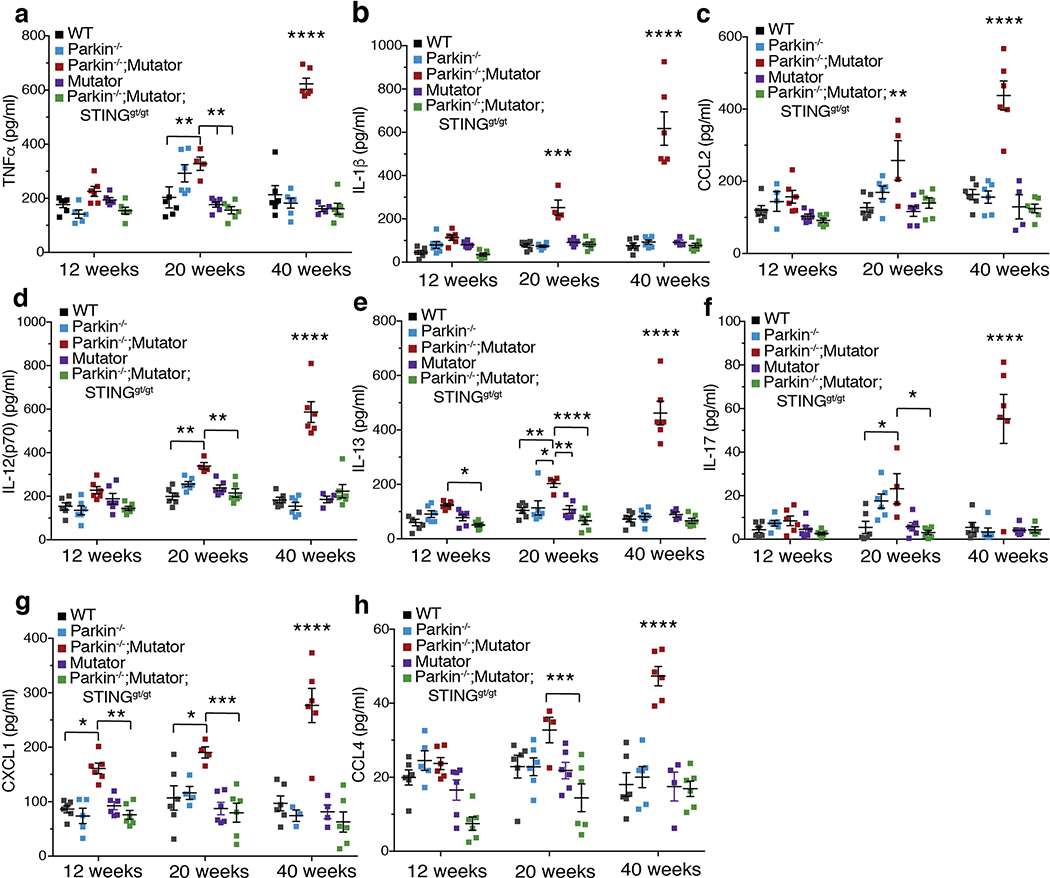
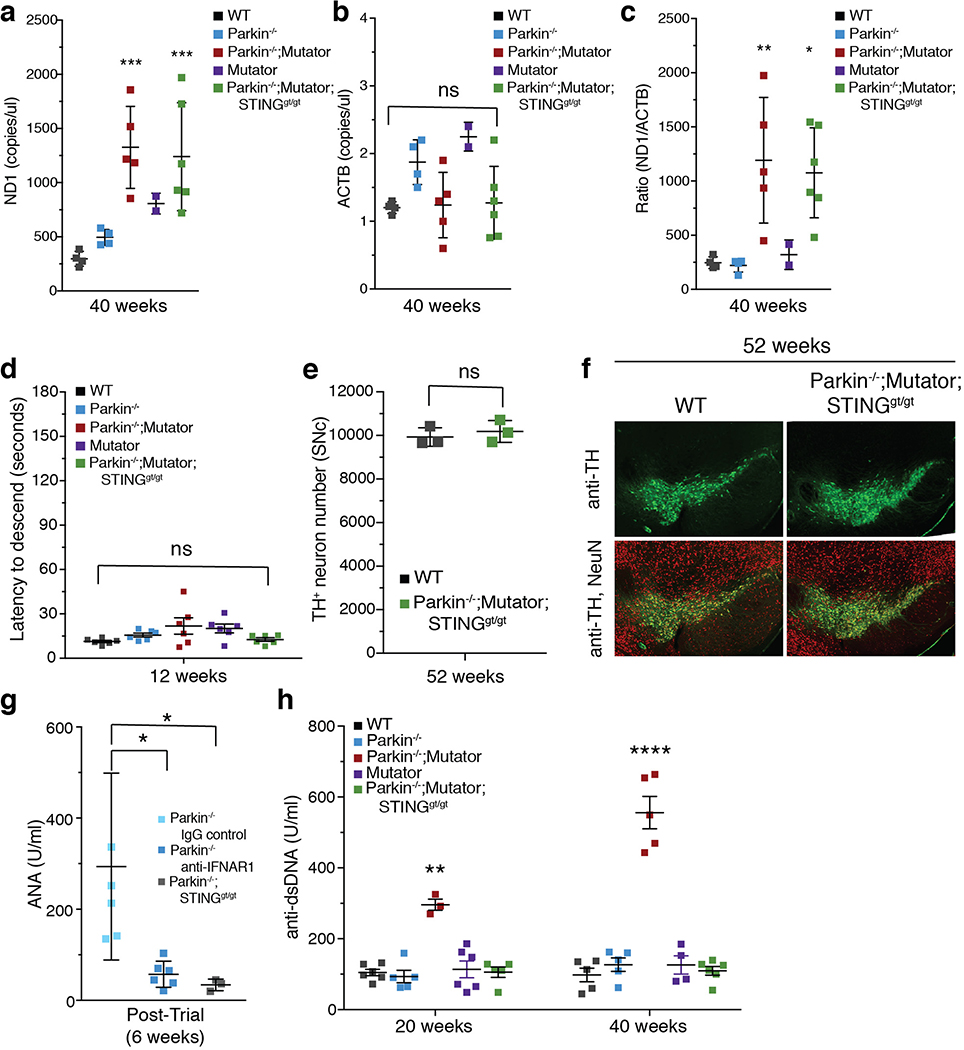
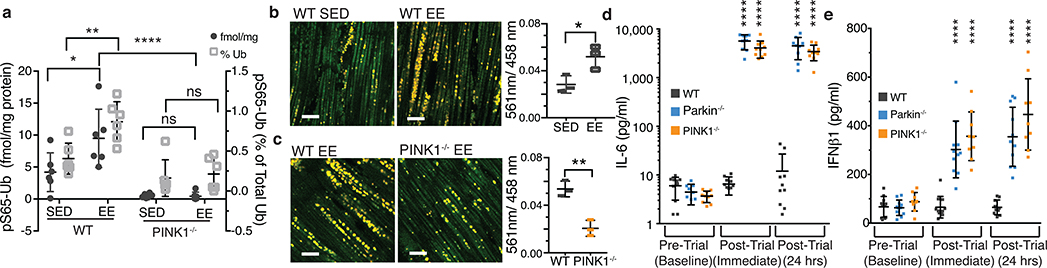
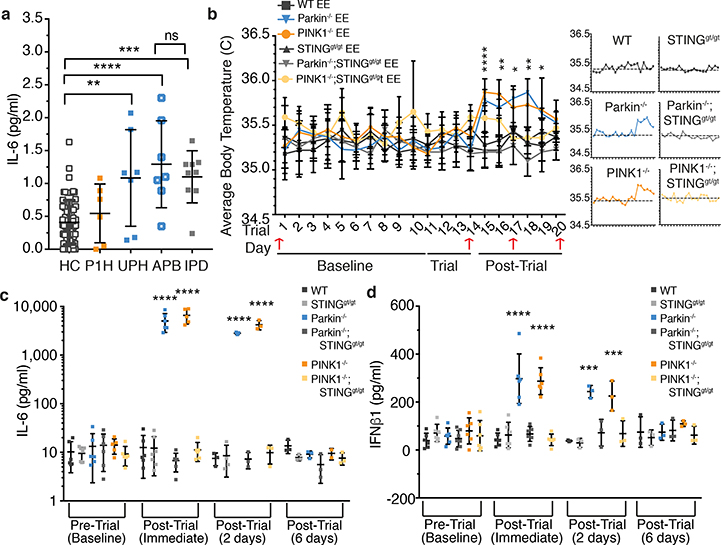
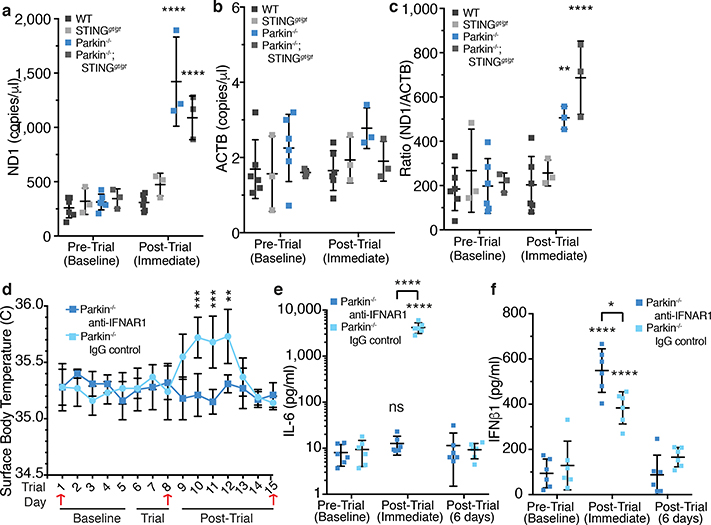
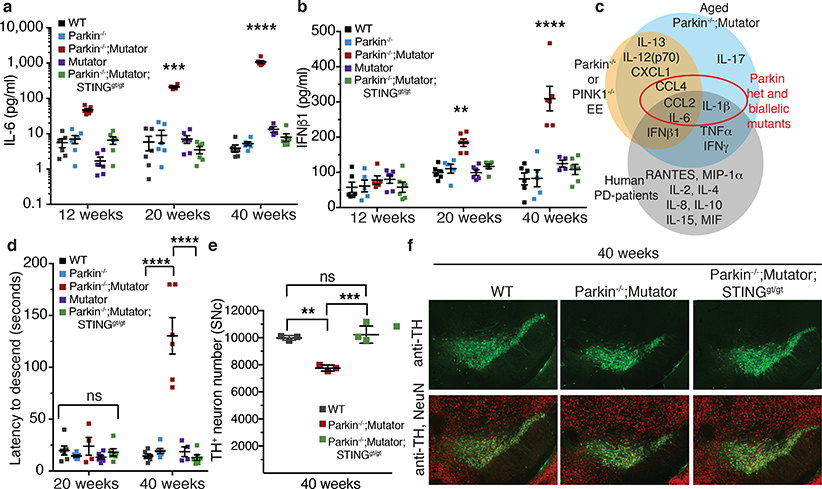
Although serum from patients with Parkinson's disease contains elevated levels of numerous pro-inflammatory cytokines including IL-6, TNF, IL-1β, and IFNγ, whether inflammation contributes to or is a consequence of neuronal loss remains unknown1. Mutations in parkin, an E3 ubiquitin ligase, and PINK1, a ubiquitin kinase, cause early onset Parkinson's disease2,3. Both PINK1 and parkin function within the same biochemical pathway and remove damaged mitochondria from cells in culture and in animal models via mitophagy, a selective form of autophagy4. The in vivo role of mitophagy, however, is unclear, partly because mice that lack either PINK1 or parkin have no substantial Parkinson's-disease-relevant phenotypes5-7. Mitochondrial stress can lead to the release of damage-associated molecular patterns (DAMPs) that can activate innate immunity8-12, suggesting that mitophagy may mitigate inflammation. Here we report a strong inflammatory phenotype in both Prkn-/- and Pink1-/- mice following exhaustive exercise and in Prkn-/-;mutator mice, which accumulate mutations in mitochondrial DNA (mtDNA)13,14. Inflammation resulting from either exhaustive exercise or mtDNA mutation is completely rescued by concurrent loss of STING, a central regulator of the type I interferon response to cytosolic DNA15,16. The loss of dopaminergic neurons from the substantia nigra pars compacta and the motor defect observed in aged Prkn-/-;mutator mice are also rescued by loss of STING, suggesting that inflammation facilitates this phenotype. Humans with mono- and biallelic PRKN mutations also display elevated cytokines. These results support a role for PINK1- and parkin-mediated mitophagy in restraining innate immunity.


Conflict of interest statement

The authors declare no competing financial interests.

Figures

Extended Data Figure 1.
Extended Data Figure 1.. Inflammation in Parkin−/− and PINK1−/− mice.
a, d) Heat maps depicting average cytokine concentration in serum from mice (n=10), b) Average time to exhaustion on each trial day. Small graphs show individual run times (n=10), c) pS65-ubiquitin as fmol per mg total protein from Parkin−/− heart tissue (n= 3). e-k) Serum cytokine concentrations from EE mice are graphed as mean−/+SD (n=10). l) Heat map depicting serum cytokine levels of LRRK2G2019S/G2019S (n=4). Using T-tests, no differences in cytokine concentrations were found between Pre-Trial (Baseline) and Post-Trial (Immediate). ****, ***, **, * indicate P<0.001, 0.005, 0.01, 0.05 respectively. ns= not significant. SED means sedentary.
Extended Data Figure 2.
Extended Data Figure 2.. Inflammatory cytokines are increased in mice and humans with heterozygous loss of Parkin or PINK1.
a-f) Serum cytokine concentrations from Parkin−/+ (n=4) and PINK1−/+ (n=6) EE mice. g-i) Serum cytokine concentrations from human control (HC) (n=62), PINK1 heterozygotes (P1H) (n=6), unaffected Parkin heterozygotes (UPH) (n=7), affected Parkin biallelic mutants (APB) (n=7) and idiopathic PD patients (IPD) (n=9). Graphs are presented as mean−/+SD. ****, ***, **, * indicate P<0.001, 0.005, 0.01, 0.05 respectively. ns=not significant.
Extended Data Figure 3.
Extended Data Figure 3.. STING loss prevents increased cytokine levels in Parkin−/− and PINK1−/−mice following EE.
a) Average time to exhaustion on each trial day (n=6). b-c) Heat map depicting the average baseline serum cytokine concentration for EE mice (n=6) and the average serum cytokines from SED (sedentary) mice (n=6). d-i) Serum cytokine concentrations from mice are graphed as mean−/+SD. (n=6, baseline, post-trial immediate or n=3, post-trial 2 days or post-trial 6 days) ****, ***, **, * indicate P<0.001, 0.005, 0.01, 0.05, respectively. ns=not significant.
Extended Data Figure 4.
Extended Data Figure 4.. cGAMP is increased in Parkin−/− and PINK1−/− EE heart tissue and inflammation is inhibited by anti-IFNAR1 treatment.
a) Representative plot of signal intensity for cGAMP measured in heart tissue. cGAMP was not detected in WT EE or in SED mice. Average signal intensity for n=3 samples is shown in the inset. b) Average time to exhaustion on each trial day (n=6). c-g) Serum cytokine concentrations from EE Parkin−/− mice treated with anti-IFNAR1 antibody or IgG control (n=6). Graphs are presented as mean−/+SD. ****, *** indicate P<0.001, 0.005, respectively. ns=not significant.
Extended Data Figure 5.
Extended Data Figure 5.. Elevated CK following EE in Parkin−/− and PINK1−/− mice is not rescued by inflammation inhibition and not elevated by chronic mitochondrial dysfunction.
a-c) Serum creatine kinase (CK) levels (n<3). Graphs are presented as mean−/+SD. ****, ***, ** indicate P<0.001, 0.005, 0.01, respectively.
Extended Data Figure 6.
Extended Data Figure 6.. Inflammation in aged Parkin−/−;Mutator mice is rescued by STING loss.
a-h) Serum cytokines concentrations from 12-, 20-, and 40-week-old mice (n=4, 6). Graphs are presented as mean−/+SD. ****, ***, ** indicate P<0.001, 0.005, 0.01 respectively. ns=not significant
Extended Data Figure 7.
Extended Data Figure 7.. STING mediates inflammation under chronic mitochondrial stress.
a-b) Copy number/μl of cell-free mtDNA (ND1) or nuclear DNA (ACTB) in serum (n<3). c) Ratio of mtDNA to nuclear DNA. (n<3) d) The time required for 12-week-old mice to descend the pole (n=6). e) TH+-neurons counted by stereology in the substantia nigra (SNc) of 52-week-old mice (n=3). f) Representative images of TH+-neurons (green) and total neurons (NeuN,red). g) Serum levels of antinuclear antibodies (ANA) 6 weeks post-EE. dsDNA antibodies were not detected and ANAs were not detected at baseline or immediately post-EE (n=4, 6). h) Serum levels of anti-dsDNA antibodies (n=4, 6). ANA antibodies were not detected. Graphs are presented as mean−/+SD (n=6). ****, ***, * indicate P< 0.001, 0.005, 0.05 respectively. ns= not significant.
Figure 1.
Figure 1.. Inflammation and mitophagy with Parkin and PINK1 deficiency.
a) pS65-ubiquitin as a percentage of total ubiquitin (right y-axis) and as fmol per mg total protein (left y-axis) from heart tissue (n=6). b) Representative images of heart tissue from SED or EE mice expressing mtKeima with quantification of the 561nm/488nm ratio (n=3). c) Representative images of heart tissue from wild type and PINK1−/− EE mice expressing mt-Keima with quantification of the 561nm/488nm ratio (n=3). d-e) Serum IL-6 and IFNβ1 concentrations for EE mice (n=10). Graphs are presented as mean−/+SD. ****, **, * indicate P<0.001, 0.01, 0.05. ns=not significant.
Figure 2.
Figure 2.. Inflammation in Parkin−/− and PINK1−/− mice following EE is completely rescued by loss of STING.
a) Serum IL-6 concentration from human control (HC) (n=62), PINK1 heterozygotes (P1H) (n=6), unaffected Parkin heterozygotes (UPH) (n=7), affected Parkin biallelic mutants (APB) (n=7) and idiopathic PD patients (IPD) (n=9). b) Average surface body temperature each day of the trial. Red arrows indicate retro-orbital serum sampling. Small graphs show the average daily temperature relative to the average baseline temperature (grey dashed line) (n=6). c-d) Serum IL-6 and IFNβ1 concentrations for EE mice. (n=6, baseline and post-trial immediate or n=3, post-trial, 2 days and post-trial, 6 days). Graphs are presented as mean−/+SD. ****, *** indicate P<0.001, 0.005.
Figure 3.
Figure 3.. Circulating mtDNA is elevated in Parkin−/− mice and anti-IFNAR1 treatment blocks inflammation.
a-b) Copy number/μl of cell-free mtDNA (ND1) or nuclear DNA (ACTB) in serum (n<3). c) Ratio of mtDNA to nuclear DNA (n<3). d) Average surface body temperature each day of the trial (n=6). Red arrows indicate retro-orbital sampling. e-f) Serum IL-6 and IFNβ1 concentrations for EE mice (n=6). Graphs are presented as mean−/+SD. ****, ***, **, * indicate P<0.001, 0.005, 0.01, and 0.05. ns= not significant.
Figure 4.
Figure 4.. STING loss prevents inflammation, a motor defect and neurodegeneration in the Parkin−/−;Mutator mice.
a, b) Serum IL-6 and IFNβ1 concentrations from 12-, 20-, and 40-week-old mice (n=4, 6). c) Venn diagram depicting serum cytokines found here elevated in each paradigm and those reported in idiopathic human patients (grey). d) The average time required for mice to descend the pole (n=6). e) TH+-neurons counted by stereology in the substantia nigra (SNc) of 40-week-old mice (n=3, 4). f) Representative images of TH+-neurons (green) and total neurons (NeuN, red). Graphs are presented as mean−/+SD. ****, ***, **, indicate P<0.001, 0.005, 0.01. ns=not significant.

Comment in

References

    1. Dzamko N, Geczy CL & Halliday GM Inflammation is genetically implicated in Parkinson’s disease. Neurosci. 302, 89–102 (2015) - PubMed
    1. Kitada T et al. Mutations in the parkin gene cause autosomal recessive juvenile parkinsonism. Nature 392, 605–608 (1998) - PubMed
    1. Valente EM et al. PINK1 mutations are associated with sporadic early-onset parkinsonism. Ann. Neurol 56, 336–341 (2004) - PubMed
    1. Pickrell AM & Youle RJ The roles of PINK1, Parkin, and mitochondrial fidelity in Parkinson’s Disease. Neuron 85, 257–273 (2015) - PMC - PubMed
    1. Goldberg MS et al. Parkin-deficient mice exhibit nigrostriatal deficits but not loss of dopaminergic neurons. J. Biol. Chem 278, 43628–43635 (2003) - PubMed

REFERENCES pertaining to Materials and Methods

    1. Herzig MC et al. LRRK2 protein levels are determined by kinase function and are crucial for kidney and lung homeostasis in mice. Human Mol. Genetics 20, 4209–4223, (2011). - PMC - PubMed
    1. Kujoth GC, et al. Mitochondrial DNA mutations, oxidative stress and apoptosis in mammalian aging. Science 309:481–484 (2005) - PubMed
    1. Horder M et al. International Federation of Clinical Chemistry, Scientific Division Committee on Enzymes: approved recommendation on IFCC methods for the measurement of catalytic concentration of enzymes. Part 7. IFCC method for creatine kinase (ATP: creatine N-phosphotransferase, EC 2.7.3.2). Eur. J. Clin. Chem. Clin. Biochem 29, 435–456 (1991) - PubMed
    1. Ye W et al. Accurate quantitation of circulating cell-free mitochondrial DNA in plasma by droplet digital PCR. Anal. Bioanal. Chem 409, 2727–2735 (2017). - PubMed
    1. MacLean B et al. Skyline: an open source document editor for creating and analyzing targeted proteomics experiments. Bioinformatics 26, 966–968 (2010) - PMC - PubMed

Publication types

MeSH terms