

Retinofugal Projections Into Visual Brain Structures in the Bat Artibeus planirostris: A CTb Study
- PMID: 30135648
- PMCID: PMC6092499
- DOI: 10.3389/fnana.2018.00066
Retinofugal Projections Into Visual Brain Structures in the Bat Artibeus planirostris: A CTb Study
Abstract
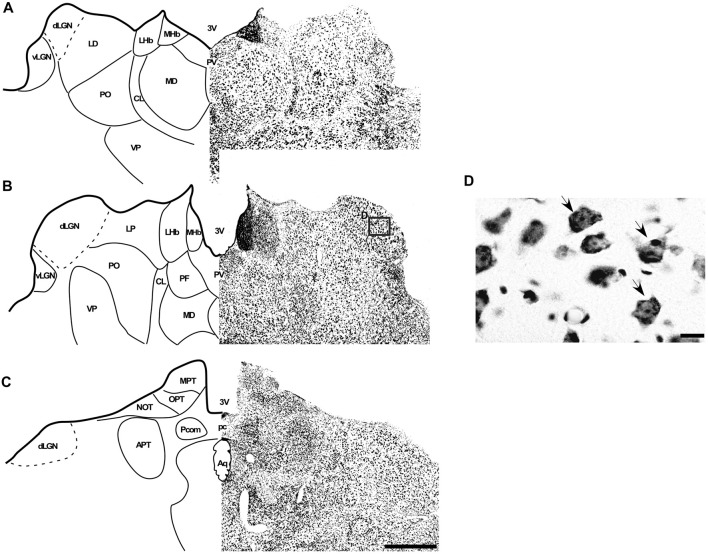
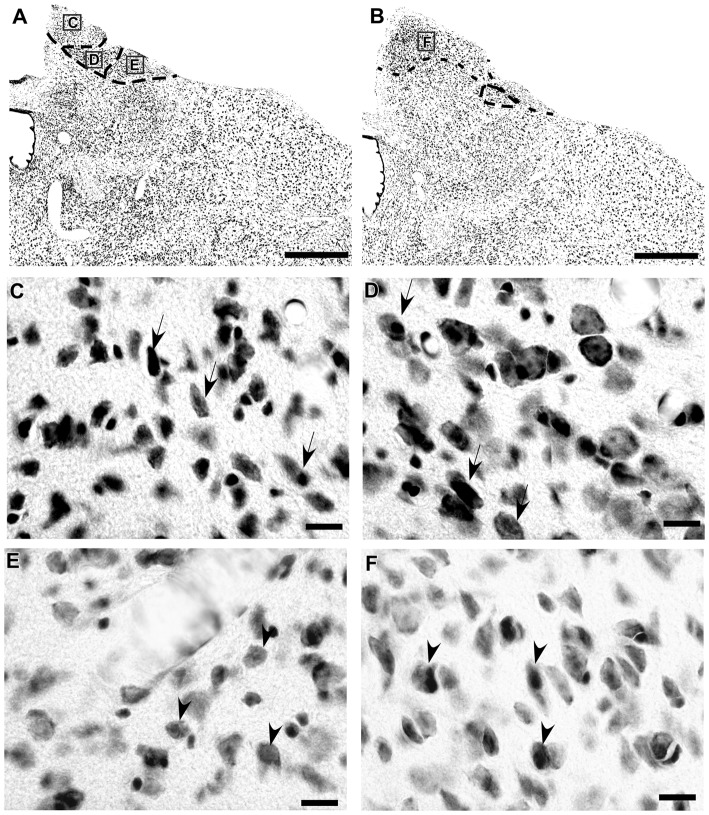
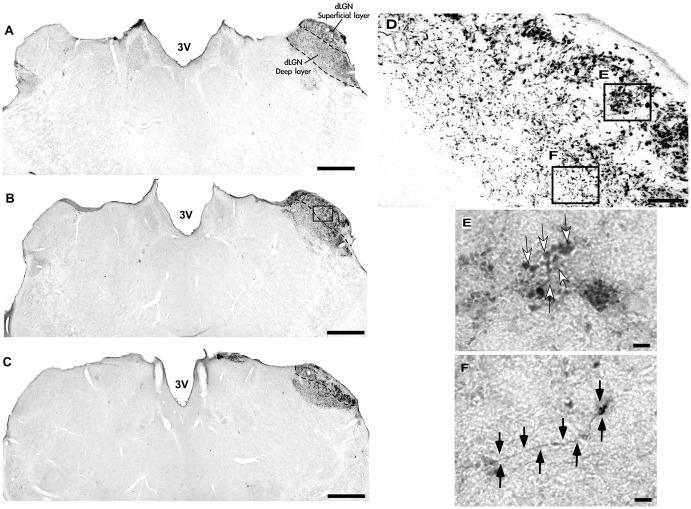
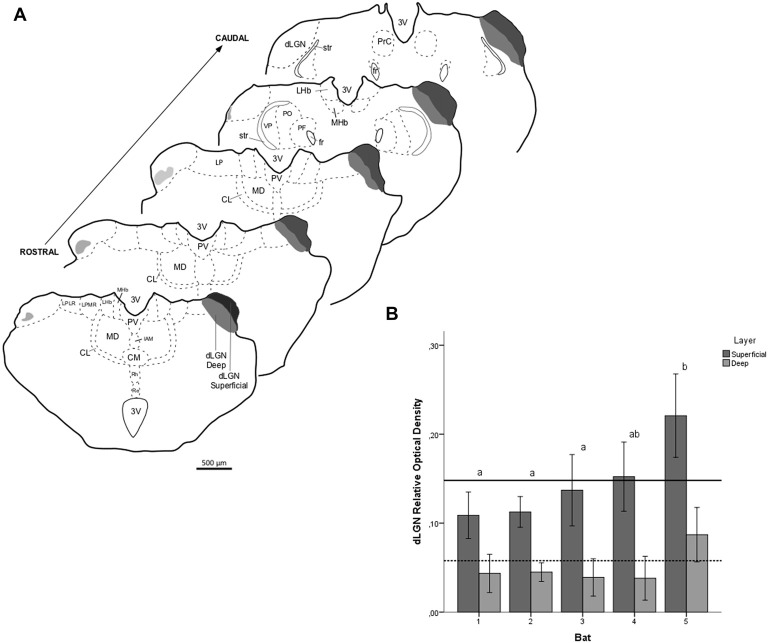
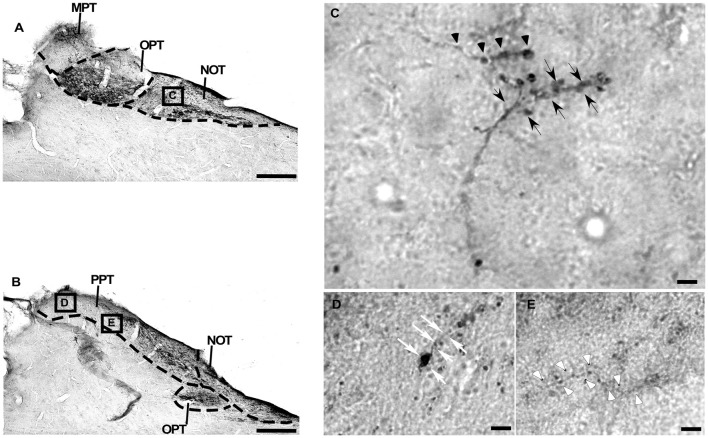
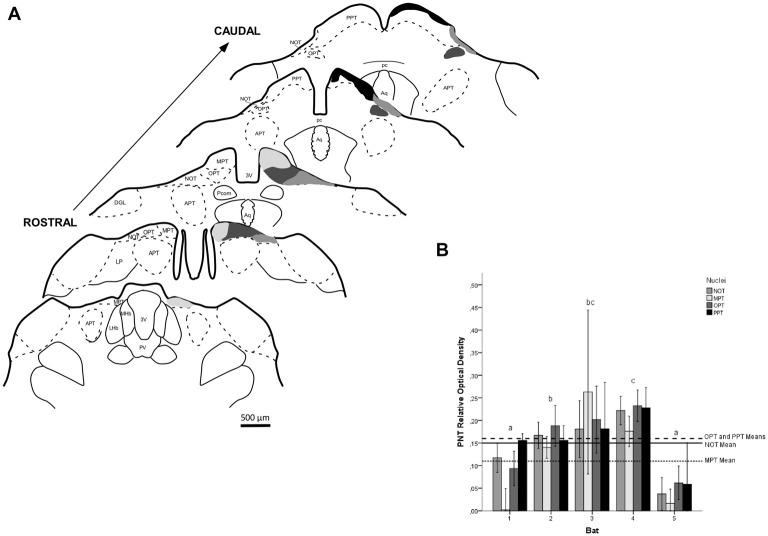
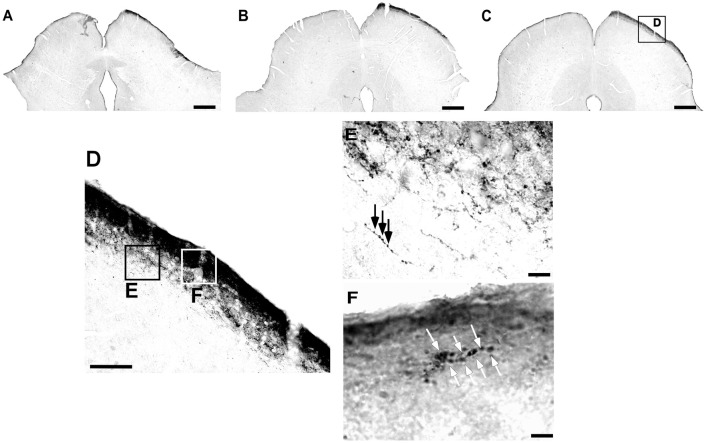
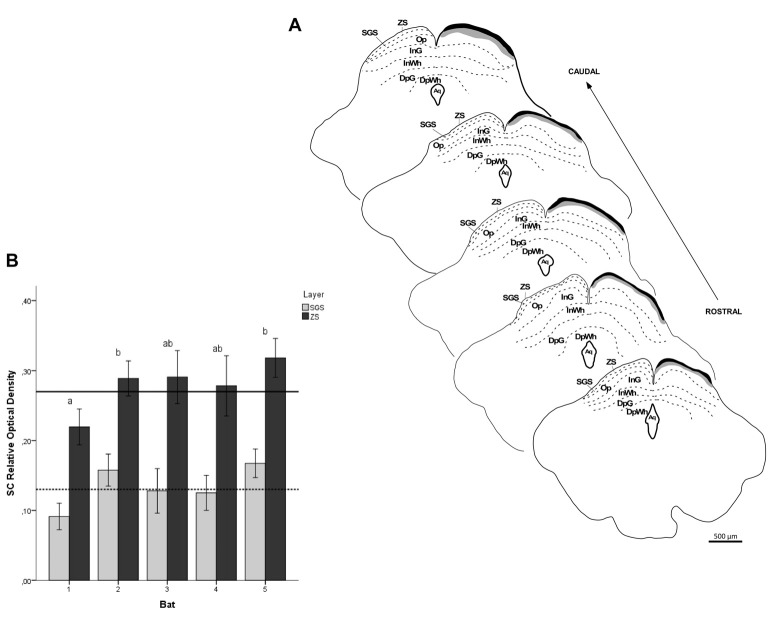
A well-developed visual system can provide significant sensory information to guide motor behavior, especially in fruit-eating bats, which usually use echolocation to navigate at high speed through cluttered environments during foraging. Relatively few studies have been performed to elucidate the organization of the visual system in bats. The present work provides an extensive morphological description of the retinal projections in the subcortical visual nuclei in the flat-faced fruit-eating bat (Artibeus planirostris) using anterograde transport of the eye-injected cholera toxin B subunit (CTb), followed by morphometrical and stereological analyses. Regarding the cytoarchitecture, the dorsal lateral geniculate nucleus (dLGN) was homogeneous, with no evident lamination. However, the retinal projection contained two layers that had significantly different marking intensities and a massive contralateral input. The superior colliculus (SC) was identified as a laminar structure composed of seven layers, and the retinal input was only observed on the contralateral side, targeting two most superficial layers. The medial pretectal nucleus (MPT), olivary pretectal nucleus (OPT), anterior pretectal nucleus (APT), posterior pretectal nucleus (PPT) and nucleus of the optic tract (NOT) were comprised the pretectal nuclear complex (PNT). Only the APT lacked a retinal input, which was predominantly contralateral in all other nuclei. Our results showed the morphometrical and stereological features of a bat species for the first time.
Keywords: chiropteran; cholera toxin subunit b; lateral geniculate nucleus; phyllostomidae; pretectal region; retinal projections; superior colliculus; visual system.
Figures


Similar articles
-
Retinal projections in the short-tailed fruit bat, Carollia perspicillata, as studied using the axonal transport of cholera toxin B subunit: Comparison with mouse.J Comp Neurol. 2015 Aug 15;523(12):1756-91. doi: 10.1002/cne.23723. Epub 2015 Jun 5. J Comp Neurol. 2015. PMID: 25503714
-
Retinal projections to the pretectum, accessory optic system and superior colliculus in pigmented and albino ferrets.Eur J Neurosci. 1993 May 1;5(5):486-500. doi: 10.1111/j.1460-9568.1993.tb00515.x. Eur J Neurosci. 1993. PMID: 8261124
-
Retinofugal projections of the big brown bat, Eptesicus fuscus and the neotropical fruit bat, Artibeus jamaicensis.Am J Anat. 1985 Feb;172(2):105-24. doi: 10.1002/aja.1001720202. Am J Anat. 1985. PMID: 2983524
-
Visual system of a naturally microphthalmic mammal: the blind mole rat, Spalax ehrenbergi.J Comp Neurol. 1993 Feb 15;328(3):313-50. doi: 10.1002/cne.903280302. J Comp Neurol. 1993. PMID: 8440785 Review.
-
Organization of subcortical pathways for sensory projections to the limbic cortex. II. Afferent projections to the thalamic lateral dorsal nucleus in the rat.J Comp Neurol. 1987 Nov 8;265(2):189-202. doi: 10.1002/cne.902650204. J Comp Neurol. 1987. PMID: 3320109 Review.
Cited by
-
Cyto- and myeloarchitectural brain atlas of the pale spear-nosed bat (Phyllostomus discolor) in CT Aided Stereotaxic Coordinates.Brain Struct Funct. 2020 Nov;225(8):2509-2520. doi: 10.1007/s00429-020-02138-y. Epub 2020 Sep 16. Brain Struct Funct. 2020. PMID: 32936343 Free PMC article.
-
Retinorecipient areas in the common marmoset (Callithrix jacchus): An image-forming and non-image forming circuitry.Front Neural Circuits. 2023 Feb 2;17:1088686. doi: 10.3389/fncir.2023.1088686. eCollection 2023. Front Neural Circuits. 2023. PMID: 36817647 Free PMC article. Review.
-
The postnatal development of retinal projections in strepsirrhine galagos (Otolemur garnettii).J Comp Neurol. 2024 Feb;532(2):e25565. doi: 10.1002/cne.25565. Epub 2023 Dec 4. J Comp Neurol. 2024. PMID: 38047381 Free PMC article.
References
-
- Altringham J. D. (2011). “Echolocation and other senses,” in Bats: From Conservation to Ecology, ed. Altringham J. D. (Oxford: University Press; ), 61–92.
-
- Altringham J. D., Fenton M. B. (2003). “Sensory ecology and communication in the Chiroptera,” in Bat Ecology, eds Kunz T. H., Fenton M. B. (Chicago, IL: University of Chicago Press; ), 90–127.
-
- Barquez R. M., Mares M. A., Braun J. K. (1999). The bats of Argentina. Spec. Publ. Mus. Tex. Tech Univ. 42, 1–275.
-
- Barros M. A. S., Morais C. M. G., Figueiredo B. M. B., Moura Júnior G. B. D., Ribeiro F. F. D. S., Pessoa D. M. A., et al. (2017). Bats (Mammalia, Chiroptera) from the Nísia Floresta National Forest, with new records for the state of Rio Grande do Norte, northeastern Brazil. Biota Neotropica 17:e20170351 10.1590/1676-0611-bn-2017-0351 - DOI
LinkOut - more resources
Full Text Sources
Other Literature Sources