. 2018 Nov;136(5):709-727.
doi: 10.1007/s00401-018-1900-5. Epub 2018 Aug 22.

Divergent brain gene expression patterns associate with distinct cell-specific tau neuropathology traits in progressive supranuclear palsy

Affiliations

Divergent brain gene expression patterns associate with distinct cell-specific tau neuropathology traits in progressive supranuclear palsy

Mariet Allen et al. Acta Neuropathol. 2018 Nov.

Abstract

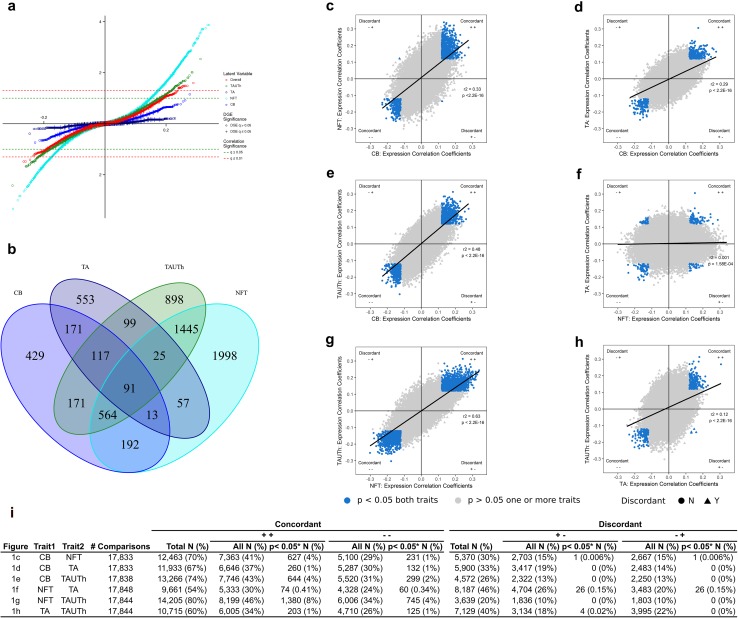
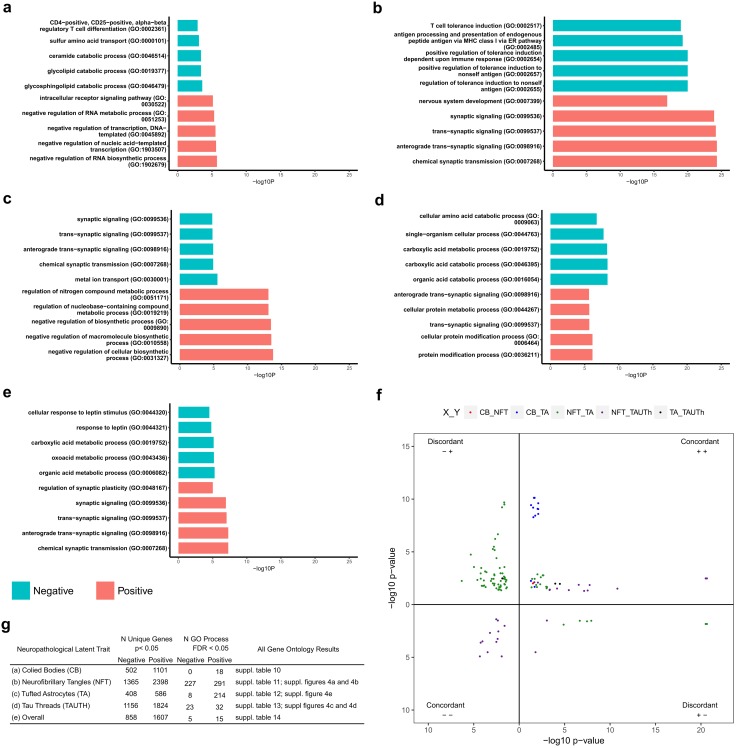
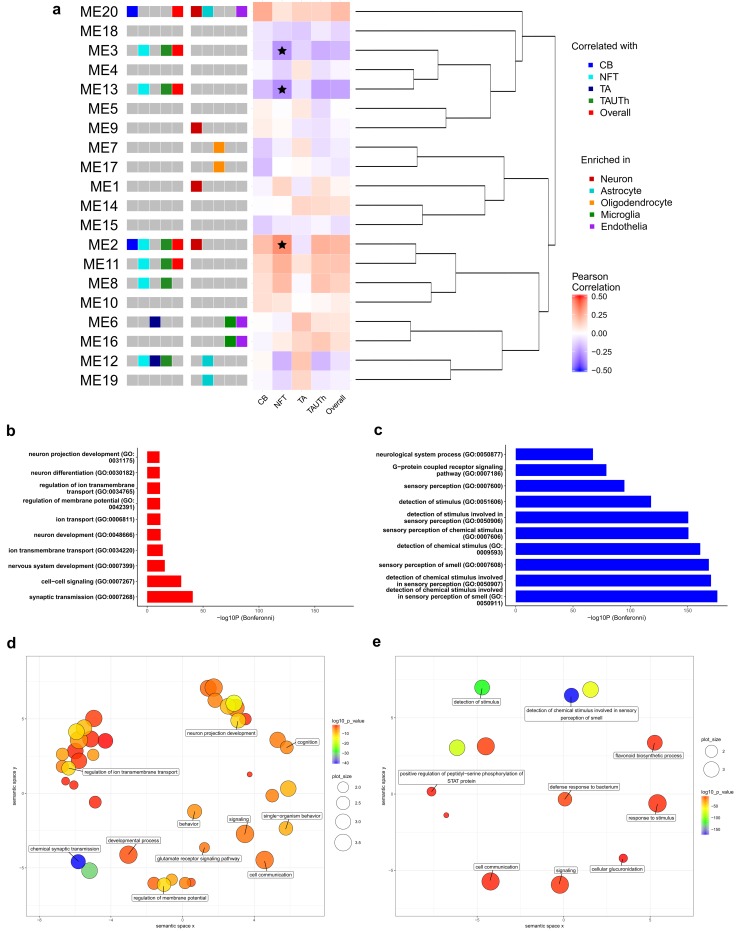
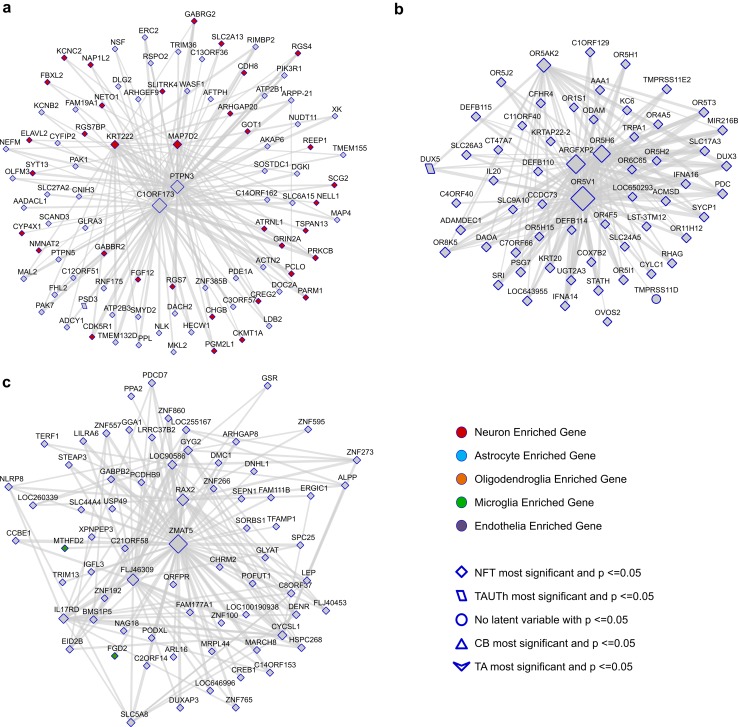
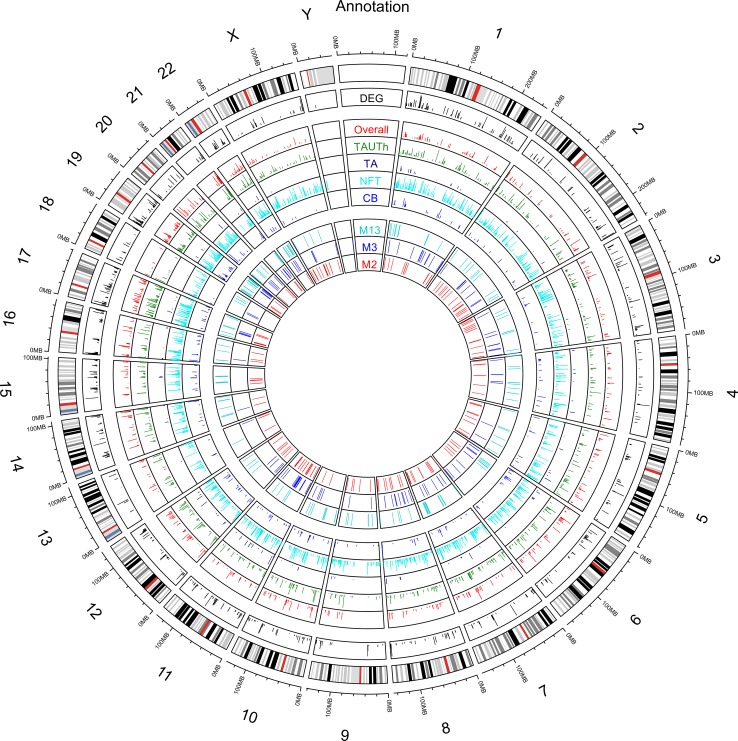
Progressive supranuclear palsy (PSP) is a neurodegenerative parkinsonian disorder characterized by tau pathology in neurons and glial cells. Transcriptional regulation has been implicated as a potential mechanism in conferring disease risk and neuropathology for some PSP genetic risk variants. However, the role of transcriptional changes as potential drivers of distinct cell-specific tau lesions has not been explored. In this study, we integrated brain gene expression measurements, quantitative neuropathology traits and genome-wide genotypes from 268 autopsy-confirmed PSP patients to identify transcriptional associations with unique cell-specific tau pathologies. We provide individual transcript and transcriptional network associations for quantitative oligodendroglial (coiled bodies = CB), neuronal (neurofibrillary tangles = NFT), astrocytic (tufted astrocytes = TA) tau pathology, and tau threads and genomic annotations of these findings. We identified divergent patterns of transcriptional associations for the distinct tau lesions, with the neuronal and astrocytic neuropathologies being the most different. We determined that NFT are positively associated with a brain co-expression network enriched for synaptic and PSP candidate risk genes, whereas TA are positively associated with a microglial gene-enriched immune network. In contrast, TA is negatively associated with synaptic and NFT with immune system transcripts. Our findings have implications for the diverse molecular mechanisms that underlie cell-specific vulnerability and disease risk in PSP.


Conflict of interest statement

The authors declare that they have no competing interests.

Figures

Fig. 1
Fig. 1
Temporal cortex gene expression levels are associated with tau neuropathology. Meta-analysis results from Cohorts A and B are presented for genes expressed in the temporal cortex tissue of PSP patients. Results for each of the latent neuropathology traits, i.e., Overall, Tau Threads (TAUTh), Tufted Astrocytes (TA), Neurofibrillary Tangles (NFT) and Coiled Bodies (CB) are shown in a scatter plot a where the X-axis represents the Pearson correlation coefficient and the Y-axis represents the q value for significance. Two significance thresholds are indicated by green (q < 0.05) and red (q < 0.01) lines. Genes that are also differentially expressed between PSP patient vs. control temporal cortex samples are indicated with a “+” and those that are not, with an open circle. b Venn diagram representing overlap in nominal associations (unadjusted p value < 0.05) between each of the four tau neuropathology traits. ch Scatter plots comparing the Pearson correlation coefficients for probe-latent trait associations, between each pair of traits, CB vs. NFT c, CB vs. TA d, CB vs. TAUTh e, NFT vs. TA f, NFT vs. TAUTh g, and TA vs. TAUTh h. The X-axis indicates the correlation coefficient for the first trait and the Y-axis the correlation coefficient for the second trait. Probes that are nominally significant (unadjusted p value < 0.05) for both traits are highlighted in blue. Probes that are concordant in direction of association for both traits are indicated as circles, and discordant probes are indicated as triangles. The direction of association with reference to the trait on the X-axis, followed by the trait on the Y-axis is indicated in each quadrant of each plot (− negative transcript-trait associations; + positive transcript-trait associations). The Pearson correlation r2 and p value for the overall comparisons of transcript associations for each pair of traits are shown on the plots. i Table summarizing the number of concordant and discordant probes for each pair of traits, split by direction of the correlation coefficient (negative or positive). Between 9 and 24 probes have a correlation coefficient of zero for a given pair of traits and are hence not counted. *columns indicate count for number of probes with a p value < 0.05 (unadjusted) for both traits
Fig. 2
Fig. 2
Temporal cortex gene expression levels associated with tau neuropathology are enriched for Gene Ontology biological processes. ae Gene Ontology bar plots for the five most significant GO terms for genes nominally associated with CB a, NFT b, TA c, TAUTh d and Overall e. The X-axis indicates the unadjusted GO term enrichment p value. Note that all GO terms shown in ae are significantly enriched at FDR < 0.05, except those for CB negative associations. f Scatter plot for GO terms (FDR < 0.05) common to two or more traits. Each point on the plot represents a single GO term, the position on the plot is determined by the enrichment p value on the X and Y-axes for trait 1 and trait 2, respectively, and as indicated in the key. Each quadrant represents one of the four combinations of direction of associations for each pair of traits with the GO-term-enriched transcripts. Upper right and lower left quadrants include the concordant positive and negative associations for trait pairs. Upper left and lower right quadrants represent discordant associations, in the negative–positive and positive–negative directions, respectively. The first direction pertains to trait 1 and the second direction to trait 2 in all quadrants. g Table summarizing the number of nominally associated unique genes with each of the neuropathology traits. The number of GO terms that are significant at false discovery rate adjusted p value < 0.05 is also shown, split by direction of the correlation coefficient (negative or positive)
Fig. 3
Fig. 3
Co-expression modules are associated with tau neuropathology and enriched for cell type marker genes and Gene Ontology biological processes. Correlation and enrichment results are presented for co-expression modules and module eigengenes. a Left to right, neuropathology barcode indicating module eigengenes (MEs) nominally associated (unadjusted p < 0.05) with CB, NFT, TA, TAUTh or Overall according to the legend in the top right. Cell type enrichment barcode indicating modules enriched for genes that are predominantly expressed in CNS cell types, color coded according to the middle right legend. Heatmap illustrating the Pearson correlation for each ME with the neuropathological traits, where Bonferroni-significant MEs are indicated with a star. Hierarchical clustering dendrogram depicting the relationship between MEs. bc Gene Ontology bar plots indicating the ten most significant GO terms for modules 2 b and 3 c. These are the Bonferroni-significant modules that also had significant GO term enrichment. de REVIGO scatter plots clustering significant (FDR < 0.05) GO terms for module 2 d and 3 e in two-dimensional space according to semantic similarities. Bubble color reflects the enrichment p value; the size of the bubble refers to the size of the GO term; labeled bubbles are the most unique terms in the cluster
Fig. 4
Fig. 4
Network plots for Cohort A co-expression modules 2, 3 and 13. Genes that have a module membership (MM) > 0.7 and are amongst the top 150 connections, based on their degree of correlation in the TOM matrix, are shown for CohortA_M2 a, CohortA_M3 b and CohortA_M13 c. The size of the nodes reflects the number of connections (edges) and the weight of the edges reflects the strength of correlation between two nodes. Nodes are shaped according to the most significant neuropathological trait (bottom right legend) and colored according to whether they are predominantly expressed in one CNS cell type (top right legend)
Fig. 5
Fig. 5
Circos plots of chromosomal locations for tau neuropathology associations. The outermost track is the ideogram of human reference genome hg19. The second outermost track shows a bar plot of − log10(p value) for genes that are differentially expressed between PSP and controls. This is limited to genes with DEG p value < 5E-03. The next panel contains five tracks of bar plots, which are the − log10 p value of association between gene expression and the following latent variables from outermost to innermost: Overall, TAUTh, TA, NFT, CB. The next panel contains 3 tracks, which indicate the 150 genes with the highest module membership from each of the neuropathology-associated modules, CohortA_M13, CohortA_M3 and CohortA_M2, from outermost to innermost, respectively

References

    1. The Gene Ontology Consortium Gene Ontology Consortium: going forward. Nucleic Acids Res. 2015;43:D1049–D1056. doi: 10.1093/nar/gku1179. - DOI - PMC - PubMed
    1. Allen M, Burgess JD, Ballard T, Serie D, Wang X, Younkin CS, Sun Z, Kouri N, Baheti S, Wang C, et al. Gene expression, methylation and neuropathology correlations at progressive supranuclear palsy risk loci. Acta Neuropathol. 2016;132:197–211. doi: 10.1007/s00401-016-1576-7. - DOI - PMC - PubMed
    1. Allen M, Carrasquillo MM, Funk C, Heavner BD, Zou F, Younkin CS, Burgess JD, Chai HS, Crook J, Eddy JA, et al. Human whole genome genotype and transcriptome data for Alzheimer’s and other neurodegenerative diseases. Sci Data. 2016;3:160089. doi: 10.1038/sdata.2016.89. - DOI - PMC - PubMed
    1. Allen M, Kachadoorian M, Quicksall Z, Zou F, Chai HS, Younkin C, Crook JE, Pankratz VS, Carrasquillo MM, Krishnan S, et al. Association of MAPT haplotypes with Alzheimer’s disease risk and MAPT brain gene expression levels. Alzheimers Res Ther. 2014;6:39. doi: 10.1186/alzrt268. - DOI - PMC - PubMed
    1. Allen M, Wang X, Burgess JD, Watzlawik J, Serie DJ, Younkin CS, Nguyen T, Malphrus KG, Lincoln S, Carrasquillo MM, et al. Conserved brain myelination networks are altered in Alzheimer’s and other neurodegenerative diseases. Alzheimers Dement. 2017;14:352–366. doi: 10.1016/j.jalz.2017.09.012. - DOI - PMC - PubMed

Publication types

MeSH terms