. 2018 Dec 1;187(12):2642-2650.
doi: 10.1093/aje/kwy181.

Ten-Year Change in Neighborhood Socioeconomic Deprivation and Rates of Total, Cardiovascular Disease, and Cancer Mortality in Older US Adults

Affiliations

Ten-Year Change in Neighborhood Socioeconomic Deprivation and Rates of Total, Cardiovascular Disease, and Cancer Mortality in Older US Adults

Qian Xiao et al. Am J Epidemiol. .

Abstract

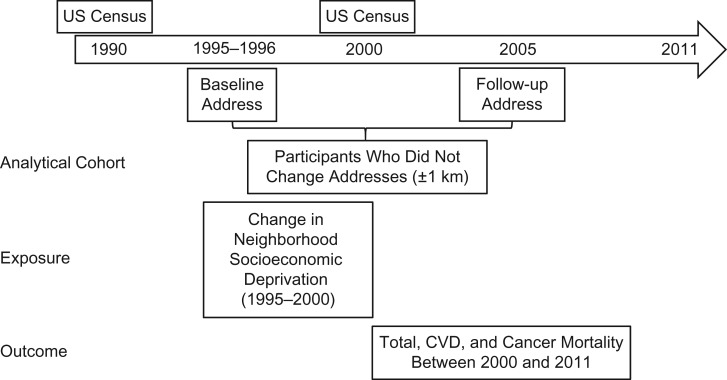
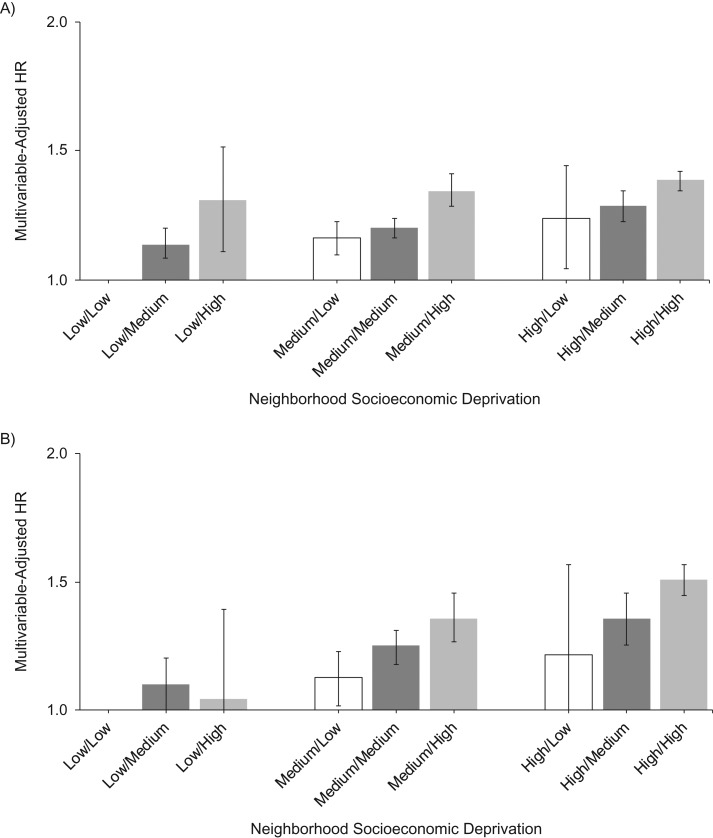
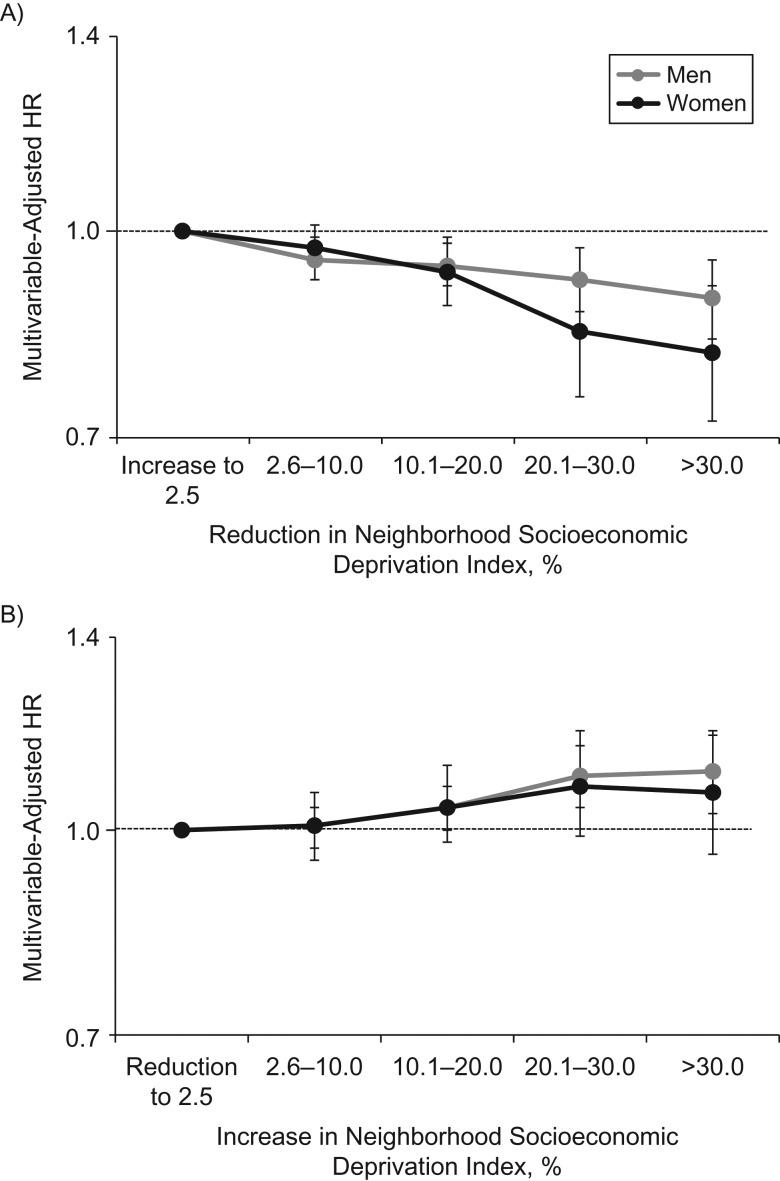
Low neighborhood socioeconomic status has been linked to adverse health outcomes. However, it is unclear whether changing the neighborhood may influence health. We examined 10-year change in neighborhood socioeconomic deprivation in relation to mortality rate among 288,555 participants aged 51-70 years who enrolled in the National Institutes of Health-AARP Diet and Health Study in 1995-1996 (baseline) and did not move during the study. Changes in neighborhood socioeconomic deprivation between 1990 and 2000 were measured by US Census data at the census tract level. All-cause, cardiovascular disease, and cancer deaths were ascertained through annual linkage to the Social Security Administration Death Master File between 2000 and 2011. Overall, our results suggested that improvement in neighborhood socioeconomic status was associated with a lower mortality rate, while deterioration was associated with a higher mortality rate. More specially, a 30-percentile-point reduction in neighborhood deprivation among more deprived neighborhoods was associated with 11% and 19% reductions in the total mortality rate among men and women, respectively. On the other hand, a 30-point increase in neighborhood deprivation in less deprived neighborhoods was associated with an 11% increase in the mortality rate among men. Our findings support a longitudinal association between changing neighborhood conditions and mortality.


Figures

Figure 1.
Figure 1.
Design of a study of the relationship between 10-year change in neighborhood socioeconomic deprivation and total, cardiovascular disease (CVD), and cancer mortality among 288,555 participants aged 51–70 years, National Institutes of Health-AARP Diet and Health Study, 1995–2011.
Figure 2.
Figure 2.
Hazard ratios (HRs) for the association between neighborhood socioeconomic deprivation in 1990 and 2000 and total mortality in men (A) and women (B), National Institutes of Health-AARP Diet and Health Study, 1995–2011. The x-axis labels present the neighborhood deprivation groups for 1990/2000; for example, “low/high” indicates low neighborhood deprivation in 1990 and high deprivation in 2000. Results were adjusted for age (50.0–54.9, 55.0–59.9, 60.0–64.9, or ≥65.0 years), race/ethnicity (non-Hispanic white, non-Hispanic black, or other), and education (<12 years, high school graduation, some college, or college graduation/postgraduate study). State of residence (California, Florida, Georgia, Louisiana, Michigan, North Carolina, New Jersey, or Pennsylvania) was included as a random effect. Vertical lines represent 95% confidence intervals. The “low/low” group served as the reference group.
Figure 3.
Figure 3.
Sex-specific hazard ratios (HRs) for the association between change in neighborhood socioeconomic deprivation between 1990 and 2000 and total mortality, National Institutes of Health-AARP Diet and Health Study, 1995–2011. Part A shows the association between a reduction in neighborhood deprivation and mortality among participants from a more deprived neighborhood in 1990 (neighborhood socioeconomic deprivation index > median), and the reference group included neighborhoods that had increases in deprivation, no change in deprivation, or a slight reduction in deprivation (up to 2.5%). Part B shows the association between an increase in neighborhood deprivation and mortality among participants from a less deprived neighborhood in 1990 (neighborhood socioeconomic deprivation index ≤ median), and the reference group included neighborhoods that had reductions in deprivation, no change in deprivation, or a slight increase in deprivation (up to 2.5%). Results were adjusted for age (50.0–54.9, 55.0–59.9, 60.0–64.9, or ≥65.0 years), race/ethnicity (non-Hispanic white, non-Hispanic black, or other), and education (<12 years, high school graduation, some college, or college graduation/postgraduate study). State of residence (California, Florida, Georgia, Louisiana, Michigan, North Carolina, New Jersey, or Pennsylvania) was included as a random effect. Vertical lines represent 95% confidence intervals.

References

    1. Diez Roux AV. Investigating neighborhood and area effects on health. Am J Public Health. 2001;91(11):1783–1789. - PMC - PubMed
    1. Major JM, Doubeni CA, Freedman ND, et al. . Neighborhood socioeconomic deprivation and mortality: NIH-AARP Diet and Health Study. PLoS One. 2010;5(11):e15538. - PMC - PubMed
    1. Doubeni CA, Laiyemo AO, Major JM, et al. . Socioeconomic status and the risk of colorectal cancer: an analysis of more than a half million adults in the National Institutes of Health-AARP Diet and Health Study. Cancer. 2012;118(14):3636–3644. - PMC - PubMed
    1. Signorello LB, Cohen SS, Williams DR, et al. . Socioeconomic status, race, and mortality: a prospective cohort study. Am J Public Health. 2014;104(12):e98–e107. - PMC - PubMed
    1. Bethea TN, Palmer JR, Rosenberg L, et al. . Neighborhood socioeconomic status in relation to all-cause, cancer, and cardiovascular mortality in the Black Women’s Health Study. Ethn Dis. 2016;26(2):157–164. - PMC - PubMed

Publication types