

Left ventricular thrombus formation in myocardial infarction is associated with altered left ventricular blood flow energetics
- PMID: 30137274
- PMCID: PMC6302263
- DOI: 10.1093/ehjci/jey121
Left ventricular thrombus formation in myocardial infarction is associated with altered left ventricular blood flow energetics
Erratum in
-
Corrigendum to: Left ventricular thrombus formation in myocardial infarction is associated with altered left ventricular blood flow energetics.Eur Heart J Cardiovasc Imaging. 2019 Jan 1;20(1):117. doi: 10.1093/ehjci/jey148. Eur Heart J Cardiovasc Imaging. 2019. PMID: 30272194 Free PMC article. No abstract available.
Abstract
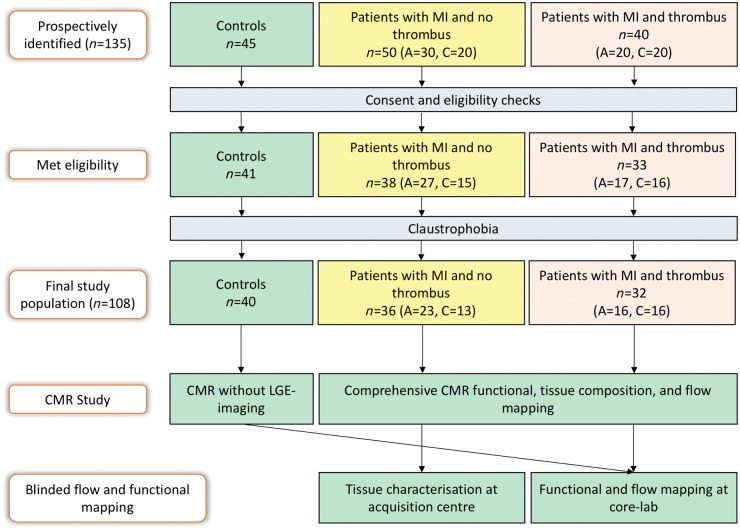
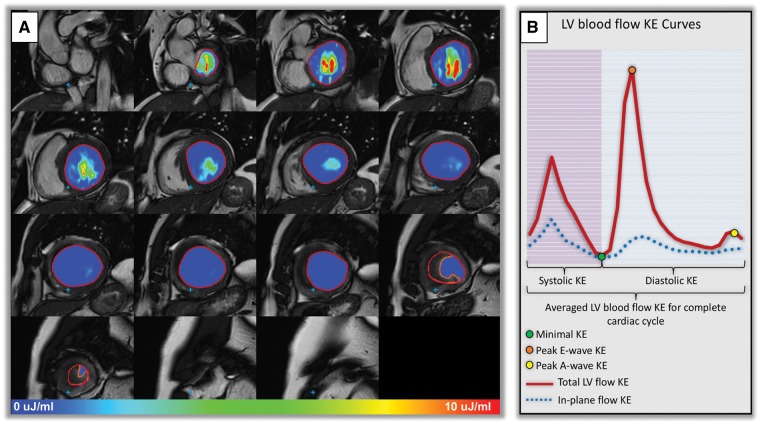
Aims: The main aim of this study was to characterize changes in the left ventricular (LV) blood flow kinetic energy (KE) using four-dimensional (4D) flow cardiovascular magnetic resonance imaging (CMR) in patients with myocardial infarction (MI) with/without LV thrombus (LVT).
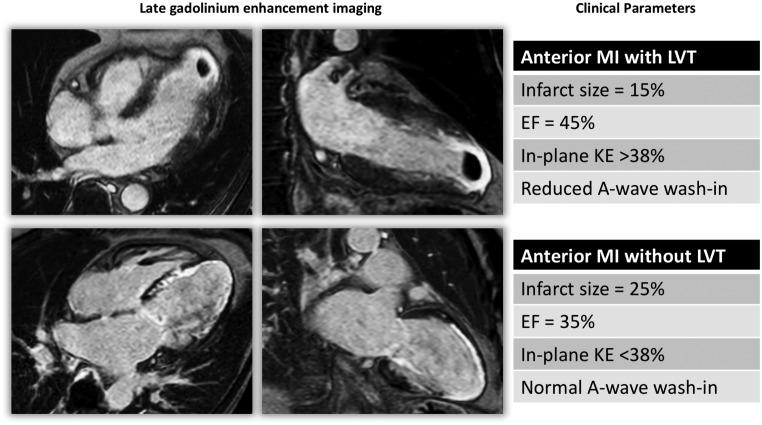
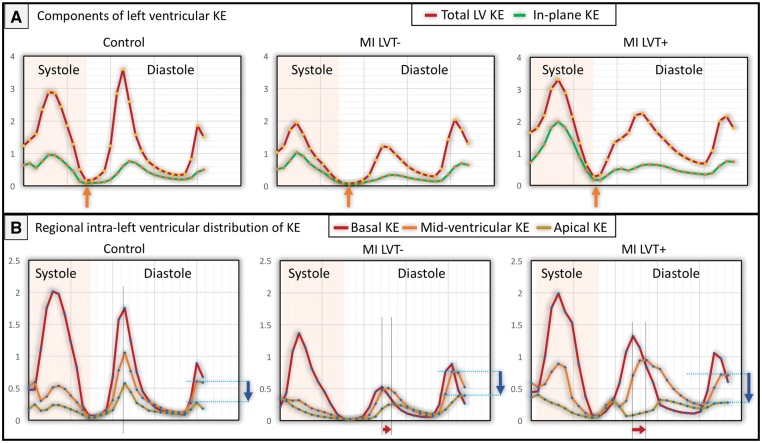
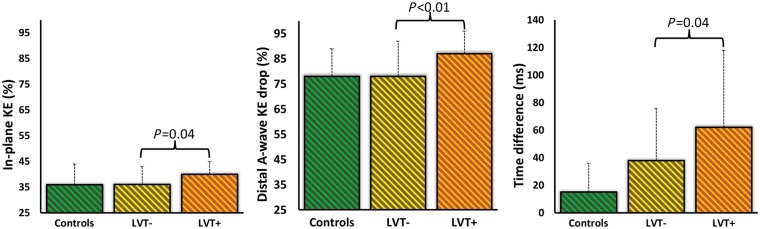
Methods and results: This is a prospective cohort study of 108 subjects [controls = 40, MI patients without LVT (LVT- = 36), and MI patients with LVT (LVT+ = 32)]. All underwent CMR including whole-heart 4D flow. LV blood flow KE wall calculated using the formula: KE=12 ρblood . Vvoxel . v2, where ρ = density, V = volume, v = velocity, and was indexed to LV end-diastolic volume. Patient with MI had significantly lower LV KE components than controls (P < 0.05). LVT+ and LVT- patients had comparable infarct size and apical regional wall motion score (P > 0.05). The relative drop in A-wave KE from mid-ventricle to apex and the proportion of in-plane KE were higher in patients with LVT+ compared with LVT- (87 ± 9% vs. 78 ± 14%, P = 0.02; 40 ± 5% vs. 36 ± 7%, P = 0.04, respectively). The time difference of peak E-wave KE demonstrated a significant rise between the two groups (LVT-: 38 ± 38 ms vs. LVT+: 62 ± 56 ms, P = 0.04). In logistic-regression, the relative drop in A-wave KE (beta = 11.5, P = 0.002) demonstrated the strongest association with LVT.
Conclusion: Patients with MI have reduced global LV flow KE. Additionally, MI patients with LVT have significantly reduced and delayed wash-in of the LV. The relative drop of distal intra-ventricular A-wave KE, which represents the distal late-diastolic wash-in of the LV, is most strongly associated with the presence of LVT.
Figures

Similar articles
-
Evaluation of left ventricular blood flow kinetic energy in patients with acute myocardial infarction by 4D Flow MRI: a preliminary study.BMC Med Imaging. 2024 Jun 5;24(1):131. doi: 10.1186/s12880-024-01310-8. BMC Med Imaging. 2024. PMID: 38840059 Free PMC article.
-
Left ventricular blood flow kinetic energy after myocardial infarction - insights from 4D flow cardiovascular magnetic resonance.J Cardiovasc Magn Reson. 2018 Aug 30;20(1):61. doi: 10.1186/s12968-018-0483-6. J Cardiovasc Magn Reson. 2018. PMID: 30165869 Free PMC article.
-
Left ventricular four-dimensional blood flow distribution, energetics, and vorticity in chronic myocardial infarction patients with/without left ventricular thrombus.Eur J Radiol. 2022 May;150:110233. doi: 10.1016/j.ejrad.2022.110233. Epub 2022 Mar 3. Eur J Radiol. 2022. PMID: 35278980
-
Optimal Use of Echocardiography in Management of Thrombosis After Anterior Myocardial Infarction.Echocardiography. 2020 Aug;37(8):1287-1295. doi: 10.1111/echo.14808. Epub 2020 Aug 5. Echocardiography. 2020. PMID: 32757422 Review.
-
Management of left ventricular thrombus: a narrative review.Ann Transl Med. 2021 Mar;9(6):520. doi: 10.21037/atm-20-7839. Ann Transl Med. 2021. PMID: 33850917 Free PMC article. Review.
Cited by
-
Left ventricular thrombus after acute ST-segment elevation myocardial infarction: multi-parametric cardiac magnetic resonance imaging with long-term outcomes.Int J Cardiovasc Imaging. 2022 Nov;38(11):2373-2384. doi: 10.1007/s10554-022-02598-9. Epub 2022 Mar 27. Int J Cardiovasc Imaging. 2022. PMID: 36434326
-
Cardiac MR modelling of systolic and diastolic blood pressure.Open Heart. 2023 Dec 18;10(2):e002484. doi: 10.1136/openhrt-2023-002484. Open Heart. 2023. PMID: 38114194 Free PMC article.
-
Clinical Translation of Three-Dimensional Scar, Diffusion Tensor Imaging, Four-Dimensional Flow, and Quantitative Perfusion in Cardiac MRI: A Comprehensive Review.Front Cardiovasc Med. 2021 Jul 7;8:682027. doi: 10.3389/fcvm.2021.682027. eCollection 2021. Front Cardiovasc Med. 2021. PMID: 34307496 Free PMC article. Review.
-
Evaluation of left ventricular blood flow kinetic energy in patients with acute myocardial infarction by 4D Flow MRI: a preliminary study.BMC Med Imaging. 2024 Jun 5;24(1):131. doi: 10.1186/s12880-024-01310-8. BMC Med Imaging. 2024. PMID: 38840059 Free PMC article.
-
Ventricular mural thrombi - An occult occurrence?J Postgrad Med. 2024 Jan-Mar;70(1):29-35. doi: 10.4103/jpgm.jpgm_389_23. J Postgrad Med. 2024. PMID: 38197592 Free PMC article.
References
-
- Vaitkus PT, Barnathan ES.. Embolic potential, prevention and management of mural thrombus complicating anterior myocardial infarction: a meta-analysis. J Am Coll Cardiol 1993;22:1004–9. - PubMed
-
- Solheim S, Seljeflot I, Lunde K, Bjørnerheim R, Aakhus S, Forfang K. et al. Frequency of left ventricular thrombus in patients with anterior wall acute myocardial infarction treated with percutaneous coronary intervention and dual antiplatelet therapy. Am J Cardiol 2010;106:1197–200. - PubMed
-
- Visser CA, Kan G, Meltzer RS, Dunning AJ, Roelandt J.. Embolic potential of left ventricular thrombus after myocardial infarction: a two-dimensional echocardiographic study of 119 patients. J Am Coll Cardiol 1985;5:1276–80. - PubMed
-
- Celik S, Baykan M, Erdöl C, Gökce M, Durmus İ, Örem C. et al. Doppler-derived mitral deceleration time as an early predictor of left ventricular thrombus after first anterior acute myocardial infarction. Am Heart J 2000;140:772–6. - PubMed
-
- Maze SS, Kotler MN, Parry WR.. Flow characteristics in the dilated left ventricle with thrombus: qualitative and quantitative Doppler analysis. J Am Coll Cardiol 1989;13:873–81. - PubMed
Publication types
MeSH terms
Substances
Grants and funding
LinkOut - more resources
Full Text Sources
Other Literature Sources
Medical
Molecular Biology Databases
Miscellaneous
