. 2018 Dec 1;27(23):4077-4093.
doi: 10.1093/hmg/ddy301.

MeCP2 isoform e1 mutant mice recapitulate motor and metabolic phenotypes of Rett syndrome

Affiliations

MeCP2 isoform e1 mutant mice recapitulate motor and metabolic phenotypes of Rett syndrome

Annie Vogel Ciernia et al. Hum Mol Genet. .

Abstract

Mutations in the X-linked gene MECP2 cause the majority of Rett syndrome (RTT) cases. Two differentially spliced isoforms of exons 1 and 2 (MeCP2-e1 and MeCP2-e2) contribute to the diverse functions of MeCP2, but only mutations in exon 1, not exon 2, are observed in RTT. We previously described an isoform-specific MeCP2-e1-deficient male mouse model of a human RTT mutation that lacks MeCP2-e1 while preserving expression of MeCP2-e2. However, RTT patients are heterozygous females that exhibit delayed and progressive symptom onset beginning in late infancy, including neurologic as well as metabolic, immune, respiratory and gastrointestinal phenotypes. Consequently, we conducted a longitudinal assessment of symptom development in MeCP2-e1 mutant females and males. A delayed and progressive onset of motor impairments was observed in both female and male MeCP2-e1 mutant mice, including hind limb clasping and motor deficits in gait and balance. Because these motor impairments were significantly impacted by age-dependent increases in body weight, we also investigated metabolic phenotypes at an early stage of disease progression. Both male and female MeCP2-e1 mutants exhibited significantly increased body fat compared to sex-matched wild-type littermates prior to weight differences. Mecp2e1-/y males exhibited significant metabolic phenotypes of hypoactivity, decreased energy expenditure, increased respiratory exchange ratio, but decreased food intake compared to wild-type. Untargeted analysis of lipid metabolites demonstrated a distinguishable profile in MeCP2-e1 female mutant liver characterized by increased triglycerides. Together, these results demonstrate that MeCP2-e1 mutation in mice of both sexes recapitulates early and progressive metabolic and motor phenotypes of human RTT.


Figures
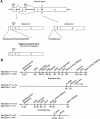
Figure 1
Figure 1
MeCP2-e1 isoform splicing and experimental design. (A) The Mecp2 transcript is alternatively spliced into the e1 and e1 isoforms with different N-terminals (amino acid sequence listed). MeCP2-e1 mutant mice have a single-nucleotide substitution that results in a loss of the start codon (ATG–TTG mutation) and no translation of the MeCP2-e1 protein. The MeCP2-e2 isoform is still transcribed and translated. (B) The timeline for behavioral, CLAMS, DEXA and lipidomics analysis of MeCP2e1 mutant females (Mecp2e1-/+) and wild-type littermates (MeCP2e1+/+) and mutant males (MeCP2e1-/y) and wild-type littermates (MeCP2e1+/y).
Figure 2
Figure 2
Symptom development across age in male and female MeCP2e1 mutant mice. Hind limb clasping was assessed weekly using a rating scale from 0 (no clasping) to 5 (severe). Data were analyzed using an exact binomial test that tests whether there were significantly more mutant animals with clasping scores > 0 for each time point (PND). P-values were Benjamini–Hochberg corrected across time points. (A) Hind limb clasping in females. (B) Hind limb clasping in males. Body weight (grams) was taken weekly across development and analyzed by linear mixed effects model (see methods) and Benjamini–Hochberg corrected comparisons were conducted between genotypes for each PND. (C) Body weight in females. (D) Body weight in males. * mutant versus wild-type corrected P-value < 0.05, statistical tests are shown in detail in Supplementary Material Table S2. Mean +/− standard error of the mean (SEM).
Figure 3
Figure 3
Female mutant mice show impairments in gait in early development. (A)Mecp2e1-/+ mice show decreased stride length at both PND 60 and 144. Impairments measures of front base (B), hind base (C) and paw separation (D) only were significantly altered at PND 60. Mean +/− SEM. *P < 0.05 Benjamini–Hochberg corrected comparisons between genotypes, statistical tests shown in detail in Supplementary Material, Table S3.
Figure 4
Figure 4
Female mutant mice show impairments in motor tasks. (A)Mecp2e1-/+ mice show increased latency to transverse beam 3 (smallest diameter) at PND 88. (B)Mecp2e1-/+ mice show increased latency to transverse beam 1 (largest diameter) at PND 152. (C)Mecp2e1-/+ mice show similar performance to wild-type littermates on the accelerating rotarod across 3 days of training at PND 62. (D)Mecp2e1-/+ mice show a decreased ability to remain on the accelerating rotarod (shorter latency) compared to wild-type littermates across 3 days of training at PND 140. Mean +/− SEM. *P < 0.05 Benjamini–Hochberg corrected comparisons between genotypes, statistical tests shown in detail in Supplementary Material, Table S3.
Figure 5
Figure 5
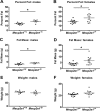
DEXA analysis reveals body composition alterations for Mecp2e1 mutant mice. For these studies, Mecp2e1+/y (N = 9), Mecp2e1-/y (N = 8) (PND 62–71), Mecp2e1-/+ (N = 11) and Mecp2e1+/+ (N = 12) (PND 92) were analyzed. (A) A significant (P = 0.00096) elevation for percent fat in Mecp2e1-/y compared to control Mecp2e1-/ mice is shown. (B) A significant (P = 0.0183) elevation in percent fat for Mecp2e1-/+ compared to control Mecp2e1+/+ littermates. (C) Fat mass in grams is elevated in Mecp2e1-/y (P = 0.028) and (D)Mecp2e1-/+ (P = 0.0077) compared to Mecp2e1+/y and Mecp2e1+/+ control littermates, respectively. (E) Weights are comparable between Mecp2e1+/y and Mecp2e1-/y mice (P = 0.2). (F)Mecp2e1+/+ and Mecp2e1-/+ mice have similar weights at the time of DEXA (P = 0.07). P-values were computed using an unpaired, two-tailed student’s t-test. * = P-value < 0.050. Error bars correspond to SEM.
Figure 6
Figure 6
Mecp2e1-/y mice consume less calories during the light phase. (A) A significant (P = 0.0173) reduction for total cumulative food intake for 48 h represented as kilocalories per 48 h (kcal/48 h) between Mecp2e1+/y control and Mecp2e1-/y groups is shown. (B) Total cumulative food intake is comparable between Mecp2e1-/+ and Mecp2e1+/+ control littermates. (C) Sum food intake during the light phase reveals a significant reduction (P = 0.0007) in Mecp2e1-/y compared to Mecp2e1+/y littermate controls. (D) Sum food intake in the light phase is similar in Mecp2e1-/+ and Mecp2e1+/+ control littermates. For these studies, Mecp2e1+/y (N = 9), Mecp2e1-/y (N = 8), Mecp2e1-/+(N = 11) and Mecp2e1+/+ (N = 12) were analyzed. P-values were computed using an unpaired, two-tailed student’s t-test. * P < 0.05.
Figure 7
Figure 7
Mecp2e1-/y mice show reduced locomotion. (A) A significant (P = 0.023) reduction for total 48 h cumulative X beam breaks between Mecp2e1+/y control and Mecp2e1-/y groups is shown. (B) Total 48 h cumulative X beam breaks show a trend toward reduction in Mecp2e1-/+ compared to Mecp2e1+/+ controls. (C) Total 48 h cumulative X beam break analysis reveals a significant reduction (P = 0.013) in Mecp2e1-/y mice compared to Mecp2e1+/y control littermates. (D) A trend toward reduction in total 48 h X ambulation in Mecp2e1-/+ mice compared to Mecp2e1+/+ controls is observed. For these studies, Mecp2e1+/y (N = 9), Mecp2e1-/y (N = 8), Mecp2e1-/+ (N = 11) and Mecp2e1+/+ (N = 12) were analyzed. P-values were computed using an unpaired, two-tailed student’s t-test. * P < 0.05.
Figure 8
Figure 8
Mecp2e1-/y mice have elevated RER and reduced energy expenditure. (A) Average RER (AVE RER) shows elevation (P = 0.0368) in Mecp2e1-/y (N = 8) compared to littermate controls Mecp2e1+/y (N = 9). (B) AVE RER is similar between Mecp2e1-/+ (N = 11) and Mecp2e1+/+ (N = 12) control littermates. (C) Average energy expenditure (AVE Heat) for Mecp2e1-/y mice (N = 8) is significantly reduced (P = 0.00194) compared to controls Mecp2e1+/y (N = 9). (D) Average energy expenditure was similar between Mecp2e1+/+ control (N = 12) and Mec2pe1-/+ (N = 11) mice. P-values were computed using an unpaired, two-tailed student’s t-test. * P < 0.05.
Figure 9
Figure 9
Untargeted lipid profiling analyses of Mecp2e1-/+ liver indicate elevated triglycerides. (A) PLS-DA shows a clear separation between Mecp2e1-/+ samples (green, N = 8) and control littermate Mecp2e1+/+ (red, N = 7) female liver samples based on untargeted lipid profiling. (B) A volcano plot of fold change (FC) (X axis) and raw P-values of genotype differences based on lipid abundance determined by mass spectroscopic analysis. Pink circles represent lipids with a log2 FC > 1.0 and a top raw P-values rank, with the identities of the know lipids shown in (C). Of the known lipids, triglycerides were the most represented category of lipids that had elevated abundance in Mecp2e1-/+ liver samples compared to control liver samples.

Similar articles

Cited by

References

    1. Mnatzakanian G.N., Lohi H., Munteanu I., Alfred S.E., Yamada T., MacLeod P.J.M., Jones J.R., Scherer S.W., Schanen N.C., Friez M.J. et al. (2004) A previously unidentified MECP2 open reading frame defines a new protein isoform relevant to Rett syndrome. Nat. Genet., 36, 339–341. - PubMed
    1. Gianakopoulos P.J., Zhang Y., Pencea N., Orlic-Milacic M., Mittal K., Windpassinger C., White S.J., Kroisel P.M., Chow E.W.C., Saunders C.J. et al. (2012) Mutations in MECP2 exon 1 in classical Rett patients disrupt MECP2_e1 transcription, but not transcription of MECP2_e2. Am. J. Med. Genet. Part B Neuropsychiatr. Genet., 159B, 210–216. - PubMed
    1. Saunders C.J., Minassian B.E., Chow E.W.C., Zhao W. and Vincent J.B. (2009) Novel exon 1 mutations in MECP2 implicate isoform MeCP2-e1 in classical Rett syndrome. Am. J. Med. Genet. Part A, 149, 1019–1023. - PubMed
    1. Kriaucionis S. and Bird A. (2004) The major form of MeCP2 has a novel N-terminus generated by alternative splicing. Nucleic Acids Res., 32, 1818–1823. - PMC - PubMed
    1. Yasui D.H., Gonzales M.L., Aflatooni J.O., Crary F.K., Hu D.J., Gavino B.J., Golub M.S., Vincent J.B., Schanen N.C., Olson C.O. et al. (2014) Mice with an isoform-ablating Mecp2 exon 1 mutation recapitulate the neurologic deficits of Rett syndrome. Hum. Mol. Genet., 23, 1–12. - PMC - PubMed

Publication types