

Negative regulation of Candida glabrata Pdr1 by the deubiquitinase subunit Bre5 occurs in a ubiquitin independent manner
- PMID: 30137659
- PMCID: PMC6348483
- DOI: 10.1111/mmi.14109
Negative regulation of Candida glabrata Pdr1 by the deubiquitinase subunit Bre5 occurs in a ubiquitin independent manner
Abstract
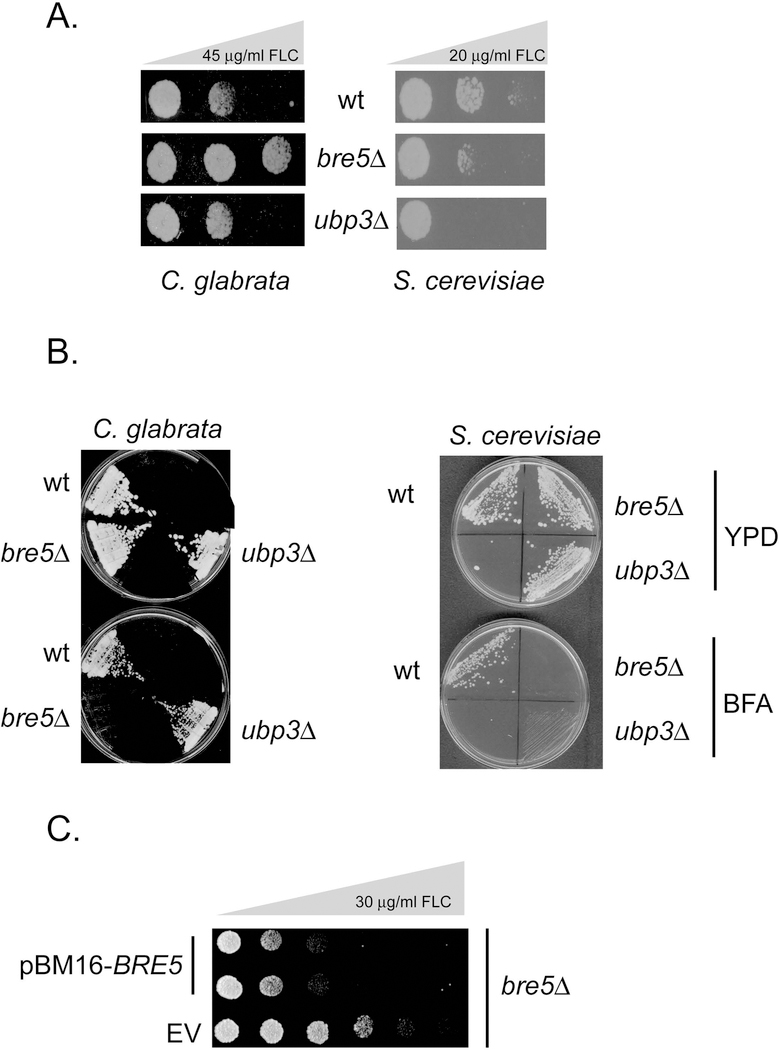
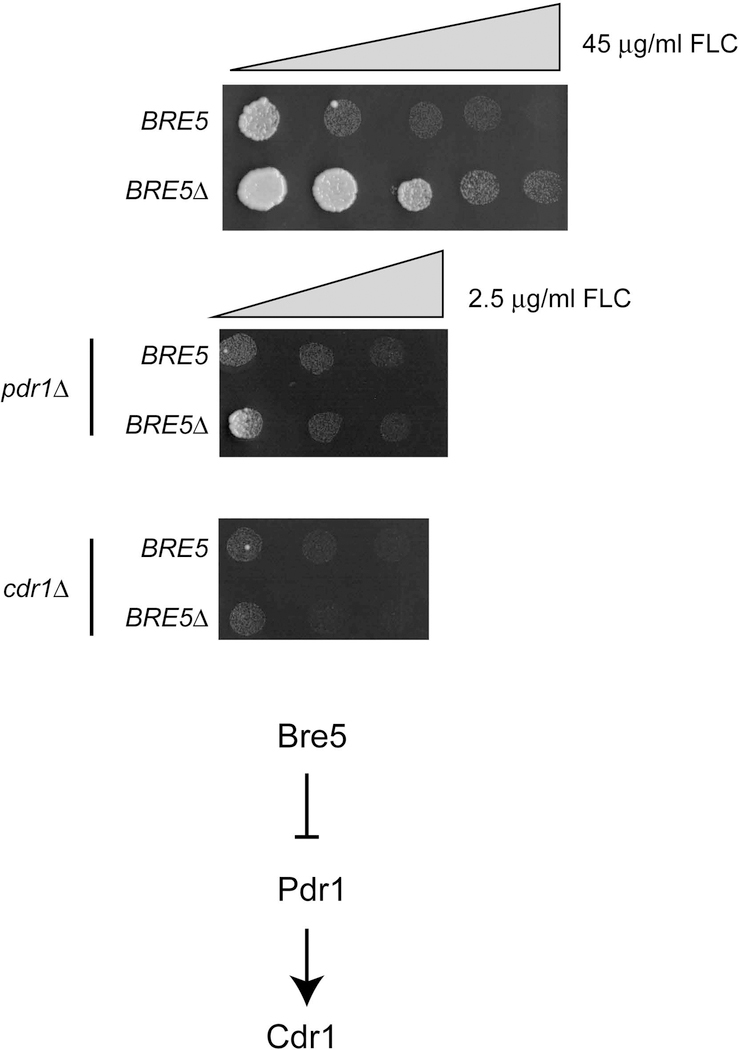
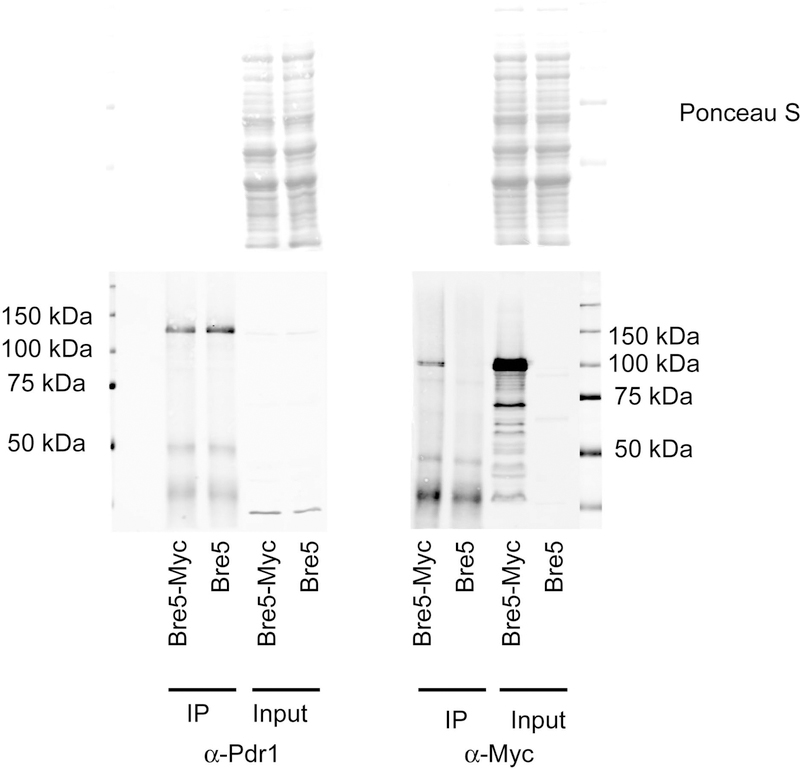
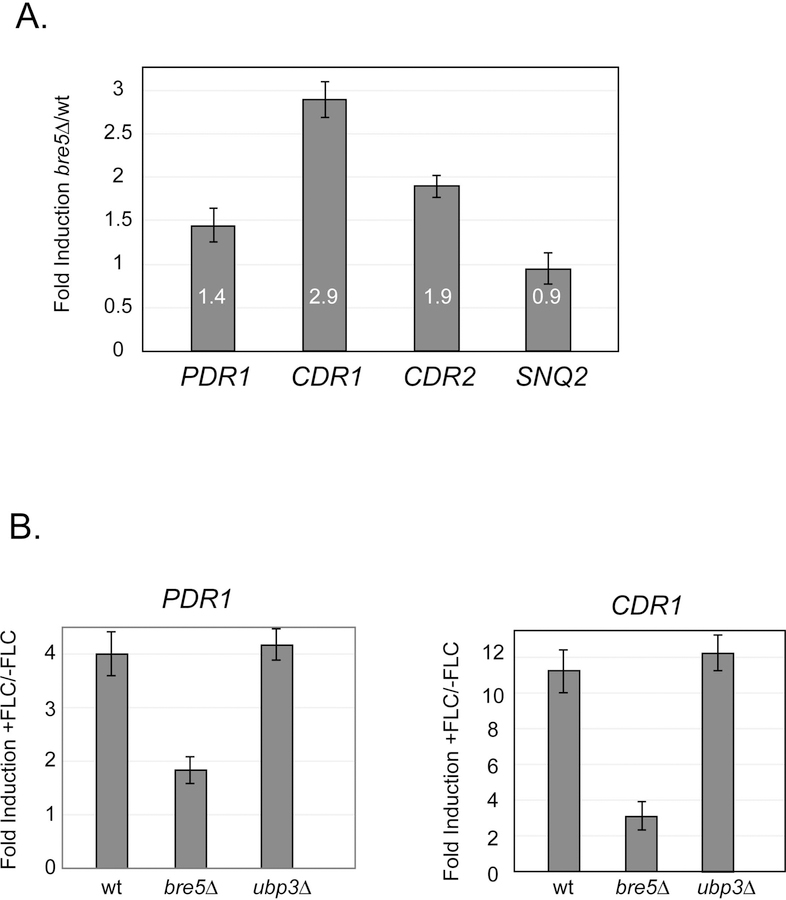
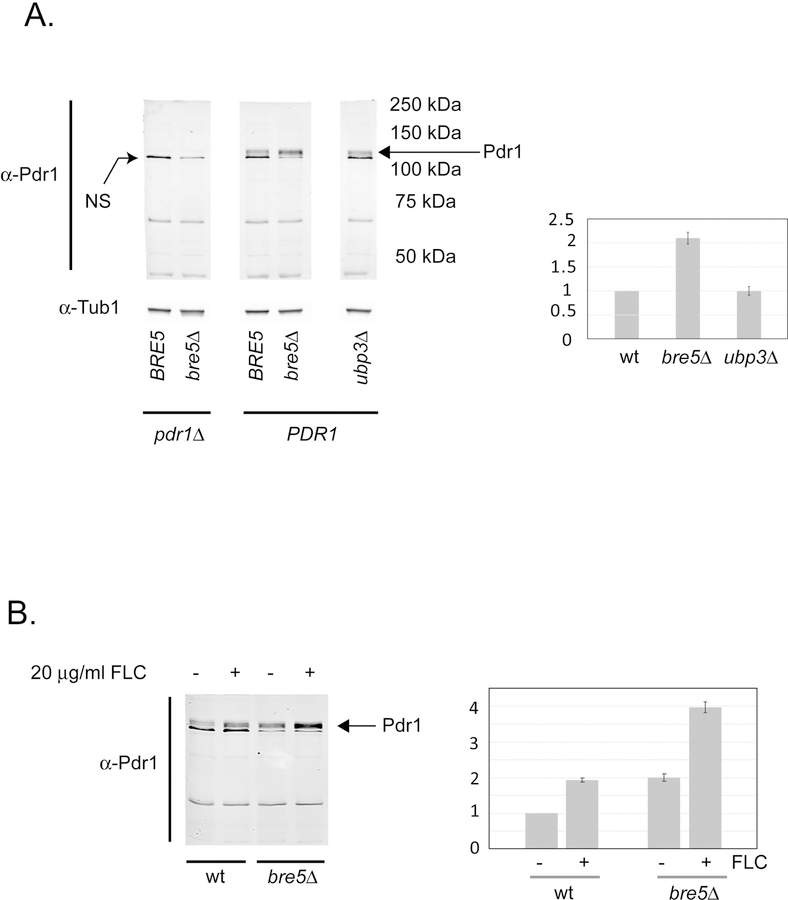
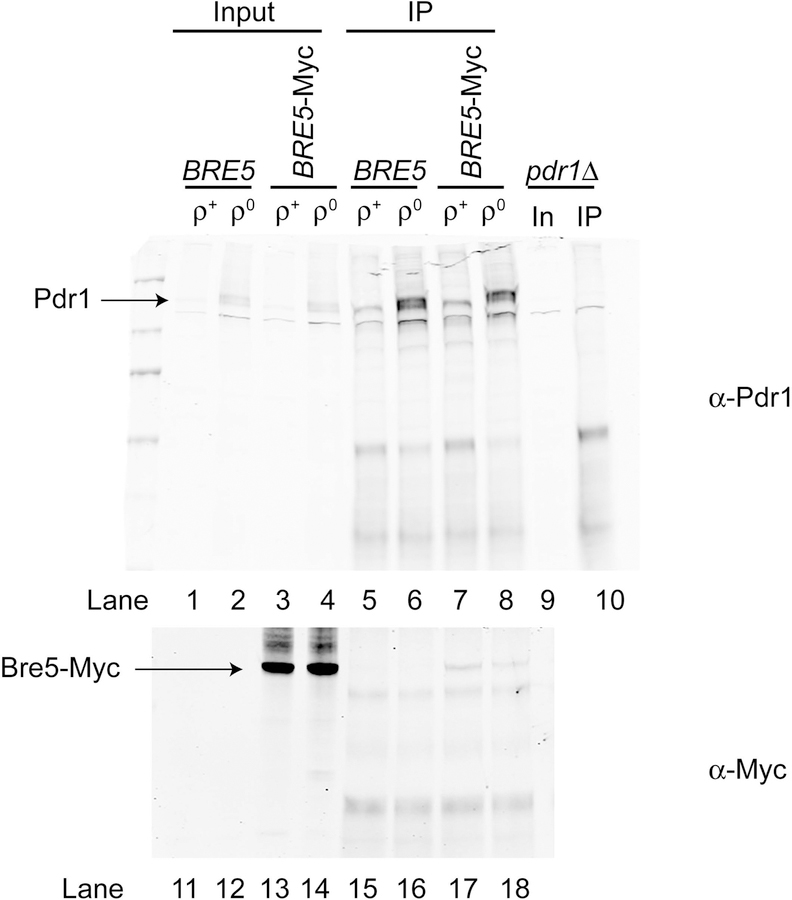
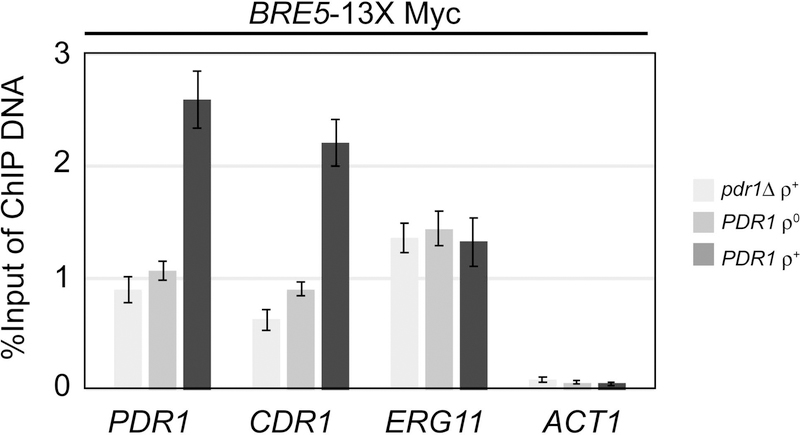
The primary route for development of azole resistance in the fungal pathogen Candida glabrata is acquisition of a point mutation in the PDR1 gene. This locus encodes a transcription factor that upon mutation drives high level expression of a range of genes including the ATP-binding cassette transporter-encoding gene CDR1. Pdr1 activity is also elevated in cells that lack the mitochondrial genome (ρ° cells), with associated high expression of CDR1 driving azole resistance. To gain insight into the mechanisms controlling activity of Pdr1, we expressed a tandem affinity purification (TAP)-tagged form of Pdr1 in both wild-type (ρ+ ) and ρ° cells. Purified proteins were analyzed by multidimensional protein identification technology mass spectrometry identifying a protein called Bre5 as a factor that co-purified with TAP-Pdr1. In Saccharomyces cerevisiae, Bre5 is part of a deubiquitinase complex formed by association with the ubiquitin-specific protease Ubp3. Genetic analyses in C. glabrata revealed that loss of BRE5, but not UBP3, led to an increase in expression of PDR1 and CDR1 at the transcriptional level. These studies support the view that Bre5 acts as a negative regulator of Pdr1 transcriptional activity and behaves as a C. glabrata-specific modulator of azole resistance.
© 2018 John Wiley & Sons Ltd.
Figures
Similar articles
-
Identification of genomic binding sites for Candida glabrata Pdr1 transcription factor in wild-type and ρ0 cells.Antimicrob Agents Chemother. 2014 Nov;58(11):6904-12. doi: 10.1128/AAC.03921-14. Epub 2014 Sep 8. Antimicrob Agents Chemother. 2014. PMID: 25199772 Free PMC article.
-
Pdr1 regulates multidrug resistance in Candida glabrata: gene disruption and genome-wide expression studies.Mol Microbiol. 2006 Aug;61(3):704-22. doi: 10.1111/j.1365-2958.2006.05235.x. Epub 2006 Jun 27. Mol Microbiol. 2006. PMID: 16803598
-
Flucytosine antagonism of azole activity versus Candida glabrata: role of transcription factor Pdr1 and multidrug transporter Cdr1.Antimicrob Agents Chemother. 2013 Nov;57(11):5543-7. doi: 10.1128/AAC.02394-12. Epub 2013 Aug 26. Antimicrob Agents Chemother. 2013. PMID: 23979762 Free PMC article.
-
Multiple interfaces control activity of the Candida glabrata Pdr1 transcription factor mediating azole drug resistance.Curr Genet. 2019 Feb;65(1):103-108. doi: 10.1007/s00294-018-0870-4. Epub 2018 Jul 28. Curr Genet. 2019. PMID: 30056490 Free PMC article. Review.
-
Azole Resistance in Candida glabrata.Curr Infect Dis Rep. 2016 Dec;18(12):41. doi: 10.1007/s11908-016-0554-5. Curr Infect Dis Rep. 2016. PMID: 27761779 Review.
Cited by
-
Overlapping coactivator function is required for transcriptional activation by the Candida glabrata Pdr1 transcription factor.Genetics. 2024 Sep 4;228(1):iyae115. doi: 10.1093/genetics/iyae115. Genetics. 2024. PMID: 39028831 Free PMC article.
-
Two Functionally Redundant FK506-Binding Proteins Regulate Multidrug Resistance Gene Expression and Govern Azole Antifungal Resistance.Antimicrob Agents Chemother. 2021 May 18;65(6):e02415-20. doi: 10.1128/AAC.02415-20. Print 2021 May 18. Antimicrob Agents Chemother. 2021. PMID: 33722894 Free PMC article.
-
Biochemical Identification of a Nuclear Coactivator Protein Required for AtrR-Dependent Gene Regulation in Aspergillus fumigatus.mSphere. 2022 Dec 21;7(6):e0047622. doi: 10.1128/msphere.00476-22. Epub 2022 Nov 14. mSphere. 2022. PMID: 36374043 Free PMC article.
-
Genomic description of acquired fluconazole- and echinocandin-resistance in patients with serial Candida glabrata isolates.J Clin Microbiol. 2024 Feb 14;62(2):e0114023. doi: 10.1128/jcm.01140-23. Epub 2024 Jan 24. J Clin Microbiol. 2024. PMID: 38265207 Free PMC article.
-
Functional information from clinically-derived drug resistant forms of the Candida glabrata Pdr1 transcription factor.PLoS Genet. 2020 Aug 25;16(8):e1009005. doi: 10.1371/journal.pgen.1009005. eCollection 2020 Aug. PLoS Genet. 2020. PMID: 32841236 Free PMC article.
References
-
- Amerik AY & Hochstrasser M, (2004) Mechanism and function of deubiquitinating enzymes. Biochim Biophys Acta 1695: 189–207. - PubMed
-
- Auty R, Steen H, Myers LC, Persinger J, Bartholomew B, Gygi SP & Buratowski S, (2004) Purification of active TFIID from Saccharomyces cerevisiae. Extensive promoter contacts and co-activator function. J Biol Chem 279: 49973–49981. - PubMed
-
- Bassetti M, Peghin M & Timsit JF, (2016) The current treatment landscape: candidiasis. J Antimicrob Chemother 71: ii13–ii22. - PubMed
-
- Bilsland E, Hult M, Bell SD, Sunnerhagen P & Downs JA, (2007) The Bre5/Ubp3 ubiquitin protease complex from budding yeast contributes to the cellular response to DNA damage. DNA Repair (Amst) 6: 1471–1484. - PubMed
-
- Bouchara JP, Zouhair R, Le Boudouil S, Renier G, Filmon R, Chabasse D, Hallet JN & Defontaine A, (2000) In-vivo selection of an azole-resistant petite mutant of Candida glabrata. J Med Microbiol 49: 977–984. - PubMed
Publication types
MeSH terms
Substances
Grants and funding
LinkOut - more resources
Full Text Sources
Other Literature Sources
Molecular Biology Databases
Research Materials
Miscellaneous
