. 2018 Aug 23;13(8):e0202748.
doi: 10.1371/journal.pone.0202748. eCollection 2018.

Manchette-acrosome disorders and testicular efficiency decline observed in hypercholesterolemic rabbits are recovered with olive oil enriched diet

Affiliations

Manchette-acrosome disorders and testicular efficiency decline observed in hypercholesterolemic rabbits are recovered with olive oil enriched diet

Layla Simón et al. PLoS One. .

Abstract

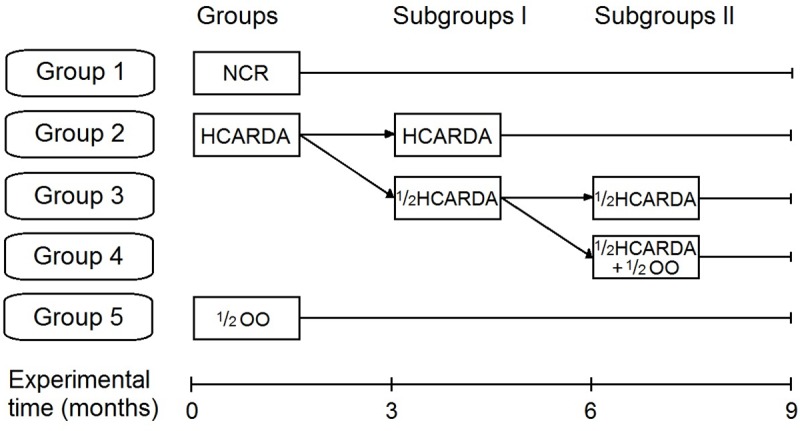
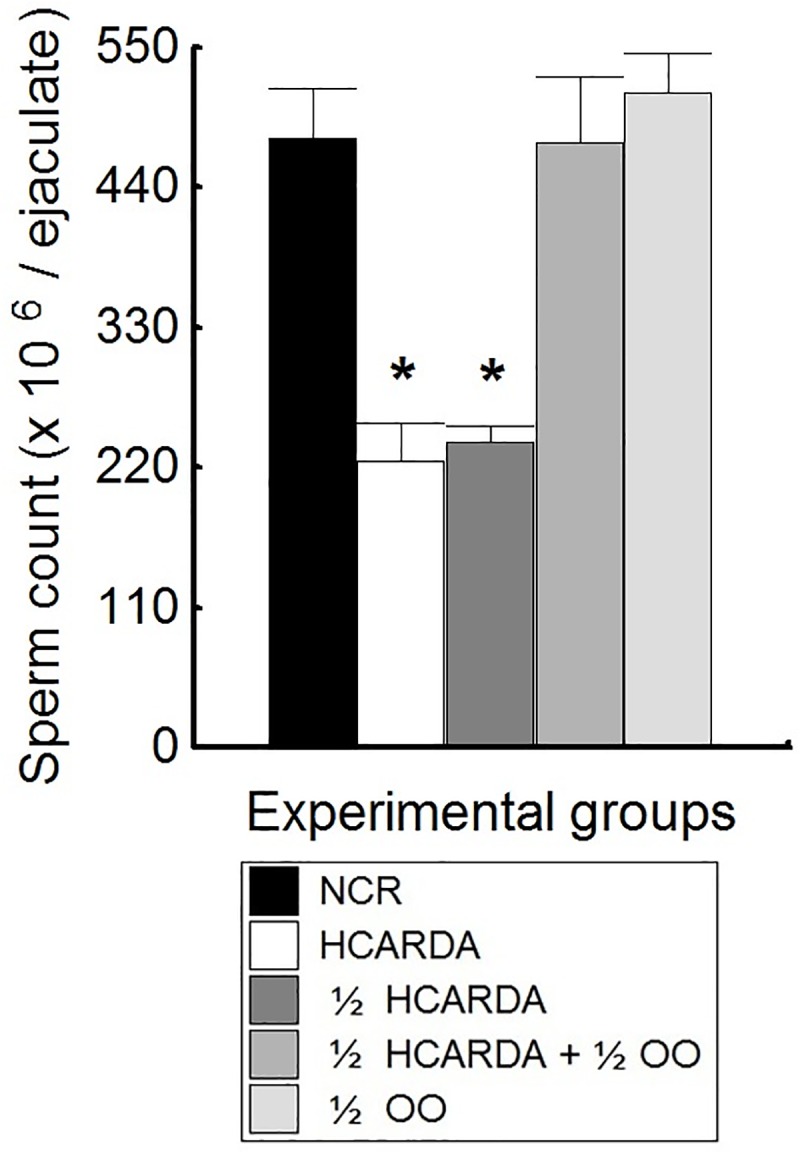
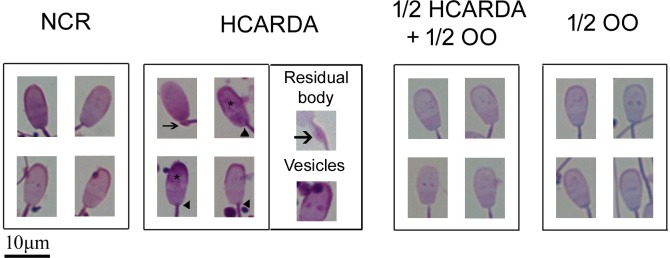
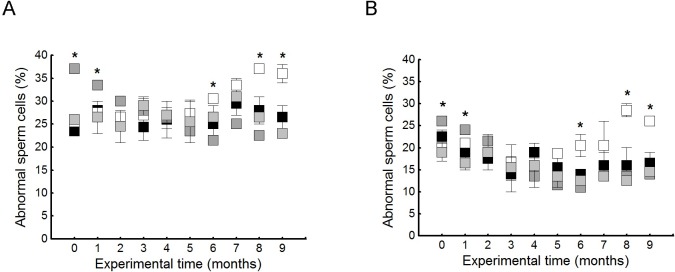
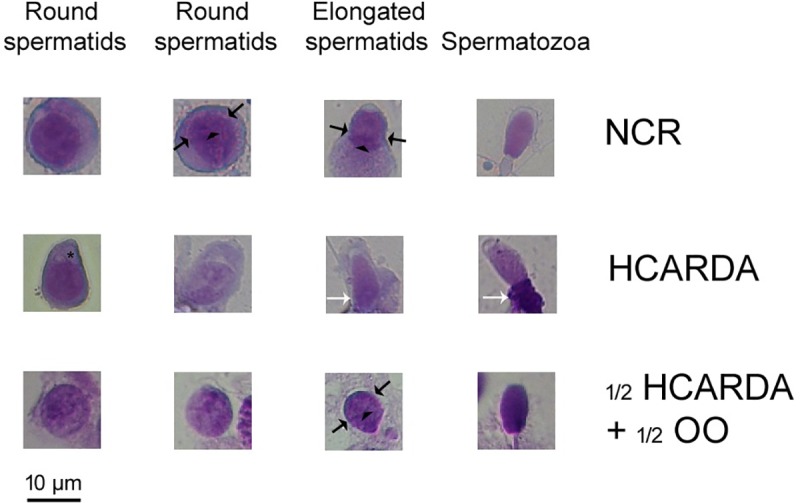
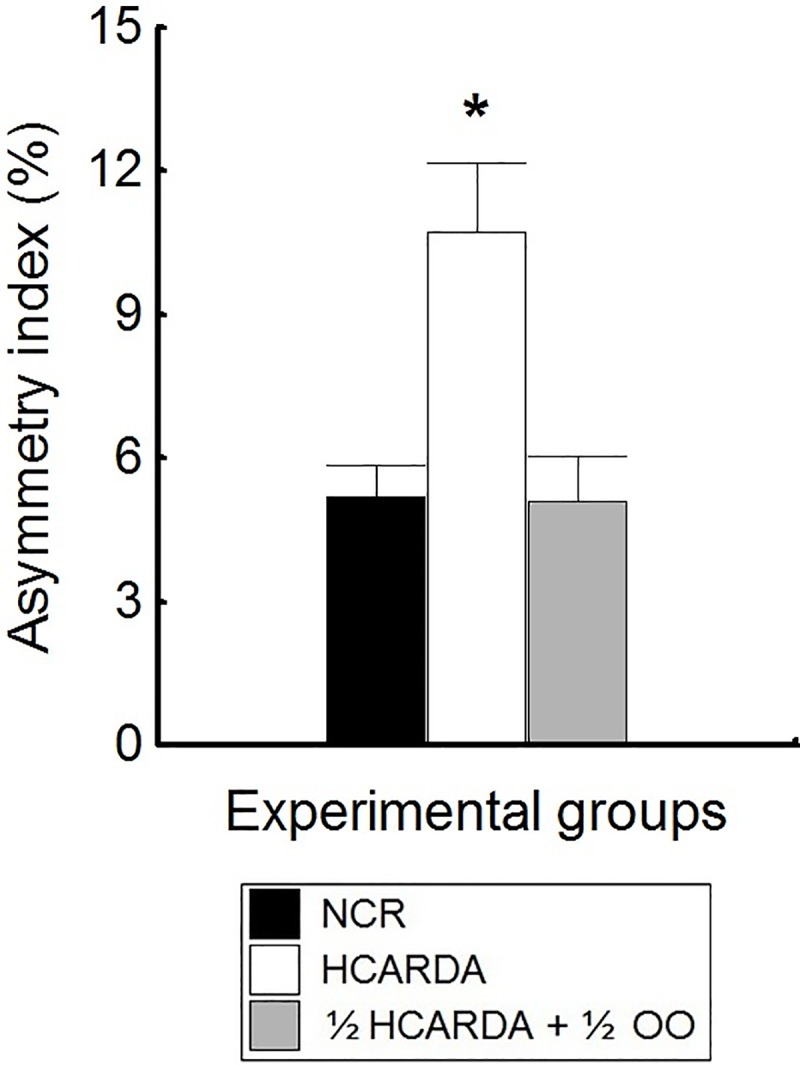
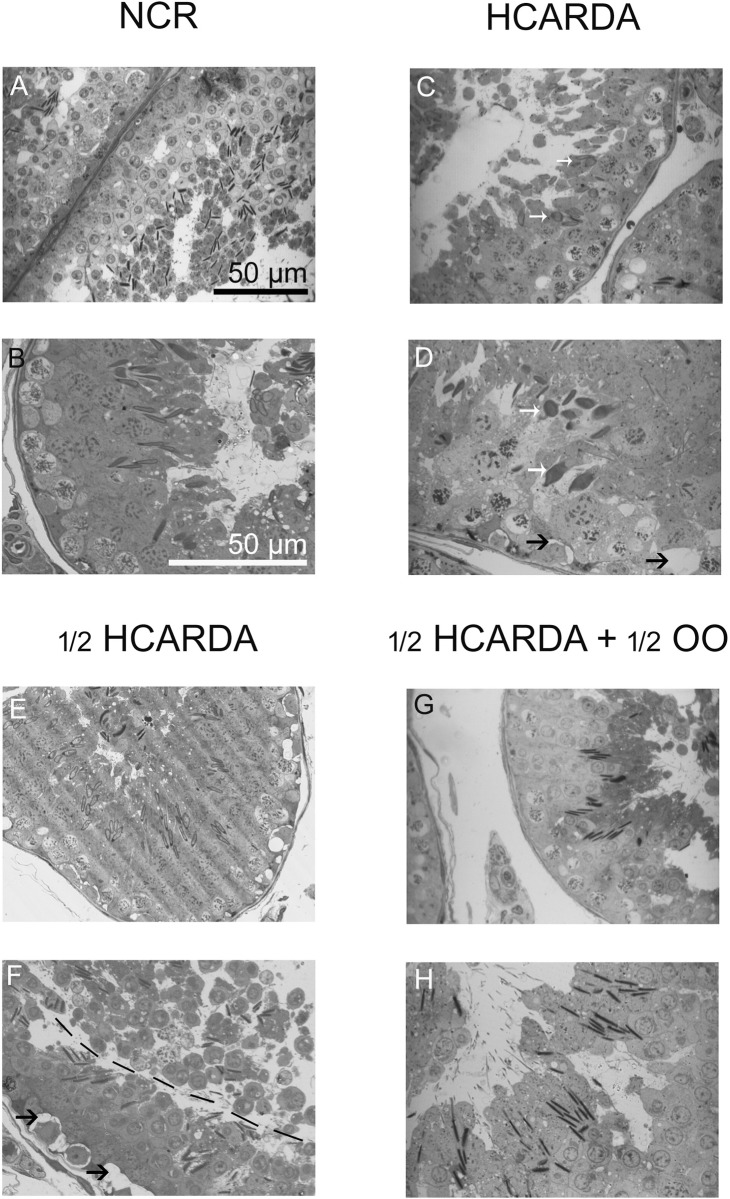
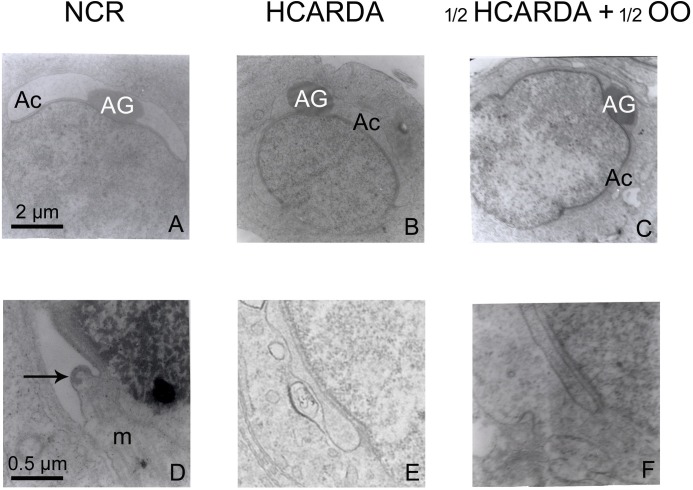
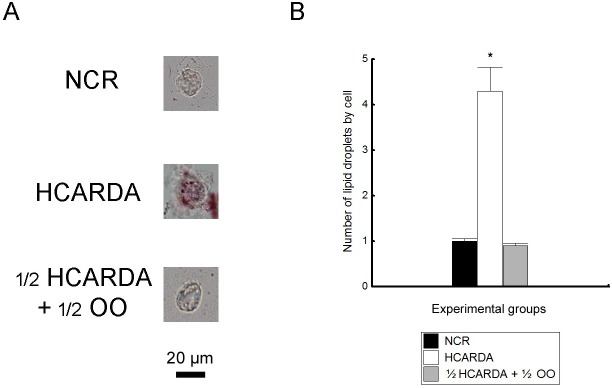
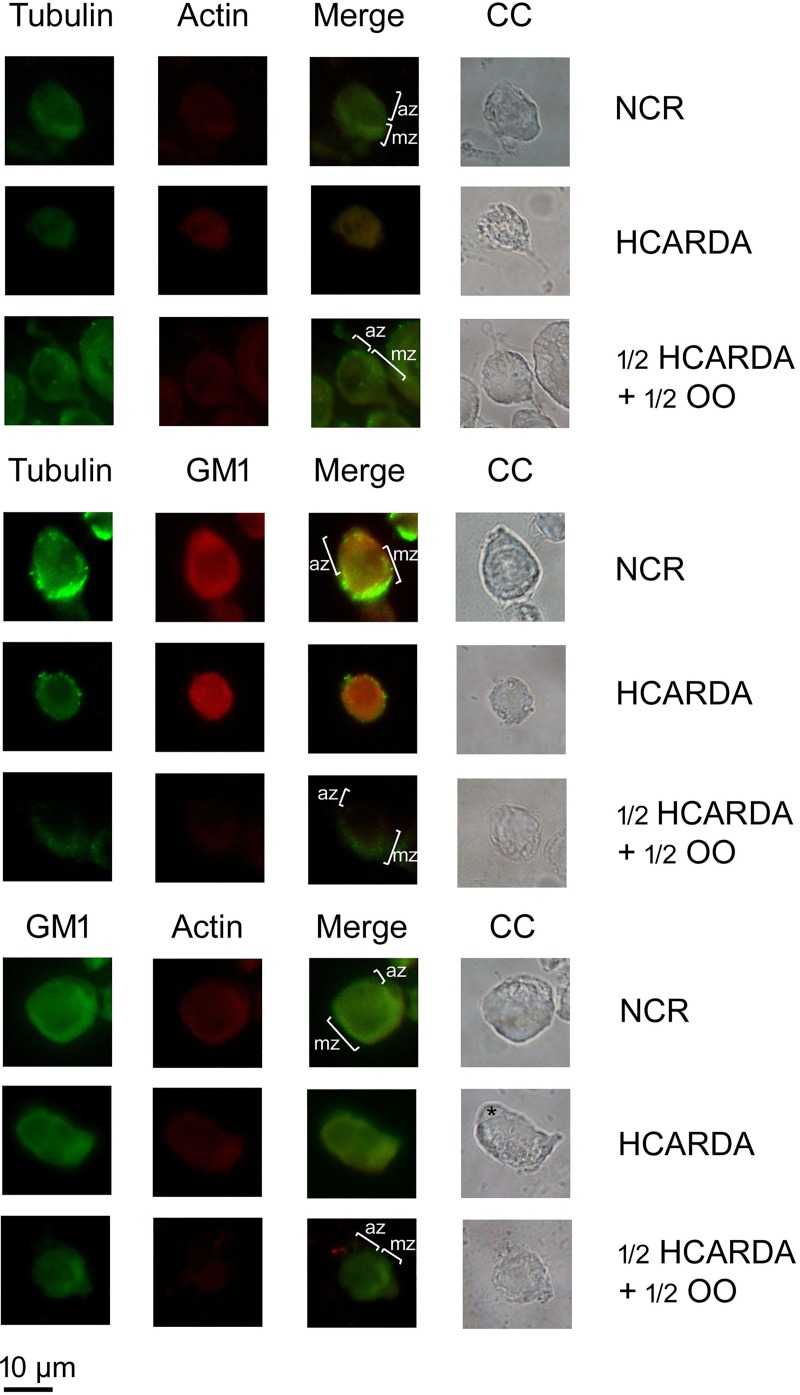
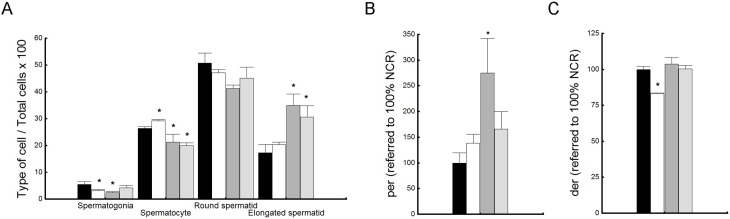
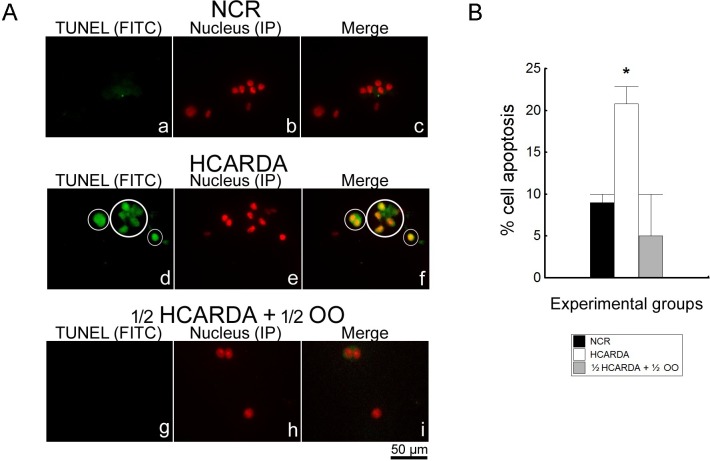
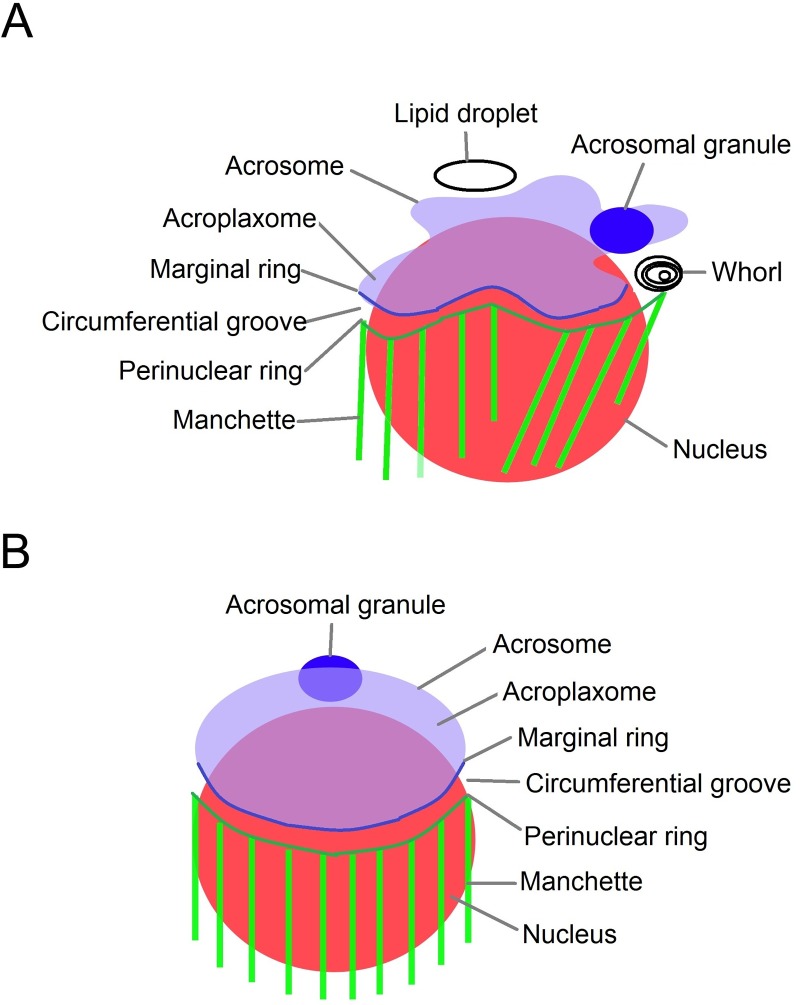
High-fat diet is associated with hypercholesterolemia and seminal alterations in White New Zealand rabbits. We have previously reported disorders in the development of the manchette-acrosome complex during spermiogenesis and decreased testicular efficiency in hypercholesterolemic rabbits. On the other hand, olive oil incorporated into the diet improves cholesterolemia and semen parameters affected in hypercholesterolemic rabbits. In this paper, we report the recovery-with the addition of olive oil to diet-from the sub-cellular mechanisms involved in the shaping of the sperm cell and testicular efficiency altered in hypercholesterolemic rabbits. Using morphological (structural, ultra-structural and immuno-fluorescence techniques) and cell biology techniques, a reorganization of the manchette and related structures was observed when olive oil was added to the high-fat diet. Specifically, actin filaments, microtubules and lipid rafts-abnormally distributed in hypercholesterolemic rabbits-were recovered with dietary olive oil supplementation. The causes of the decline in sperm count were studied in the previous report and here in more detail. These were attributed to the decrease in the efficiency index and also to the increase in the apoptotic percentage in testis from animals under the high-fat diet. Surprisingly, the addition of olive oil to the diet avoided the sub-cellular, efficiency and apoptosis changes observed in hypercholesterolemic rabbits. This paper reports the positive effects of the olive oil addition to the diet in the recovery of testicular efficiency and normal sperm shaping, mechanisms altered by hypercholesterolemia.


Conflict of interest statement

The authors have declared that no competing interests exist.

Figures

Fig 1
Fig 1. Feeding protocol and resulting groups.
Adult rabbits were divided in three groups: normocholesterolemic rabbits were fed with balanced diet during 9 months (Group 1 = NCR), another group received high-fat diet (Group 2 = HCARDA), and the third group received olive oil diet (Group 5 = ½ OO). After 3 months, HCARDA was split in HCARDA (Group 2, Subgroup I) that continued with high-fat, and in ½ HCARDA that received half cow fat (Group 3, subgroup I = ½ HCARDA). Finally, ½ HCARDA was split again, one of them continued with half cow fat diet, and the other received half cow fat and half olive oil (Group 4, subgroup II = ½ HCARDA + ½ OO).
Fig 2
Fig 2. Asymmetry measurement.
The light grey semicircle delineates the acrosome. The grey oval, partially covered by the acrosome, represents the nucleus. The central axis (dashed line) is an imaginary line that crosses the acrosomal granule (ag) and the implantation fossae (if): tail to head connection. Distances 1 and 2 are represented by arrows between the central axis and each acrosomal edge.
Fig 3
Fig 3. Total sperm count (million per ejaculate).
Means of sperm cell number and SD from different feeding conditions were plotted: black bar represents NCR, white bar = HCARDA, dark grey bar = ½ HCARDA, grey bar = ½ HCARDA + ½ OO, and light grey bar = ½ OO. n = 10 samples per condition. Asterisks = p< 0.05.
Fig 4
Fig 4. Sperm cell representative pictures from different experimental conditions.
In the HCARDA group, the presence of residual body around the middle piece (arrow), several vesicles in the acrosome (asterisks) and an asymmetric tail implantation (arrowhead) were observed. Other experimental conditions did not present the same alterations and had normal morphology. The box in HCARDA corresponds to images of residual bodies and vesicles with larger magnifications.
Fig 5
Fig 5. Percentage of sperm abnormalities under normal and experimental diets during 9 months.
(A) Sperm cells with head defects (acrosomal lost, acrosomal vesicle presence, or tapered head) were quantified and tabulated as a percentage. (B)Sperm cells with abnormal tail implantation were quantified and tabulated as a percentage. Black squares: NCR, white squares: HCARDA, grey squares: ½ HCARDA + ½ OO and light grey squares: ½ OO. n = 30 cells per condition analyzed monthly. Asterisks = p< 0.05.
Fig 6
Fig 6. Morphology of cells isolated from seminiferous tubules.
Spermatogenic cells are ordered according to the acrosomal stage from left (immature) to right (mature). Rows correspond to experimental groups: NCR (upper row), HCARDA (middle row) and ½ HCARDA + ½ OO (bottom row). Note the symmetric position of acrosomal edge (opposite black arrows) and the perinuclear ring (arrowhead) in cells from NCR and ½ HCARDA + ½ OO in contrast with the HCARDA. Also note abnormalities in flagella, like residual body (white arrows), and the presence of droplets (asterisk) in the acrosome zone in HCARDA group. 450X, Toluidine Blue stain.
Fig 7
Fig 7. Acrosomal asymmetry measurement.
Asymmetry index is expressed as a percentage and represented by bars (means ± SD). Black bars: NCR, white bars: HCARDA, and grey bars: ½ HCARDA + ½ OO. n = 30 cells per experimental group. Asterisk = p< 0.05.
Fig 8
Fig 8. Light microscopy of semi-thin sections.
Testis isolated from normal (NCR), hypercholesterolemic (HCARDA), half fat (½ HCARDA), and protected rabbits (½ HCARDA + ½ OO). White arrows point to abnormal sperm heads (HCARDA, pictures C and D). Black arrows point vesicles (HCARDA, picture D, and ½ HCARDA, picture F). Segmented line points epithelium detachment (½ HCARDA, picture F). Note the similarities between pictures A and B (NCR) with G and H (½ HCARDA + ½ OO). Magnifications: 400X (A, C, E and G, scale bar in A = 50 μm) and 620X (B, D, F and H, scale bar in B = 50 μm).
Fig 9
Fig 9. Ultra-structure of round spermatids.
NCR (left column, A and D): Acrosome (Ac), acrosome granule (AG) located symmetrically from both acrosomal borders, perinuclear ring (arrow) and microtubules (m). HCARDA (middle column, B and E): No detection of acrosomal symmetry, perinuclear or manchette arriving to the ring. Moreover, lax and asymmetric acrosome (B), and several vesicles and whorl (E) could be observed under HCARDA condition. ½ HCARDA + ½ OO (right column, C and F): recovered acrosome ultra-structure and symmetry without vesicles or whorls. Magnification: 10.000X (A, B and C, scale bar in A = 2 μm) and 40.000X (D, E and F, scale bar in D = 0.5 μm).
Fig 10
Fig 10. Lipid droplets detection.
(A) Lipid droplets stained by ORO in NCR, HCARDA and ½ HCARDA + ½ OO. Only cells isolated from the testicles of the HCARDA experimental condition showed more than one drop. Magnification: 620X. (B) ORO positive lipid droplets for each cell were plotted and represented in black (NCR), white (HCARDA) and grey bars (½ HCARDA + ½ OO). n = 3 rabbits per experimental group. Asterisk = p< 0.05.
Fig 11
Fig 11. Microtubules, actin filaments and lipid rafts arrangement during spermiogenesis.
Spermatogenic isolated cells were analyzed to test the components of the sperm head elongation complex. The microtubules of the manchette were detected using alpha-tubulin antibody and secondary antibody combined with FITC (tubulin columns). The actin filaments were stained with actin antibody conjugated with Cy3 (actin columns). GM1-enriched lipid rafts were detected using cholera toxin conjugated with Alexa flour 594 (GM1 column, red signal) or FITC (GM1 column, green signal). The combination of green and red colors (merge columns) and phase contrast images were also included (CC columns). In NCR, microtubules, actin filaments and GM1 co-localized and were distributed in the manchette zone (mz) opposed to the acrosome zone (az). In HCARDA, it was not possible to detect manchette or acrosome zone. Microtubules, actin filaments and GM1 were equally distributed. Also, an asymmetrical acrosome was observed (asterisk). In ½ HCARDA + ½ OO, cells were polarized and manchette and acrosome zone were detected. Magnification: 620X.
Fig 12
Fig 12. Testicular efficiency.
(A) Percentages of spermatogenic cells by tubular seminiferous section. Each specific type of spermatogenic cell (spermatogonia, spermatocyte, round and elongated spermatid) present in a cross section of seminiferous tubules were counted and plotted as a percentage of the total cells counted. Mean ± SD of percentages of different spermatogenic cells were plotted for all experimental conditions: NCR = black bars, HCARDA = white bars, ½ HCARDA + ½ OO = grey bars, and ½ OO = light grey bars. (B) Proliferation efficiency rate (per) normalized to NCR. per was calculated dividing the number of sperm cells by the spermatogonia percentage. (C)Differentiation efficiency rate (der) normalized to NCR. Der was calculated dividing the number of sperm cells by the spermatid percentage. Mean ± SD of per and der were plotted using the same color code. n = 200 cells per condition in six separated experiments. Asterisks = p< 0.05.
Fig 13
Fig 13. Detection of apoptosis by TUNEL assay in isolated spermatogenic cells.
(A) Left column (a, d and g: green signal) corresponds to TUNEL-positive spermatogenic cells, middle column (b, e and h: red signal) to nucleus detection by propidium iodide, and right column (c, f and i) to merge. TUNEL-positive cells are surrounded by a white circle. Magnification: 400X. (B) Mean ± SD of TUNEL-positive cells (%) were plotted for NCR = black bar, HCARDA = white bar, and ½ HCARDA + ½ OO = grey bar. n = 200 cells per experimental condition. Asterisk = p< 0.05.
Fig 14
Fig 14. Sperm elongation complex model.
The nucleus is represented in red, the acrosome in light blue, the acrosomal granule in blue, the marginal ring with a blue line, the perinuclear ring with a dark green line, the microtubules of manchette with light green lines. The space between acrosome and nucleus corresponds to acroplaxome, and the space between marginal and perinuclear ring to circumferential groove. (A) HCARDA spermatid. The lipid droplet could disturb the acrosomal granule position and modify the elongation axis. The acrosome is lax, the acroplaxome and the marginal ring are disrupted. The whorls in the circumferential groove may affect marginal and perinuclear ring interaction. The manchette seems to pull asymmetrically. (B) ½ HCARDA + ½ OO spermatid. The cytoplasm is free of whorls and lipid droplets. The acrosome granule is positioned equidistantly from both edges of the acrosome. The interaction between marginal and perinuclear rings appears to be recovered. Finally, the acrosome is well positioned on the nucleus and symmetrically pulled by the manchette. This elongation complex is similar to normal.

Similar articles

Cited by

References

    1. Saez Lancellotti TE, Boarelli PV, Monclus MA, Cabrillana ME, Clementi MA, Espínola LS, et al. Hypercholesterolemia Impaired Sperm Functionality in Rabbits. Combs C, editor. PLoS ONE. 2010. October 18;5(10):e13457 10.1371/journal.pone.0013457 - DOI - PMC - PubMed
    1. Marchiani S, Vignozzi L, Filippi S, Gurrieri B, Comeglio P, Morelli A, et al. Metabolic syndrome-associated sperm alterations in an experimental rabbit model: Relation with metabolic profile, testis and epididymis gene expression and effect of tamoxifen treatment. Mol Cell Endocrinol. 2015. February;401:12–24. 10.1016/j.mce.2014.11.005 - DOI - PubMed
    1. Levy R, Pollet-Villard X, Saez J, Saez F, Whitfield M. Post-testicular sperm maturation, infertility and hypercholesterolaemia. Asian J Androl. 2015Sep-Oct; 17(5): 742–748. 10.4103/1008-682X.155536 - DOI - PMC - PubMed
    1. Boarelli PV, Monclus MA, Saez Lancellotti T, Cabrillana ME, Simón L, Funes AK, et al. Simultaneous Study of Cholesterol and GM1 Ganglioside by Specific Probes: Lipid Distribution during Maturation, Capacitation and the Acrosome Reaction. J Cytol Histol. 2016. April;07:412 10.4172/2157-7099.1000412 - DOI
    1. Richard C, Couture P, Desroches S, Benjannet S, Seidah NG, Lichtenstein AH, et al. Effect of the Mediterranean diet with and without weight loss on surrogate markers of cholesterol homeostasis in men with the metabolic syndrome. Br J Nutr. 2012. March;107(5):705–11. 10.1017/S0007114511003436 - DOI - PubMed

Publication types

MeSH terms