. 2018 Aug 22;99(4):736-753.e6.
doi: 10.1016/j.neuron.2018.07.033.

TMC1 Forms the Pore of Mechanosensory Transduction Channels in Vertebrate Inner Ear Hair Cells

Affiliations

TMC1 Forms the Pore of Mechanosensory Transduction Channels in Vertebrate Inner Ear Hair Cells

Bifeng Pan et al. Neuron. .

Abstract

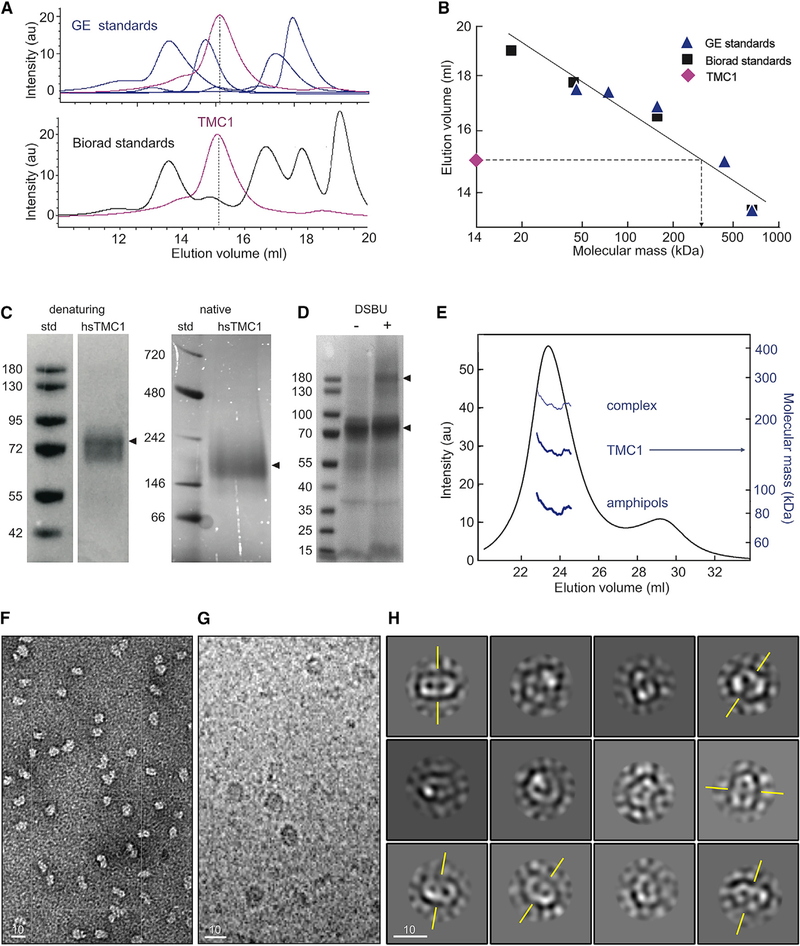
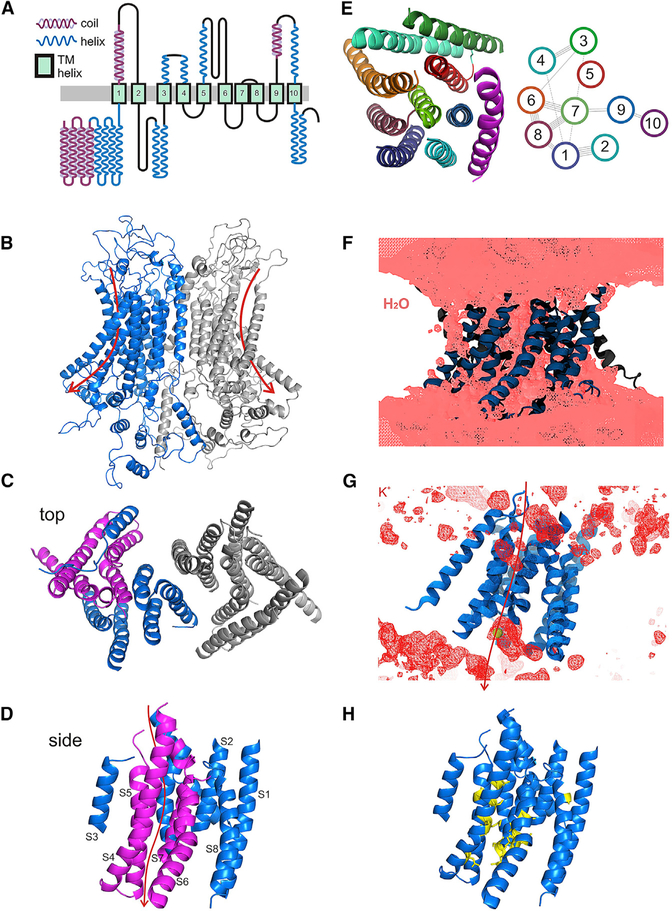
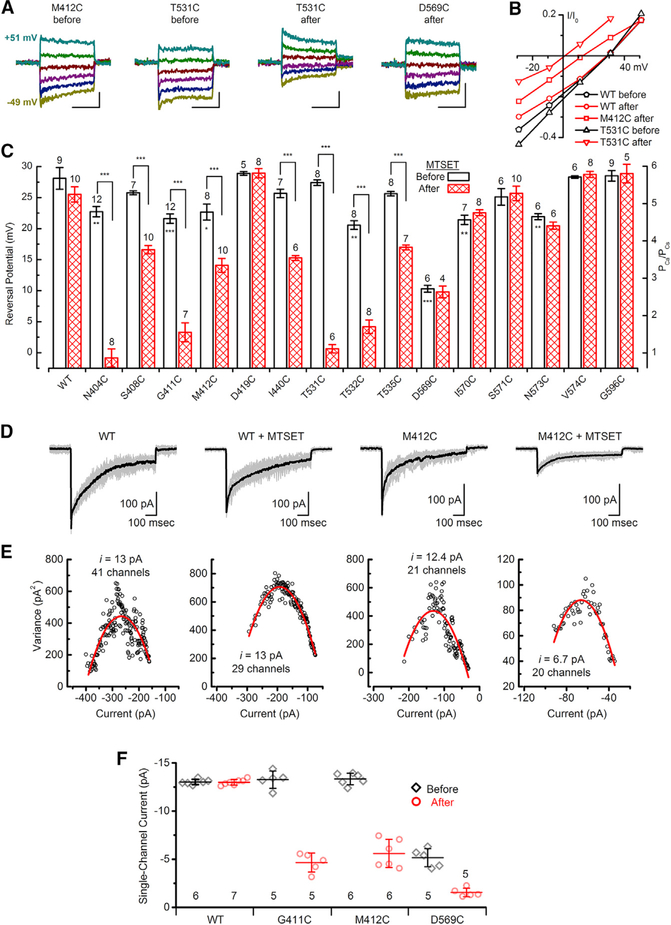
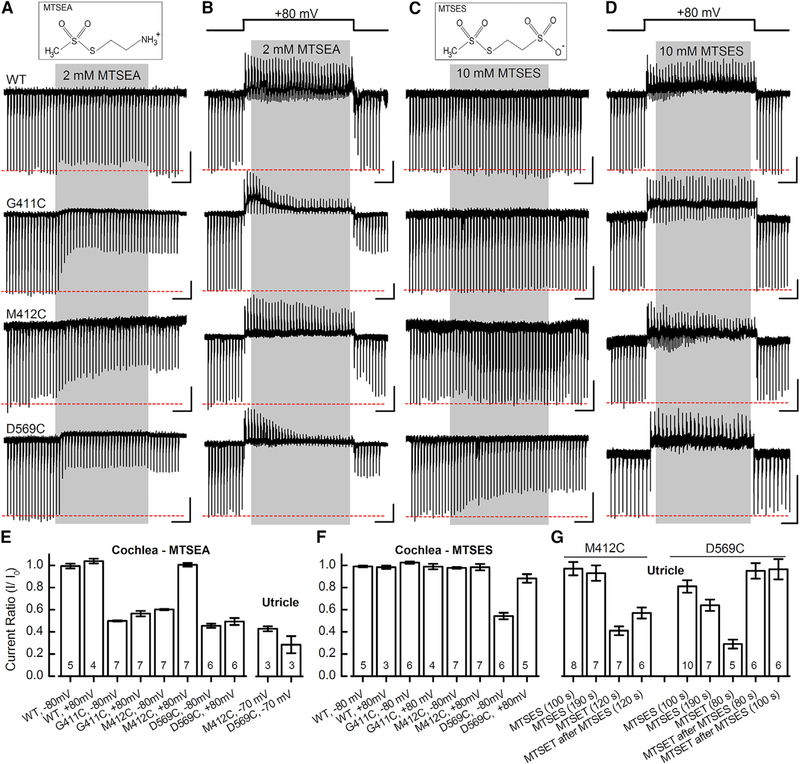
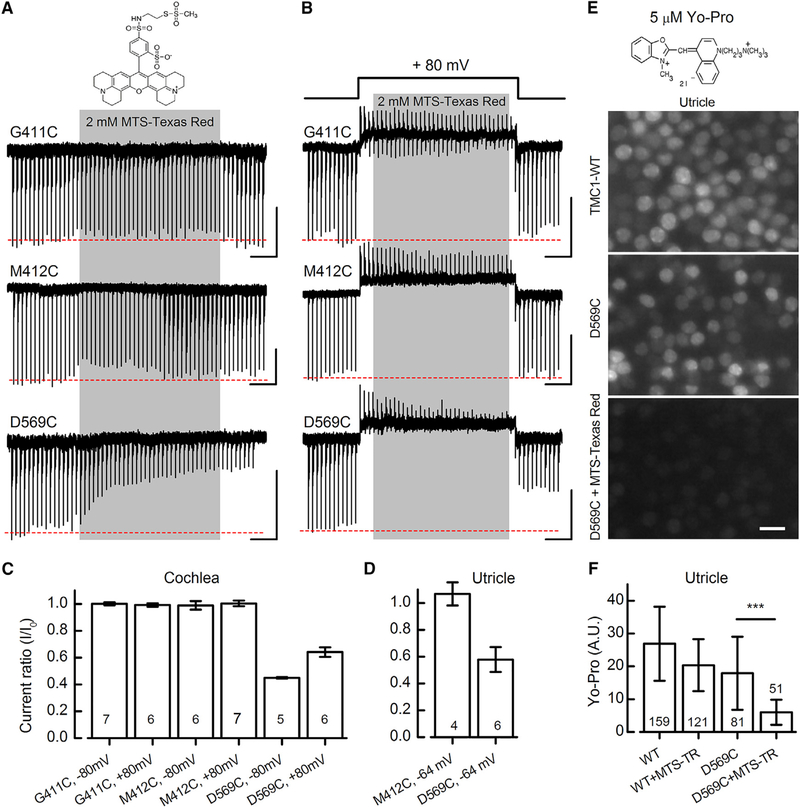
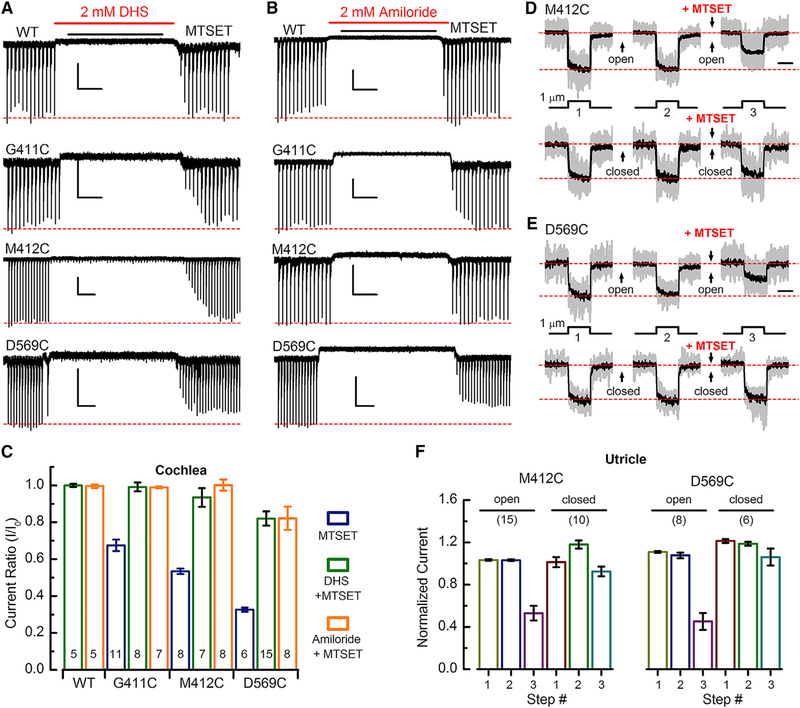
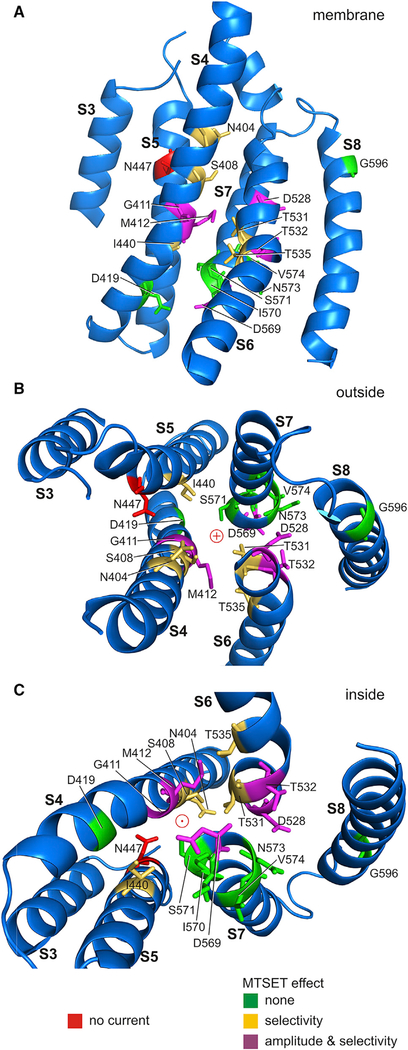
The proteins that form the permeation pathway of mechanosensory transduction channels in inner-ear hair cells have not been definitively identified. Genetic, anatomical, and physiological evidence support a role for transmembrane channel-like protein (TMC) 1 in hair cell sensory transduction, yet the molecular function of TMC proteins remains unclear. Here, we provide biochemical evidence suggesting TMC1 assembles as a dimer, along with structural and sequence analyses suggesting similarity to dimeric TMEM16 channels. To identify the pore region of TMC1, we used cysteine mutagenesis and expressed mutant TMC1 in hair cells of Tmc1/2-null mice. Cysteine-modification reagents rapidly and irreversibly altered permeation properties of mechanosensory transduction. We propose that TMC1 is structurally similar to TMEM16 channels and includes ten transmembrane domains with four domains, S4-S7, that line the channel pore. The data provide compelling evidence that TMC1 is a pore-forming component of sensory transduction channels in auditory and vestibular hair cells.

Keywords: TMC1; TMC2; auditory; balance; hair cell; hearing; mechanosensory transduction; mechanotransduction; sensory transduction; vestibular.


Conflict of interest statement

DECLARATION OF INTERESTS

J.R.H. holds patents on Tmc1 gene therapy and is a scientific advisor to several biotech firms focused on inner-ear therapies. The authors declare no other competing interests.

Figures

Figure 1.
Figure 1.. Dimerization of TMC1
(A) FSEC elution profile of TMC1-GFP (magenta) relative to the SEC profile of General Electric (GE, top) and Biorad (bottom) molecular weight standards. (B) SEC elution volumes of protein standards plotted against their molecular weights. Protein standards (symbols) were fitted with a linear equation (line). The TMC1 elution volume predicts a molecular mass of ~310 kDa for protein and surfactant. (C) Denaturing gel and native-PAGE with a Bis-Tris gel show the molecular weight of the purified hsTMC1 complex in denatured (~90kDa) and native (~200 kDa) states. (D) Denaturing Coomassie-stained gel analysis of purified mmTMC1 proteins before (left lane) and after (right lane) cross-linking with 0.2 mM DSBU.

(E) Astra SEC-MALS analysis of purified proteins. The UV-absorbance elution profile of the SEC-MALS sample is overlaid with the molecular mass estimates for the proteins (~150 kDa), amphipols (80 kDa), and the combined complex (230 kDa). The molecular masses are plotted on a log scale (right y axis) for the selected peak and shown as a function of column elution volume. (F) A representative negative stain image shows a homogeneous population of purified hsTMC1 proteins, free of aggregates. (G) Cryo-EM micrograph of purified hsTMC1 protein reconstituted into amphipols. (H) Class averages of TMC particles. The axis of symmetry for selected class averages with two-fold symmetry is indicated in yellow. In (F)–(H), scale bars represent 10 nm.
Figure 2.
Figure 2.. Predicted Architecture of TMC1 and a Putative Pore Region
(A) Predicted transmembrane topology for mmTMC1, based on an alignment of many TMCs with TMEM16s, on the known transmembrane structure of mmTMEM16A, and on secondary structure predicted by PSSpred. (B–D) Possible structure for dimeric TMC1 after 100 ns of MD simulations; model generated by I-TASSER based on the structure of mmTMEM16A (PDB: 5OYB). (B) View from within the plane of the membrane, (C) top view from outside the cell, and (D) side view of one subunit from within the membrane. (E) Proposed arrangement of the transmembrane helices of one subunit, top view (left). EV-coupling analysis (right) reveals predicted contacts between residues, which are represented as lines connecting transmembrane helices. (F) Isosurface of average water density computed over the last 50.5 ns of MD simulation of an I-TASSER-, mmTMEM16A-based model. Protein is shown in ribbon representation. Water permeation through the open groove of F1 can be observed. (G) Isosurface of average potassium density computed and shown as in (F) for F1 subunit. Arrow indicates the putative permeation path. (H) Seventeen cysteine substitutions (yellow) mapped onto the TMC1 structural model with S1–S10 shown in blue.
Figure 3.
Figure 3.. Cysteine Substitution in TMC1 Yields Viable Sensory Transduction Current in Cochlear Inner Hair Cells
(A) Transmembrane topology of mouse TMC1,featuring transmembrane domains 3–9, as predicted by the homology with TMEM16. Seventeen sites were targeted for cysteine substitution using site-directed mutagenesis. The sites of cysteine substitution are shown in red. (B) Chemical reaction between the cysteine side chain and the MTS reagent 2-(trimethylammonium)-ethyl methanethiosulfonate (MTSET) yields a covalent linkage that can modify protein function (left). Schematic diagram illustrating the experimental configuration for recording from cochlear inner hair cells (right) is shown. The stimulation pipette is oriented to deflect the bundle along the sensitive axis (arrow), and the drug application pipette is oriented perpendicular to the sensitive axis to eliminate fluid motion artifact. (C) Hair bundles were mechanically stimulated with 1-μm step deflections at 3 Hz for 20 s (top trace). MTSET was applied for 10 s (gray shaded region) and washed out. Sensory transduction current traces recorded from cochlear inner hair cells are shown for WT TMC1 and eight representative TMC1 cysteine substitutions as indicated. The scale bars represent 2 s (horizontal) and 100 pA (vertical) for each trace, except D528C (50 pA vertical). (D) Mean current ratios (±SEM) plotted for WT TMC1 and seventeen cysteine mutant TMC1s. Current ratio was calculated as the mean response to five bundle steps before (I0) and after (I) application of MTSET, as indicated in (C) for the G411C trace (red brackets and arrows). Number of cells, from 2–5 mice/substitution, is shown below.
Figure 4.
Figure 4.. Reversal Potentials and Single-Channel Currents for WT TMC1 and Cysteine Mutants
(A) Representative families of current evoked by 20-ms, 1-μm step hair bundle deflections measured at membrane potentials between −49 mV and 51 mV for IHCs expressing M412C, T531C, or D569C before or after MTSET as indicated. Cells were recorded with 100 mM Ca2+ extracellular and 140 mM Cs+ intracellular ion concentrations as the only charge carriers. The scale bars represent 10 ms (horizontal) and 25 pA (vertical). (B) Current-voltage relationships were generated from the peak currents and plotted as function of membrane potential for the five TMC1 conditions indicated. (C) Summary plots of mean (± SEM) reversal potentials for WT TMC1 and 15 cysteine mutants before and after treatment with 2 mM MTSET. Number of cells, from 2–4 mice/substitution, and the cysteine substitutions are indicated above and below each bar, respectively. Stars within bars indicate statistically significant differences relative to WT TMC1. Stars above brackets indicate statistically significant differences before and after MTSET. *p ≤ 0.05; **p ≤ 0.01; ***p ≤ 0.001; two population t tests. (D) Mean sensory transduction current (black) for 14–28 individual current traces (gray) evoked by identical 1-μm bundle deflections for cochlear IHCs expressing WT TMC1 or M412C, before and after application of 2 mM MTSET. (E) Plots of variance as a function of current amplitude (symbols) fitted with a parabolic function (red curve; see STAR Methods). Axes were adjusted to allow better visualization of the data and the quality of the fit. (F) Mean (±SD) single-channel current estimates for WT and three mutants before and after application of MTSET. Number of cells, from 2 or 3 mice/substitution, is listed below.
Figure 5.
Figure 5.. Effects of MTSEA and MTSES on WT TMC1 and Cysteine Mutants in IHCs and Vestibular Hair Cells
(A) Structure of MTSEA (top). Sensory transduction currents recorded from IHCs during 10 s application of 2 mM MTSEA (gray) at −80 mV holding potential. The scale bars represent 2 s (horizontal) and 100 pA (vertical) for each trace (A–D). (B) IHC currents recorded at +80 mV during 10 s application of 2 mM MTSEA (gray). (C) Structure of negatively charged MTSES (top). Representative IHC currents after 10 s, 10 mM MTSES application (gray) at −80 mV are shown. (D) IHC currents recorded at +80 mV during 10 s application of 10 mM MTSES (gray). (E and F) Mean (± SEM) current ratios before and after 2 mM MTSEA (E) or 10 mM MTSES (F) application in cochlea IHC and utricle type II cells. Substitution, membrane potential, and number of cells, from 2–10 mice/condition, are indicated at the bottom. (G) Mean (± SEM) current ratio for utricle type II cells expressing M412C or D569C after exposure to 10 mM MTSES alone or before 2 mM MTSET application. MTSES was applied for 80–190 s as indicated below.
Figure 6.
Figure 6.. MTS-Texas Red Has Limited Access to G411C and M412C, but Not D569C
(A and B) Structure of MTS-Texas Red (top). Transduction currents from IHCs after 10 s MTS-Texas Red application at −80 mV (A) and +80 mV (B) are shown. The scale bars represent 2 s (horizontal) and 100 pA (vertical). (C and D) Summary plot of mean (± SEM) current ratios (I/I0) following exposure to MTS-Texas Red for cochlear IHCs (C) and utricle type II hair cells (D). Substitution, membrane potential, and number of cells, from 2–6 mice/condition, are shown below. (E) Structure of YO-PRO-1 iodide (MW 629, top). Fluorescence images of YO-PRO-1 uptake in Tmc1/Tmc2 mutant utricle hair cells expressing WT TMC1 (top) or D569C (middle and bottom) are shown. The tissue was exposed to 5 μM YO-PRO-1 for 60 s followed by four bath exchanges during a five-minute wash. For the bottom panel, the tissue was exposed to 2 mM MTS-Texas Red for 60 s prior to application of YO-PRO-1. All images were acquired with identical gain and contrast settings. The scale bar represents 10 μm. (F) Mean (±SD) YO-PRO-1 fluorescence quantified in A.U. (arbitrary units) for each condition shown at the bottom. Number of cells, from 2–3 mice/condition, is indicated in each bar. The experiment was replicated twice for WT tissue and three times for D569C. ***p = 1.3 × 10⁻¹¹ two population t test.
Figure 7.
Figure 7.. Pore Blockers and Closed Channels Impede Access to Cysteine Mutations
(A) Representative IHC sensory transduction currents for WT, G411C, M412C, and D569C in response to dual application of 2 mM dihydrostreptomycin (DHS) and MTSET as indicated above. MTSET was applied at 2 mM for G411C, 10 mM for M412C, and 0.2 mM for D569C, selected as the minimal concentration required to achieve the maximal response during the 8-s application. The scale bars represent 2 s (horizontal) and 100 pA (vertical). (B) IHC responses for dual application of 2 mM amiloride and MTSET. Scale bars indicate 2 s (horizontal) and 100 pA (vertical). (C) Mean (±SEM) current ratios for WT, G411C, M412C, and D569C in response to MTSET alone, DHS + MTSET, or amiloride + MTSET. Number of cells, from 2–5 mice/condition, is shown at the bottom of each bar. (D) Mean sensory transduction current traces (black) superimposed on 10–15 normalized individual traces (gray) recorded from utricle type II hair cells expressing M412C. Deflection protocol is shown below. Between each step, the bundle was deflected 1.7 μm (top row) or −0.5 μm (bottom row) for 6 s to open or close channels, respectively. 2 mM MTSET was applied between the 2nd and 3rd steps as indicated. The scale bar represents 25 ms. (E) Mean sensory transduction traces (black) superimposed on 6–8 normalized individual traces (gray) recorded from utricle type II hair cells expressing D569C.The same stimulation protocol was used to evoke the responses shown in (D) and (E) except the bundle was deflected for 2 s and the MTSET concentration was 0.5 mM. (F) Mean (±SEM) normalized M412C and D569C currents for each step (1–3) shown in (D) and (E) for bundles held in the open and closed positions. Number of cells, from 2–5 mice/condition, is shown above the bars.
Figure 8.
Figure 8.. TMC1 Homology Model with Proposed Permeation Pathway
Homology model for TMC1 transmembrane domains S3–S8 with cysteine substitutions mapped onto the structure. The model shows the human sequence with F1 helix positions after 100 ns molecular dynamics equilibration of side chains. This may represent an open conformation, as channel closure is unlikely during the simulation time. (A) A single TMC1 monomer shown from within the cell membrane. The various cysteine substitutions are color coded as follows: green substitutions had no effect; gold residues altered calcium selectivity after MTSET application; and magenta residues altered both calcium selectivity and current amplitudes after MTSET application. Cysteine substitution of the one red residue (N447) eliminated current entirely, even without MTSET application. (B) View of domains 3–8 from outside the cell. (C) View from inside the cell.

Comment in

References

    1. Ahmed ZM, Goodyear R, Riazuddin S, Lagziel A, Legan PK, Behra M, Burgess SM, Lilley KS, Wilcox ER, Riazuddin S, et al. (2006). The tip-link antigen, a protein associated with the transduction complex of sensory hair cells, is protocadherin-15. J. Neurosci. 26, 7022–7034. - PMC - PubMed
    1. Akabas MH, Stauffer DA, Xu M, and Karlin A (1992). Acetylcholine receptor channel structure probed in cysteine-substitution mutants. Science 258, 307–310. - PubMed
    1. Askew C, Rochat C, Pan B, Asai Y, Ahmed H, Child E, Schneider BL, Aebischer P, and Holt JR (2015). Tmc gene therapy restores auditory function in deaf mice. Sci. Transl. Med 7, 295ra108. - PMC - PubMed
    1. Best RB, Zhu X, Shim J, Lopes PE, Mittal J, Feig M, and Mackerell AD Jr. (2012). Optimization of the additive CHARMM all-atom protein force field targeting improved sampling of the backbone φ, ψ and side-chain χ(1) and χ(2) dihedral angles. J. Chem. Theory Comput. 8, 3257–3273. - PMC - PubMed
    1. Beurg M, Evans MG, Hackney CM, and Fettiplace R (2006). A largeconductance calcium-selective mechanotransducer channel in mammalian cochlear hair cells. J. Neurosci 26, 10992–11000. - PMC - PubMed

Publication types