. 2018 Aug 22;99(4):842-853.e8.
doi: 10.1016/j.neuron.2018.07.038.

A Dynamic Interplay within the Frontoparietal Network Underlies Rhythmic Spatial Attention

Affiliations

A Dynamic Interplay within the Frontoparietal Network Underlies Rhythmic Spatial Attention

Ian C Fiebelkorn et al. Neuron. .

Abstract

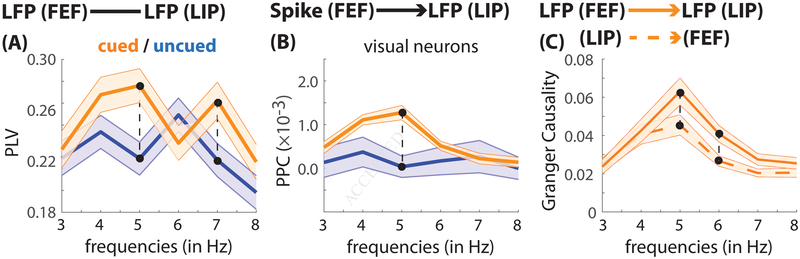
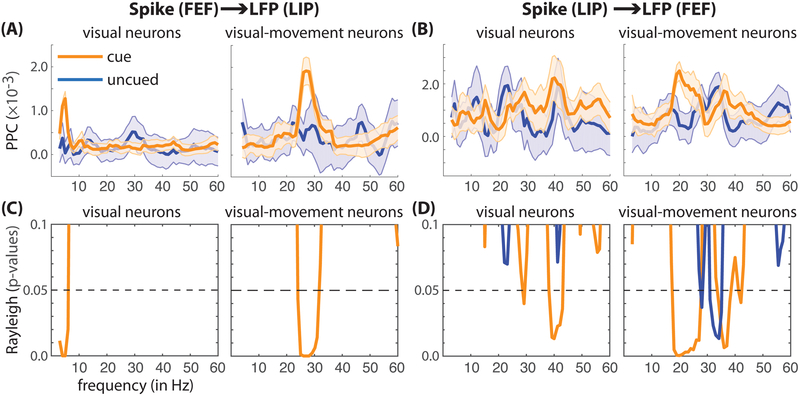
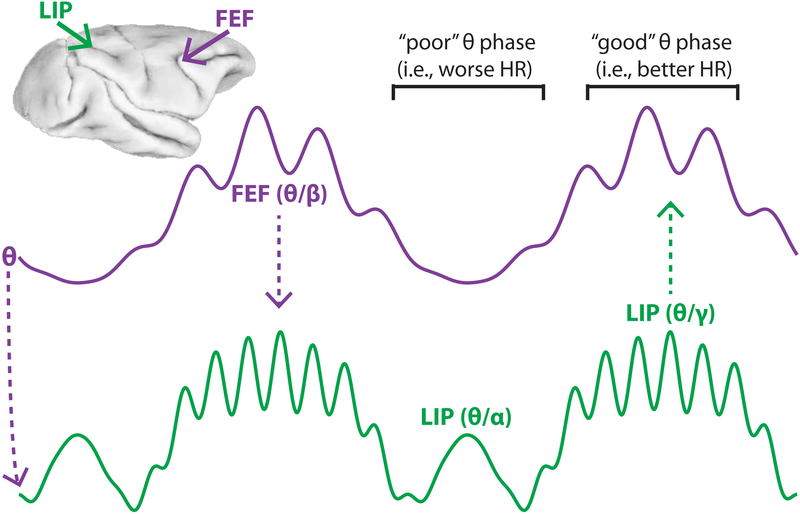
Classic studies of spatial attention assumed that its neural and behavioral effects were continuous over time. Recent behavioral studies have instead revealed that spatial attention leads to alternating periods of heightened or diminished perceptual sensitivity. Yet, the neural basis of these rhythmic fluctuations has remained largely unknown. We show that a dynamic interplay within the macaque frontoparietal network accounts for the rhythmic properties of spatial attention. Neural oscillations characterize functional interactions between the frontal eye fields (FEF) and the lateral intraparietal area (LIP), with theta phase (3-8 Hz) coordinating two rhythmically alternating states. The first is defined by FEF-dominated beta-band activity, associated with suppressed attentional shifts, and LIP-dominated gamma-band activity, associated with enhanced visual processing and better behavioral performance. The second is defined by LIP-specific alpha-band activity, associated with attenuated visual processing and worse behavioral performance. Our findings reveal how network-level interactions organize environmental sampling into rhythmic cycles.

Keywords: FEF; LIP; attention; frontoparietal network; oscillations; phase-dependent behavior; theta; vision.


Conflict of interest statement

DECLARATION OF INTERESTS

The authors declare no competing interests.

Figures

Figure 1.
Figure 1.. Experimental task.
(A, B) A variant of the Egly-Driver task (Egly et al., 1994), investigating behavioral and electrophysiological responses at (1) a cued location and (2) an uncued location, positioned on a second object.
Figure 2.
Figure 2.. Evidence of rhythmic sampling in monkey behavioral data.
(A) Displays the change in hit rates (HRs) at the cued location as a function of the time from cue (i.e., at different cue-target delays). Behavioral data were compiled across all recording sessions from two monkeys. These data have been linearly detrended, aiding visualization of the periodic effects (see Fig. S2 for the behavioral times-series data prior to detrending). The shaded regions around the lines represent standard error of the mean. (B) The fast Fourier transform (FFT) was then used to convert behavioral time-series data into the frequency domain (Fiebelkorn et al., 2011; Fiebelkorn et al., 2013a). The black dots represent statistically significant peaks after corrections for multiple comparisons, demonstrating significant theta-band rhythmicity in monkey behavioral performance.
Figure 3.
Figure 3.. Theta-band activity within the frontoparietal network shapes behavioral performance.
(A, B) The change in hit rate (HR) at the cued location (i.e., when response fields overlapped the cued location) as a function of theta phase. If detectability is dependent on oscillatory phase, HRs binned by phase (in orange) should approximate a one-cycle sine wave (i.e., peaks in visual-target detection should be separated from troughs by approximately 180 degrees). A fast Fourier transform was therefore used to extract a one-cycle, sinusoidal component (in black). The strength of the phase-detection relationship at each frequency, (C, D) from 3–60 Hz, was measured as the amplitude of this sinusoidal component (Fiebelkorn et al., 2013b). The black dots represent statistically significant findings after corrections for multiple comparisons. (E, F) Trials were then split into two bins based on theta phase: (i) a bin centered on the theta phase associated with relatively better (“good”) behavioral performance and (ii) a bin centered on the theta phase associated with relatively worse (“poor”) behavioral performance. Theta-dependent phase-detection relationships were then calculated within each of those bins, from 9–60 Hz. HRs at the cued location are dependent on the phase of neural oscillatory activity in both FEF (97 recording sessions) and LIP (98 recording sessions).
Figure 4.
Figure 4.. Theta phase in the frontoparietal network modulates higher-frequency power.
All plots show the percent change in power (relative to the mean power at each frequency, from 9–60 Hz), as a function of theta phase. (A, B) Within-region phase-amplitude coupling (PAC), between theta phase and higher-frequency power, when response fields overlapped either the cued (orange) or the uncued (blue) location. (B) The strength of this coupling was measured by using the fast Fourier transform to extract the amplitude of a one-cycle, sinusoidal component (Fig. 3A, B). The black (cued location) and gray (uncued location) dots represent statistically significant PAC after corrections for multiple comparisons. The shaded regions represent statistically significant differences in PAC between the cued and uncued conditions. (C, D) Between-region PAC (67 recording sessions with matching response fields in FEF and LIP), again linking theta phase and higher-frequency power.
Figure 5.
Figure 5.. Between-region coupling demonstrates theta-band connectivity in the frontoparietal network.
(A) LFP-LFP phase coupling (measured by the phase-locking value [PLV]) when response fields overlapped either the cued (orange) or the uncued (blue) location. (B) Spike-LFP phase coupling (measured by the pairwise phase consistency [PPC]) for visual neurons (N = 36). Spikes in FEF were correlated with oscillatory phase in LIP. (C) Granger causal influence when response fields overlapped the cued location (i.e., under conditions of spatial attention), from FEF to LIP (dashed orange) and from LIP to FEF (solid orange). The shaded regions around the lines represent standard error of the mean. The connected black dots represent statistically significant, between-condition findings after corrections for multiple comparisons.
Figure 6.
Figure 6.. Between-region spike-LFP phase coupling (from 3–60 Hz) when either the cued or uncued location fell within the receptive/response fields, by cell type.
(A) Spikes in FEF were correlated with oscillatory phase (as measured using LFPs) in LIP (using the pairwise phase consistency [PPC]), and (B) spikes in LIP were correlated with oscillatory phase in FEF. These results are shown separately for visual and visual-movement neurons. Shaded regions around lines represent SEs. (C, D) The results of Rayleigh tests for non-uniformity of spike times relative to oscillatory phase (by condition and cell type). (C) Spikes in FEF were significantly coupled to theta-band (cue-responsive neurons) and beta-band (cue-target-responsive neurons) oscillations in LIP during spatial attention. There was no significant spike-LFP phase coupling outside the focus of spatial attention (i.e., at the uncued location). (D) Spikes in LIP were significantly coupled to beta-band (cue-target-responsive neurons) and gamma-band (cue-responsive and cue-target responsive neurons) oscillations in FEF during spatial attention. There was also significant spike-LFP phase coupling in the gamma band (cue-target-responsive neurons) outside the focus of spatial attention (i.e., at the uncued location).
Figure 7.
Figure 7.. A schematic representing a neural basis of rhythmic sampling during spatial attention.
Theta (3–8 Hz) phase organizes neural activity in the frontoparietal network into two rhythmically alternating attentional states. The first state is characterized by (i) an FEF-dominated, spatially non-specific boost in beta-band activity (16–35 Hz), associated with suppressed attentional shifts, and (ii) an LIP-dominated, spatially specific boost in gamma-band activity (> 35 Hz), associated with enhanced visual processing and better behavioral performance at the cued location. The second state is characterized by a spatially specific boost in LIP-specific alpha-band activity (9–15 Hz), associated with attenuated visual processing and worse behavioral performance at the cued location.

Comment in

  • Attention Cycles.
    VanRullen R. VanRullen R. Neuron. 2018 Aug 22;99(4):632-634. doi: 10.1016/j.neuron.2018.08.006. Neuron. 2018. PMID: 30138586

References

    1. Aru J, Aru J, Priesemann V, Wibral M, Lana L, Pipa G, Singer W, and Vicente R (2015). Untangling cross-frequency coupling in neuroscience. Current opinion in neurobiology 31, 51–61. - PubMed
    1. Barash S, Bracewell RM, Fogassi L, Gnadt JW, and Andersen RA (1991a). Saccade-related activity in the lateral intraparietal area. I. Temporal properties; comparison with area 7a. Journal of neurophysiology 66, 1095–1108. - PubMed
    1. Barash S, Bracewell RM, Fogassi L, Gnadt JW, and Andersen RA (1991). Saccade-related activity in the lateral intraparietal area. II. Spatial properties. Journal of neurophysiology 66, 1109–1124. - PubMed
    1. Bastos AM, Vezoli J, Bosman CA, Schoffelen JM, Oostenveld R, Dowdall JR, De Weerd P, Kennedy H, and Fries P (2015). Visual Areas Exert Feedforward and Feedback Influences through Distinct Frequency Channels. Neuron 85, 390–401. - PubMed
    1. Benedetto A, and Morrone MC (2017). Saccadic Suppression Is Embedded Within Extended Oscillatory Modulation of Sensitivity. The Journal of neuroscience : the official journal of the Society for Neuroscience 37, 3661–3670. - PMC - PubMed

Publication types