. 2018 Aug 22;99(4):854-865.e5.
doi: 10.1016/j.neuron.2018.07.032.

Neural Mechanisms of Sustained Attention Are Rhythmic

Affiliations

Neural Mechanisms of Sustained Attention Are Rhythmic

Randolph F Helfrich et al. Neuron. .

Abstract

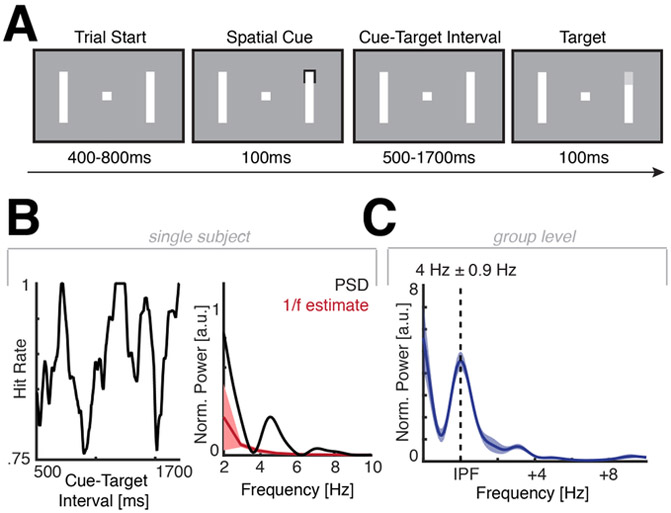
Classic models of attention suggest that sustained neural firing constitutes a neural correlate of sustained attention. However, recent evidence indicates that behavioral performance fluctuates over time, exhibiting temporal dynamics that closely resemble the spectral features of ongoing, oscillatory brain activity. Therefore, it has been proposed that periodic neuronal excitability fluctuations might shape attentional allocation and overt behavior. However, empirical evidence to support this notion is sparse. Here, we address this issue by examining data from large-scale subdural recordings, using two different attention tasks that track perceptual ability at high temporal resolution. Our results reveal that perceptual outcome varies as a function of the theta phase even in states of sustained spatial attention. These effects were robust at the single-subject level, suggesting that rhythmic perceptual sampling is an inherent property of the frontoparietal attention network. Collectively, these findings support the notion that the functional architecture of top-down attention is intrinsically rhythmic.

Keywords: discrete perception; electrocorticography; frontoparietal attention network; functional network parcellation; high-frequency activity; intracranial EEG; perceptual cycles; phase-dependent behavior; rhythmic attention; theta oscillations.


Figures

Figure 1
Figure 1. Task design and behavioral results of experiment 1
(A) Schematic task design. Participants initiated the trial start by pressing a button. After a variable delay, a brief spatial cue indicated the most likely position of the upcoming target (72% validity). Then, a variable cue-target-interval followed (500 – 1700ms), before a close-to-sensory-threshold target appeared at either the cued location, an uncued location or was omitted. Participants released the button when they detected the target. (B) Left: Time-resolved behavioral time course from subject S7 (see also Figure S1). Note the waxing and waning pattern over time. Right: FFT of the behavioral time course (black). In order to disentangle fractal 1/f and oscillatory components, we estimated the background 1/f spectrum (red; mean ± 3 SD) and only considered distinct peaks that exceeded this distribution. (c) Group level results after peak alignment to the individual peak frequency (IPF). We detected a peak in the theta-band with a mean of ~4 Hz in every participant (Figure S1).
Figure 2
Figure 2. High frequency band activity is nested in cortical theta oscillations
(A) Overlap of all implanted electrodes in experiment 1 across all subjects (N = 7) overlaid on a standardized brain in MNI space. See Figure S1 for individual electrode placement. (B) Grand-average HFB time courses (mean ± SEM across subjects) of either cue-locked (left) or target-locked HFB activity (right). Note the apparent sustained activity at cue-responsive (cue+; cue-unresponsive electrodes: cue-) electrodes in cue-target-interval (grey shaded), which was also spatially selective (Figure S3A). (C) Three single trial examples from a cue+ parietal electrode. Upper: Note the response to the cue (black line). However, after the offset of the cue+ (grey line), the HFB activity waxes and wanes and is not as static as Figure 2B and Figure S3A suggested. Target onset is depicted by black dashed line and the response is depicted in green. Note that trial 3 (lower panel) was a miss. Next, we detected all the HFB peaks (red asterisks) after cue offset (grey) and before target onset (black dashed line). (D) Peak-triggered average (± 0.5s; HFB peak at 0s) of the same parietal electrode. Note that the HFB peak is nested in an ongoing 4 Hz oscillation (black depicts the average, grey line a sine fit to the average). (E) Subject-level results. Left: FFT spectra (mean ± SEM) across all cue+ and cue− channels. Note the peak at 4 Hz for cue-responsive electrodes, which was again also spatially selective (Figure S3B) Center: Grand-average peak-triggered average across all cue+ electrodes (mean ± SEM) can easily be approximated by a 4 Hz sine fit (grey line) and reflects the peak in the power spectrum (Left). Right: Note that no similar peak was detected at the cue− electrodes (red). (F) Mean-normalized group-level results (error bars indicate bootstrapped 95% confidence intervals (CI) around the mean in red; black dots/grey lines depict individual participants). All subjects exhibited enhanced theta-band power in the peak-triggered spectra at cue+ electrodes. The arrow indicates the example subject (Figure 2E).
Figure 3
Figure 3. Theta-phase dependent hit rate modulation
(A) Analytical approach exemplified for a single parietal electrode. Left: Phase-resolved hit rates in the range from 3-5 Hz. Note the non-uniform distribution across 50 bins (± 45°). We calculated the normalize d Kullback-Leibler divergence against a uniform distribution. Center: We then randomly shuffled condition labels (correct/incorrect) and repeated the analysis. The histogram shows the distribution of KL values after 1000 iterations. The observed value is indicated in red and was then z-scored relative to the mean and SD of the surrogate distribution. Right: This analysis was performed for 17 logarithmically spaced frequencies ranging from 2-32 Hz. The grey shaded area depicts the mean of the surrogate distribution ± 2 SD. The red line indicates observed values. Note that only the 4 Hz phase significantly predicted the hit rate, while no significant modulation was detected at any other frequency bin. (B) Same data as in panel A, but now the hit rate is color-coded and displayed as a function of phase and frequency. Again, note the modulation around 4 Hz. (C) Grand-average (mean ± SEM) across all electrodes for this subject. Note that rhythmic sampling is enhanced in lower frequencies at cue+ electrodes. (D) Mean-normalized group-level results (in red: error bars indicate bootstrapped 95% CI around the mean; black dots/grey lines depict individual participants). All subjects exhibited enhanced rhythmic theta-band (~ 4 Hz) sampling at cue+ electrodes. The arrow indicates the example subject (Figure 3C).
Figure 4
Figure 4. Large-scale network dynamics underlying rhythmic perceptual sampling
(A) Left: Topographical depiction of rhythmic sampling in one example participant who was implanted with bilateral grids. Note that multiple regions contributed to the rhythmic sampling including frontal regions (upper right), sensorimotor regions (center right) and parietal regions (lower right). See Figure S5 for data from all participants. We seeded the electrode with the strongest phase-dependent behavioral modulation (lower right, located in IPS5). (B) Then we calculated seed-based correlations based on the phase-resolved behavioral data, which indicated that parietal and frontal areas exhibit the same preferred phase for optimal behavior.
Figure 5
Figure 5. Task design and behavioral results of experiment 2
(A) Schematic task design. Participants fixated a cross on a dynamic background with a number of visual distractors (red), which were randomly switched on or off. After a variable delay a centrally presented spatial cue indicated the hemifield that participants should covertly monitor. After variable cue-target-interval (1000 – 2000ms) a blue square was presented at the target and subject responded if the target was presented in the cued hemifield. (B) Left: Time-resolved behavioral time course from one example subject (see also Figure S6). Note the waxing and waning pattern over time. Right: FFT of the behavioral time course (black) and the fractal 1/f component (red). Note the strong peak around 4-5 Hz.(c) Group level results after peak alignment to the individual peak frequency (IPF). We detected a peak in the theta-band with a mean of ~4.1 Hz in every participant (Figure S6).
Figure 6
Figure 6. Neural correlates of rhythmic attentional sampling in experiment 2
Overlap of all implanted electrodes in experiment 2 across all subjects (N = 8) overlaid on a standardized brain in MNI space. See Figure S6 for individual electrode placement. (B) Grand-average HFB time courses (mean ± SEM) of either cue-locked (left) or target-locked HFB activity (right). (C) Upper: Peak-triggered average (± 0.5s; HFB peak at 0s; mean ± SEM) of all cue+ electrodes (blue) and an unconstrained sine fit (grey, ~7 Hz). Lower: FFT spectra of peak-triggered averages for cue+ (blue) and cue− electrodes (red). Note a peak around 3-4 Hz and around 7-8 Hz. (D) Mean-normalized group-level results (error bars indicate bootstrapped 95% CI around the mean (in red); black dots/grey lines depict individual participants). All subjects exhibited enhanced ~4 Hz power in the peak-triggered spectra at cue+ electrodes. This effect was not significant in the alpha-band. The arrow indicates the example subject (Figure 6C). (E) Left: Observed (red) and surrogate (grey shaded; mean ± 2SD) phase-dependent reaction time modulation for one parietal electrode. Right: Color-coded reaction time as a function of phase and frequency from the same electrode. (F) Grand-average (mean ± SEM) across all electrodes for this subject. Note that rhythmic sampling is enhanced in lower frequencies at cue+ electrodes. (G) Mean-normalized group-level results (error bars indicate bootstrapped 95% CI around the mean (in red); black dots/grey lines depict individual participants) reflecting enhanced rhythmic theta-band sampling at cue+ electrodes. The arrow indicates the example subject (Figure 6F).
Figure 7
Figure 7. Large-scale dynamics of rhythmic perceptual sampling in experiment 2
(A) Topographical depiction of rhythmic sampling. Note that the left and right hemispheres depict two different subjects, but show a consistent pattern with strong rhythmic sampling in parietal and frontal areas. See also Figure S7. (B) Seed-based functional network parcellation highlights similar functional relationships between the ongoing theta phase and behavior in parietal and frontal regions.

Comment in

  • Attention Cycles.
    VanRullen R. VanRullen R. Neuron. 2018 Aug 22;99(4):632-634. doi: 10.1016/j.neuron.2018.08.006. Neuron. 2018. PMID: 30138586

References

    1. Aru J, Aru J, Priesemann V, Wibral M, Lana L, Pipa G, Singer W, and Vicente R (2015). Untangling cross-frequency coupling in neuroscience. Curr. Opin. Neurobiol. 31, 51–61. - PubMed
    1. Bastos AM, Vezoli J, Bosman CA, Schoffelen J-M, Oostenveld R, Dowdall JR, De Weerd P, Kennedy H, and Fries P (2015). Visual areas exert feedforward and feedback influences through distinct frequency channels. Neuron 85, 390–401. - PubMed
    1. Bastos AM, Loonis R, Kornblith S, Lundqvist M, and Miller EK (2018). Laminar recordings in frontal cortex suggest distinct layers for maintenance and control of working memory. Proc. Natl. Acad. Sci. U. S. A - PMC - PubMed
    1. Bellet J, Chen C-Y, and Hafed ZM (2017). Sequential hemifield gating of alpha and beta behavioral performance oscillations after microsaccades. J. Neurophysiol. jn.00253.2017. - PMC - PubMed
    1. Berens P (2009). CircStat: A MATLAB Toolbox for Circular Statistics. J. Stat. Softw. 31, 21.

Publication types