. 2018 Sep 18;115(6):951-956.
doi: 10.1016/j.bpj.2018.07.028. Epub 2018 Aug 4.

Simultaneously Measuring Image Features and Resolution in Live-Cell STED Images

Affiliations

Simultaneously Measuring Image Features and Resolution in Live-Cell STED Images

Andrew E S Barentine et al. Biophys J. .

Abstract

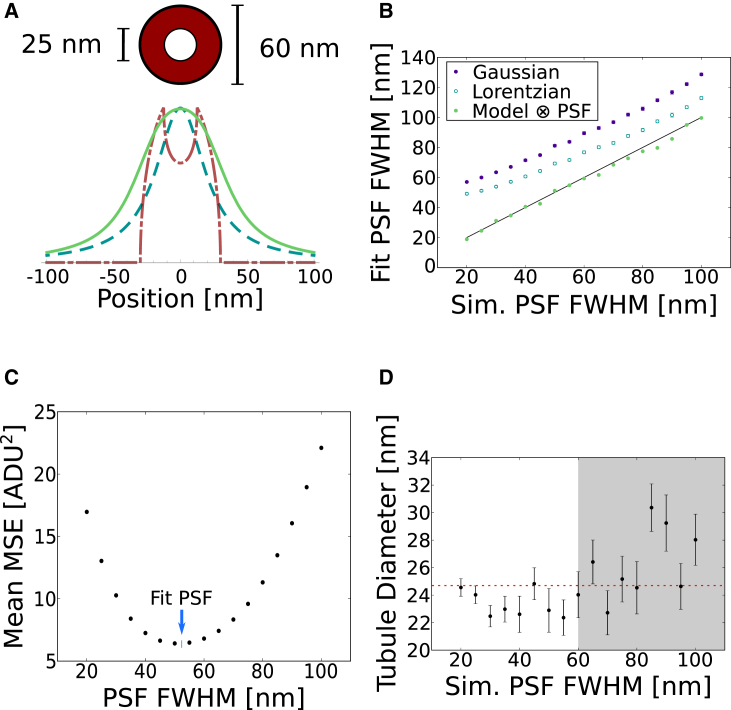
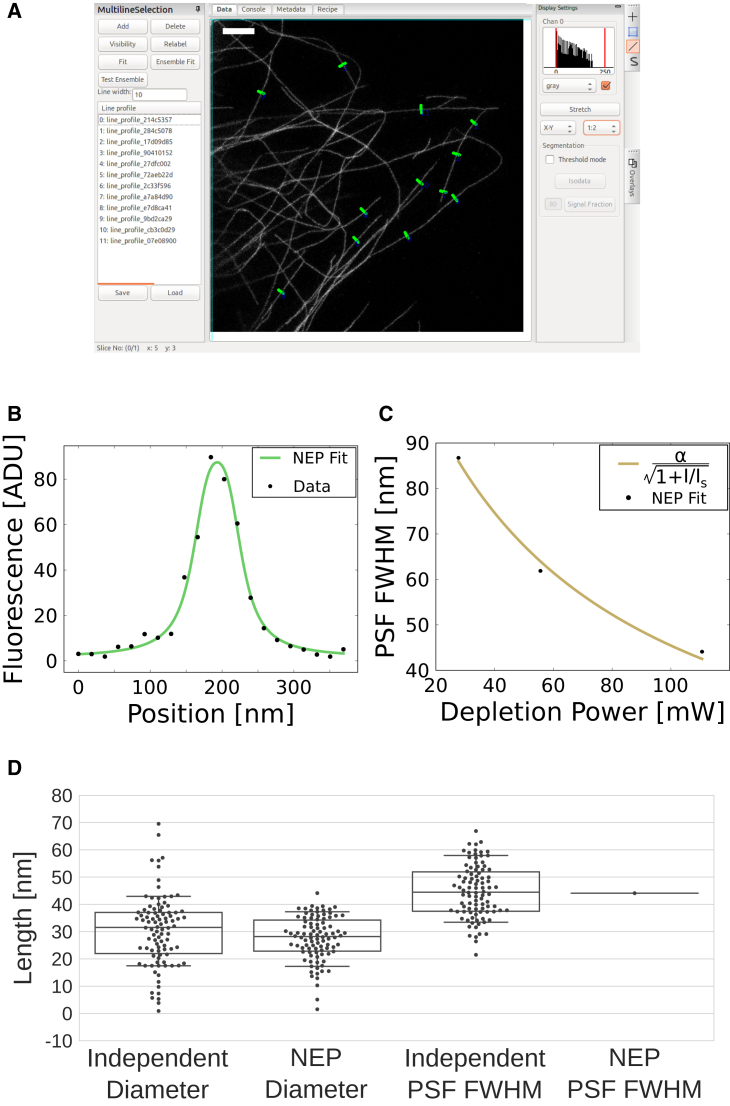
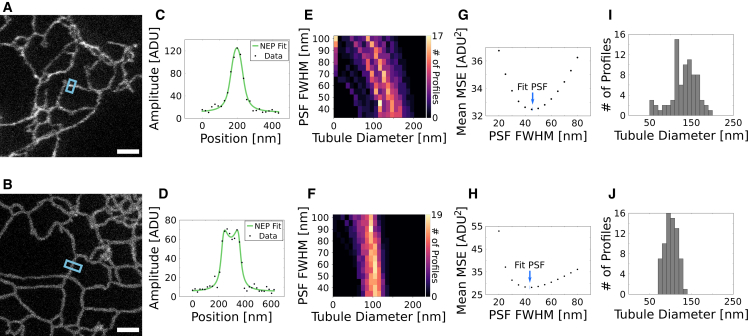
Reliable interpretation and quantification of cellular features in fluorescence microscopy requires an accurate estimate of microscope resolution. This is typically obtained by measuring the image of a nonbiological proxy for a point-like object, such as a fluorescent bead. Although appropriate for confocal microscopy, bead-based measurements are problematic for stimulated emission depletion microscopy and similar techniques where the resolution depends critically on the choice of fluorophore and acquisition parameters. In this article, we demonstrate that for a known geometry (e.g., tubules), the resolution can be measured in situ by fitting a model that accounts for both the point spread function (PSF) and the fluorophore distribution. To address the problem of coupling between tubule diameter and PSF width, we developed a technique called nested-loop ensemble PSF fitting. This approach enables extraction of the size of cellular features and the PSF width in fixed-cell and live-cell images without relying on beads or precalibration. Nested-loop ensemble PSF fitting accurately recapitulates microtubule diameter from stimulated emission depletion images and can measure the diameter of endoplasmic reticulum tubules in live COS-7 cells. Our algorithm has been implemented as a plugin for the PYthon Microscopy Environment, a freely available and open-source software.


Figures

Figure 1
Figure 1
(A) Annulus used to model fluorophore location, where antibodies and fluorophores are bound to the surface of a 25-nm diameter microtubule (1). The red dash-dot curve represents a projection of the fluorophore distribution (summing over the axial dimension), the teal dashed curve a Lorentzian function that models the PSF, and the green solid curve the convolution of the other two. (B) Microtubule line-profiles were simulated at various resolutions using Lorentzian PSFs, with shot noise added before being fit with simple Gaussian (purple) and Lorentzian (teal hollow) functions. The same profiles were also fit using NEP fitting (green), which results in good agreement with the ground truth of the simulations (black line). N = 50 profiles were fit for each simulated PSF width. (C) Plot of mean MSE for fits performed with the Lorentzian-convolved model function at specified PSF widths on simulated microtubule profiles. These profiles were generated with a 50-nm PSF and added shot noise. NEP fitting minimizes the mean MSE with a PSF FWHM of 51.2 nm, as indicated by the blue arrow. (D) Plot of microtubule diameters determined by NEP fitting, where images were simulated at various resolutions (N = 50 profiles at each PSF width, error bars denote standard error of the mean). The ground truth diameter was 25 nm for all profiles, as shown by the dashed red line. The gray region of the plot indicates where the simulated PSF FWHM is larger than the antibody-coated tubule structure, which results in less accurate tubule diameter fits. To see this figure in color, go online.
Figure 2
Figure 2
(A) PYME GUI showing a STED image of immunolabeled microtubules in a COS-7 cell, imaged with 111-mW STED laser power. Green lines show user-selected profiles to be fit. (B) Plot of raw data and NEP fit of a microtubule profile from (A) are shown. (C) Plot of NEP-fitted PSF widths from STED images of microtubules acquired with different STED powers, which scales as expected by theory (n = 74, n = 71, and n = 94 profiles extracted from N = 8, N = 8, and N = 12 images of N = 3, N = 3, and N = 6 cells, acquired at 28, 56, and 111-mW STED laser powers, respectively), are shown. (D) Swarm- and box-plots of microtubule diameters and PSF FWHM values determined using NEP fitting, where the PSF is constrained to be the same for all microtubule line profile cross sections, and without NEP fitting (standard least-squares fitting), where the PSF is varied independently for each tubule fit, are shown. To see this figure in color, go online.
Figure 3
Figure 3
(A and B) Live-cell STED images of label-filled ((A) SNAP-KDEL) and membrane-labeled ((B) SNAP-Sec61β) ER. (C and D) Fluorescence line profiles, averaged over 10 pixels along the long axis of the tubule, extracted from (A) and (B), respectively, and fit using NEP fitting. (E and F) Heatmaps showing the coupling between tubule diameter and PSF FWHM for label-filled (E) and membrane-labeled (F) ER when standard least-squares fitting is performed with systematically varied PSF FWHM. n = 77 and n = 69 profiles were extracted from N = 7 and N = 7 STED images of N = 4 and N = 2 cells for (E) and (F), respectively. (G and H) Mean MSE values for fits shown in (E) and (F), respectively. The blue arrow indicates the PSF FWHM found by performing NEP fitting on the same tubule line profiles. (I and J) Label-filled (I) and membrane-labeled (J) ER tubule diameters fit using NEP fitting (45.8-nm PSF FWHM for SNAP-KDEL, 43.7-nm PSF FWHM for SNAP-Sec61β). The mean and standard deviations were 132 ± 30 and 101 ± 15 nm for (I) and (J), respectively. Scale bars, 1 μm. ADU, analog-digital units. To see this figure in color, go online.

References

    1. Weber K., Rathke P.C., Osborn M. Cytoplasmic microtubular images in glutaraldehyde-fixed tissue culture cells by electron microscopy and by immunofluorescence microscopy. Proc. Natl. Acad. Sci. USA. 1978;75:1820–1824. - PMC - PubMed
    1. Vicidomini G., Schönle A., Hell S.W. STED nanoscopy with time-gated detection: theoretical and experimental aspects. PLoS One. 2013;8:e54421. - PMC - PubMed
    1. Persson F., Bingen P., Hell S.W. Fluorescence nanoscopy of single DNA molecules by using stimulated emission depletion (STED) Angew. Chem. Int. Ed. Engl. 2011;50:5581–5583. - PMC - PubMed
    1. Nieuwenhuizen R.P., Lidke K.A., Rieger B. Measuring image resolution in optical nanoscopy. Nat. Methods. 2013;10:557–562. - PMC - PubMed
    1. Banterle N., Bui K.H., Beck M. Fourier ring correlation as a resolution criterion for super-resolution microscopy. J. Struct. Biol. 2013;183:363–367. - PubMed

Publication types