. 2018 Aug 23;145(16):dev165431.
doi: 10.1242/dev.165431.

Modeling human somite development and fibrodysplasia ossificans progressiva with induced pluripotent stem cells

Affiliations

Modeling human somite development and fibrodysplasia ossificans progressiva with induced pluripotent stem cells

Taiki Nakajima et al. Development. .

Abstract

Somites (SMs) comprise a transient stem cell population that gives rise to multiple cell types, including dermatome (D), myotome (MYO), sclerotome (SCL) and syndetome (SYN) cells. Although several groups have reported induction protocols for MYO and SCL from pluripotent stem cells, no studies have demonstrated the induction of SYN and D from SMs. Here, we report systematic induction of these cells from human induced pluripotent stem cells (iPSCs) under chemically defined conditions. We also successfully induced cells with differentiation capacities similar to those of multipotent mesenchymal stromal cells (MSC-like cells) from SMs. To evaluate the usefulness of these protocols, we conducted disease modeling of fibrodysplasia ossificans progressiva (FOP), an inherited disease that is characterized by heterotopic endochondral ossification in soft tissues after birth. Importantly, FOP-iPSC-derived MSC-like cells showed enhanced chondrogenesis, whereas FOP-iPSC-derived SCL did not, possibly recapitulating normal embryonic skeletogenesis in FOP and cell-type specificity of FOP phenotypes. These results demonstrate the usefulness of multipotent SMs for disease modeling and future cell-based therapies.

Keywords: Differentiation; Disease modeling; Fibrodysplasia ossificans progressiva; Induced pluripotent stem cells; Paraxial mesoderm.


Conflict of interest statement

Competing interestsThe authors declare no competing or financial interests.

Figures
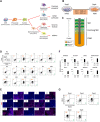
Fig. 1.
Fig. 1.
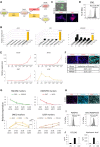
Directed differentiation of human iPSCs toward PSM fate by combined WNT/FGF activation and TGFβ/BMP inhibition. (A) Schematic view of hierarchical induction of SM derivatives. (B) Schematic view of a protocol for PSM induction from human iPSCs (hiPSCs) with WNT activator (CHIR99021, 10 μM), FGF2 (20 ng/ml), TGFβ inhibitor (SB431542, 10 μM) and BMP inhibitor (DMH1, 2 μM). (C) Expression pattern of DLL1 and PAX3 during somitogenesis. (D,E) Investigation of an optimized protocol for PSM induction assessed by FACS with anti-DLL1 antibody and PAX3-GFP (D) and immunocytochemistry analysis (E). Data were obtained from three biological replicates and representative data are shown. Images were acquired in representative areas of each condition (E). Cells were stained with anti-TBX6 antibody (red) and co-stained with DAPI (blue). The SCDF condition (combination of SB431542, CHIR99021, DMH1 and FGF2) most efficiently induced DLL1+ PSM among the 15 conditions considered based on previous developmental biology studies. (F) RT-qPCR analysis of markers for PSC and PSM at day 0 (d0) and day 4 (d4) of PSM induction. Gene expression of iPSCs and DLL1 sorted cells is shown. Error bars represent s.e.m. (n=3). (G) FACS with anti-DLL1 antibody to determine the optimum day for PSM induction. Scale bars: 50 μm. C, CHIR99021 10 μM; D, DMH1 2 μM; F, FGF2 20 ng/ml; S, SB431542 10 μM.
Fig. 2.
Fig. 2.
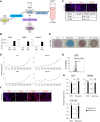
Directed differentiation of PSM toward SM fate by combined WNT activation and TGFβ inhibition. (A) Schematic view of a protocol for SM induction. Sorted DLL1+ PSM cells were treated with WNT activator (CHIR99021, 5 μM) and TGFβ inhibitor (SB431542, 10 μM) for 4 days. (B,C) Investigation of an optimized protocol for SM induction assessed by FACS with anti-DLL1 antibody and PAX3-GFP (B) and immunocytochemistry analysis (C). Cells were stained with anti-paraxis antibody (red) and co-stained with DAPI (blue). The SC condition [combination of WNT activator (CHIR99021, 5 μM) and TGFβ inhibitor (SB431542, 10 μM)] most efficiently induced PAX3-GFP+ SM among the nine conditions considered based on previous developmental biology studies. (D) RT-qPCR analysis of markers for PSM and SM at day 0 (d0), day 4 (d4) and day 8 (d8) from iPSCs. (E) Immunocytochemistry analysis and PAX3-GFP fluorescence at day 4 and day 8 (d8) from iPSCs. Cells were stained with TBX6, paraxis and MEOX1 antibodies (red) and co-stained with DAPI (blue) or PAX3-GFP fluorescence (green) was detected. (F,G) Effect of Wnt signaling on the quality of induced SMs. The characteristics of SM were assessed by RT-qPCR (F) and immunocytochemistry (G) analyses. Cells were stained with anti-CDH11 antibody (red). Error bars represent s.e.m. (n=3). *P<0.05; ***P<0.001 by Dunnett's multiple comparisons t-test compared with S10C5 (F) (n.s, no significant difference). Scale bars: 50 μm. C1, CHIR99021 1 μM; C5, CHIR99021 5 μM; C10, CHIR99021 10 μM; D2, DMH1 2 μM; F20, FGF2 20 ng/ml; I10, IWR1 10 μM; S10, SB431542 10 μM.
Fig. 3.
Fig. 3.
Directed differentiation of SM toward MYO and D fate through DM. (A) Schematic view of protocols for the induction of DM and its derivatives (MYO and D). For DM induction, induced SM was treated with WNT activator (CHIR99021, 5 μM) and BMP4 (10 ng/ml) for 3 days. For MYO induction, induced DM was treated with WNT activator (CHIR99021, 5 μM) for 30 days. For D induction, induced DM was treated with WNT activator (CHIR99021, 5 μM) and BMP4 (10 ng/ml) for 9 days. (B) Investigation of an optimized protocol for DM induction assessed by RT-qPCR at day 3. WNT and BMP signals were considered to be involved in DM induction based on previous developmental biology studies. x-axis: C0.1, C1, C5, CHIR 0.1, 1 and 5 μM, respectively; I10, IWR1 10 μM; ɸ, no compound (IWR1 or CHIR). z-axis: B0.1, B1, B10, BMP4 0.1, 1 and 10 ng/ml, respectively; D10, DMH1 10 μM; ɸ, no compound (DMH1 or BMP4). (C,D) Differentiation toward DM fate was assessed by PAX3-GFP fluorescence and immunocytochemistry (C), and FACS analysis of EN1+ cells (D). The mean±s.e.m. from three sets of experiments are shown. iPSCs were used as controls. (E,F) Differentiation toward MYO fate was assessed by RT-qPCR (E) and immunocytochemistry (F). (G) Differentiation toward D fate was assessed by RT-qPCR. The second vertical axis in DM/D markers indicates EN1 expression. The expression level of DM was set to one. In E and G, the number of days from iPSCs are indicated in brackets whereas the number of days of MYO or D induction are indicated after the cell type and hyphen (e.g. MYO-d6 indicates day 6 of MYO induction). (H,I) Differentiation was also assessed by immunocytochemistry (H) and FACS (I). The mean±s.e.m. from three sets of experiments are shown. DM was used as a control population (I). (J) Additionally, the amounts of collagen type I and hyaluronic acid protein in the culture medium were assessed by enzyme-linked immunosorbent assay. Scale bars: 50 μm. Error bars represent s.e.m. (n=3). ***P<0.001 by Dunnett's multiple comparisons t-test compared with no additional supplement control (ɸ,ɸ) (B).
Fig. 4.
Fig. 4.
Directed SM differentiation toward SCL and SYN fate. (A) Schematic view of protocols for the induction of SCL and its derivatives (SYN and cartilage). For SCL induction, induced SM was treated with Smoothened agonist (SAG, 100 nM) and BMP inhibitor (LDN193189, 0.6 μM) for 3 days. For SYN induction, induced SCL was re-seeded onto a Matrigel-coated culture dish. Cells were treated with FGF8 (20 ng/ml) for 3 days and then a medium containing TGFβ3 (10 ng/ml) and BMP7 (10 ng/ml) until day 21 of the SYN induction. For 3DCI, induced SCL was detached from the dishes and transferred into a 15-ml conical tube with CI basal media supplemented with TGFβ3 (10 ng/ml) and BMP7 (10 ng/ml) for 21 days. (B,C) Differentiation toward SCL fate was assessed by RT-qPCR (B) and immunocytochemistry (C) at the indicated days (d). (D) Immunohistochemistry analysis of type II collagen expression and Hematoxylin and Eosin (HE), Alcian Blue and Safranin O staining in a 3DCI pellet at day 21 of 3DCI. (E-G) Differentiation toward SYN fate was assessed by RT-qPCR (E), immunocytochemistry (F) and FACS (G). The mean±s.e.m. from three sets of experiments are shown. iPSCs were used as control populations (G). (H) Effect of mechanical stretch stimulation on induced SYN was assessed by RT-qPCR. *P<0.05; **P<0.01; ***P<0.001 by Dunnett's multiple comparisons t-test compared with Stretch (-) (H). Error bars represent s.e.m. (n=3). Scale bars: 50 μm (C,F); 100 μm (D). 3DCI, three-dimensional chondrogenic induction; n.s, no significant difference.
Fig. 5.
Fig. 5.
Recapitulation of FOP phenotype shown by two chondrogenesis pathways. (A) Schematic view of a protocol for MSC-like cell induction. Induced SM were treated with FGF2 (4 ng/ml) and FBS (10%) for 12 days. (B) FACS analysis using surface markers for MSCs at day 12 of MSC-like cell induction. CD44+, CD73+, CD105+ and CD45 (PTPRC) cells were induced. SM cells were used as control populations. (C) Schematic view of MSC-like cell-CI and SCL-CI using FOP-iPSCs and resFOP-iPSCs. Briefly, induced MSC-like cells and SCL were spotted onto fibronectin-coated dishes and treated with CI basal media supplemented with activin A (30 ng/ml) for 5 days. (D) ACVR1 expression in MSC-like cells and SCL induced from both FOP-iPSCs and resFOP-iPSCs was assessed by RT-qPCR. Error bars represent s.e.m. (n=6). The expression level of resFOP-MSCs was set to 1. (E-G) Evaluation of MSC-like cell-CI using FOP-iPSCs and resFOP-iPSCs. Chondrogenic differentiation was assessed at day 5 of CI by RT-qPCR analysis (E), Alcian Blue staining (F) and GAG/DNA analysis (G). (H-J) Evaluation of SCL-CI using FOP-iPSCs and resFOP-iPSCs. Chondrogenic differentiation was assessed at day 5 of CI by RT-qPCR analysis (H), Alcian Blue staining (I) and GAG/DNA analysis (J). (K,L) Evaluation of R667 and Rapamycin efficacy on MSC-like cell-CI. Chondrogenic differentiation was assessed at day 5 of CI by Alcian Blue staining (K) and GAG/DNA analysis (L). (M-P) In vitro study regarding cell-of-origins of the ectopic bone observed in FOP. PDGFRα+/CD31 and PDGFRα/CD31 populations were isolated by FACS (M). Chondrogenic potential of each population was assessed at day 5 of CI by GAG/DNA (N) and RT-qPCR analysis (O). Expression levels of PAI1 and MMP1, both surrogate markers of aberrant FOP-ACVR1 signaling, were higher in PDGFRα+/CD31 cells (P). Error bars represent s.e.m. (n=3). *P<0.05; **P<0.01; ***P<0.001 by Student's t-test compared with resFOP (D,E,G,H,J), FOP (L) and PDGFRα/CD31population (N,O,P). n.s, no significant difference. Scale bars: 200 μm. Pas, passage; R667, R667 10 nM; Rapa, rapamycin 10 nM.
Fig. 6.
Fig. 6.
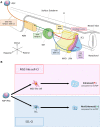
Schematic summary of this study. (A) Recapitulation of human somitogenesis and somite patterning in vitro using human iPSCs. We generated four SM derivatives from human iPSCs in a stepwise manner by referring to these signaling environments during mouse and chick somite development as shown on the diagram. (B) Recapitulation of the FOP phenotype in two chondrogenesis pathways. Chondrogenesis was enhanced in the MSC-like cell-CI pathway but not in the SCL-CI pathway.

Similar articles

Cited by

References

    1. Ahmed M. U., Cheng L. and Dietrich S. (2006). Establishment of the epaxial-hypaxial boundary in the avian myotome. Dev. Dyn. 235, 1884-1894. 10.1002/dvdy.20832 - DOI - PubMed
    1. Aulehla A. and Pourquié O. (2010). Signaling gradients during paraxial mesoderm development. Cold Spring Harb. Perspect Biol. 2, a000869 10.1101/cshperspect.a000869 - DOI - PMC - PubMed
    1. Awaya T., Kato T., Mizuno Y., Chang H., Niwa A., Umeda K., Nakahata T. and Heike T. (2012). Selective development of myogenic mesenchymal cells from human embryonic and induced pluripotent stem cells. PLOS One7, e51638. - PMC - PubMed
    1. Bénazéraf B. and Pourquié O. (2013). Formation and segmentation of the vertebrate body axis. Annu. Rev. Cell Dev. Biol. 29, 1-26. 10.1146/annurev-cellbio-101011-155703 - DOI - PubMed
    1. Bernardo A. S., Faial T., Gardner L., Niakan K. K., Ortmann D., Senner C. E., Callery E. M., Trotter M. W., Hemberger M., Smith J. C. et al. (2011). BRACHYURY and CDX2 mediate BMP-induced differentiation of human and mouse pluripotent stem cells into embryonic and extraembryonic lineages. Cell Stem Cell 9, 144-155. 10.1016/j.stem.2011.06.015 - DOI - PMC - PubMed

Publication types