. 2018 Aug 24;361(6404):eaau1504.
doi: 10.1126/science.aau1504.

Severing enzymes amplify microtubule arrays through lattice GTP-tubulin incorporation

Affiliations

Severing enzymes amplify microtubule arrays through lattice GTP-tubulin incorporation

Annapurna Vemu et al. Science. .

Abstract

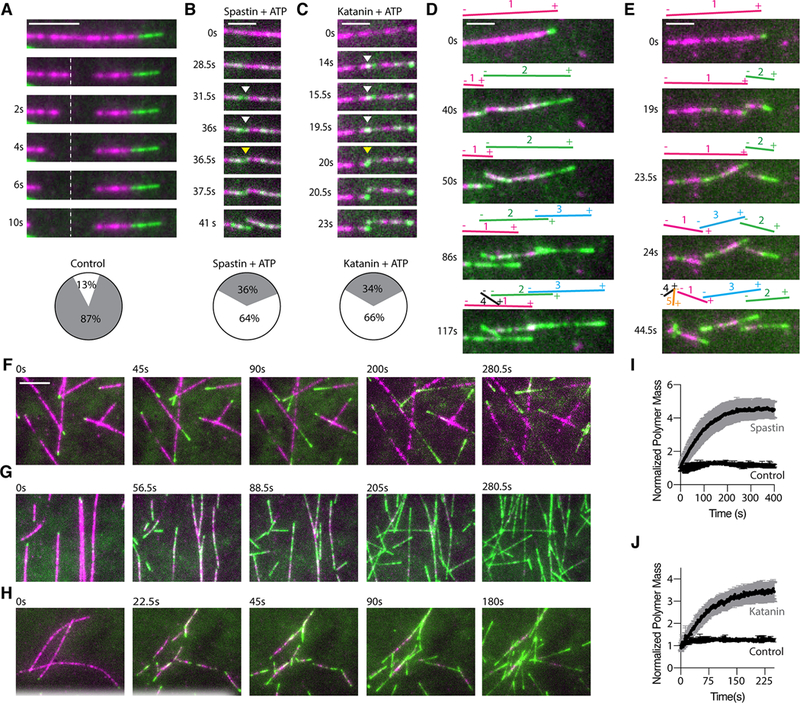
Spastin and katanin sever and destabilize microtubules. Paradoxically, despite their destructive activity they increase microtubule mass in vivo. We combined single-molecule total internal reflection fluorescence microscopy and electron microscopy to show that the elemental step in microtubule severing is the generation of nanoscale damage throughout the microtubule by active extraction of tubulin heterodimers. These damage sites are repaired spontaneously by guanosine triphosphate (GTP)-tubulin incorporation, which rejuvenates and stabilizes the microtubule shaft. Consequently, spastin and katanin increase microtubule rescue rates. Furthermore, newly severed ends emerge with a high density of GTP-tubulin that protects them against depolymerization. The stabilization of the newly severed plus ends and the higher rescue frequency synergize to amplify microtubule number and mass. Thus, severing enzymes regulate microtubule architecture and dynamics by promoting GTP-tubulin incorporation within the microtubule shaft.


Figures

Fig. 1.
Fig. 1.. Spastin and katanin extract tubulin out of the microtubule
(A–C) Microtubules in the absence or presence of 33 nM spastin. The reaction proceeded on-grid for one minute and was imaged using negative stain TEM (Materials and Methods). Boxed regions shown at 2X magnification in insets. Scale bar, 50 nm. Microtubules imaged at 30,000x magnification. Arrows indicate nanoscale damage sites. (D) Fields of GMPCPP microtubules incubated with buffer or 25nM spastin. Severing proceeded in solution and reactions were passively deposited on EM grids, negatively stained and visualized by TEM (Materials and Methods). Arrows indicate nanoscale damage. Microtubules imaged at 13,000x magnification; boxed regions, 30,000x magnification. Scale bar, 50 nm. (E) Microtubule length distribution after spastin incubation; cyan, control; dark and light grey, 2 and 5 min incubation, respectively. (F) Fields of GMPCPP microtubules incubated with buffer or 100 nM katanin imaged as in (D). Scale bar, 50 nm. (G) Microtubule length distribution after katanin incubation; cyan, control; dark and light grey, 2 and 5 min incubation, respectively.
Fig. 2.
Fig. 2.. Spastin and katanin catalyzed nanoscale damage is repaired by spontaneous tubulin incorporation
(A, B) HiLyte647-labeled GMPCPP microtubules (magenta) incubated with buffer (A) or 10 nM spastin for 35 s (B) followed by incubation with 1 μM HiLyte488-labeled GTP-tubulin (cyan) and washing of excess tubulin (Materials and Methods); Arrows designate severing events. (C) HiLyte647-labeled GMPCPP microtubules (magenta) incubated with 2 nM katanin for 90 s followed by incubation with 1 |iM HiLyte488-labeled GTP-tubulin (cyan) and washing of excess tubulin (Materials and Methods). Arrows designate severing events. (D) DIC imaged unlabeled GMPCPP microtubules incubated with 10 nM spastin followed by incubation with 1 μM HiLyte488-labeled GTP-tubulin (cyan) and washing of excess tubulin (Materials and Methods). Insets show severing events. Scale bar, 5 μm.
Fig. 3.
Fig. 3.. Incorporation of soluble tubulin into spastin-induced nanoscale damage sites inhibits microtubule severing
(A) Severing rates in the presence of soluble tubulin (n= 31, 28 and 36 microtubules for no tubulin, 100 nm and 2 μM tubulin, respectively from multiple chambers). Error bars, s.e.m. (B) Intensity distribution of fluorescent tubulin puncta incorporated at spastin-induced nanodamage sites; n=50 and 49 puncta from multiple chambers for 100 nM and 2 μM tubulin, respectively. Bars, mean and s.d. (C) Repair at damage sites delays severing (n=81 and 83 severing events from multiple chambers for 100 nM and 2μM tubulin, respectively). (D) Fraction of GMPCPP microtubules severed by 20 nM spastin within 65 s of initial tubulin incorporation in the presence of 100nM and 2μM HiLyte488 soluble tubulin; Error bars, s.e.m. in (C) and (D). (E) Live imaging of Alexa488 GTP-tubulin (cyan) incorporation into HiLyte647 GMPCPP microtubules (magenta) after spastin induced damage. Scale bar, 1.5 μm. (F) Fluorescence intensity distribution of Alexa488-labeled tubulin (labeling ratio ~1.0) immobilized on glass (black) or incorporated into spastin induced nanodamage sites (cyan); n=188 and 398 for glass immobilized and microtubule incorporated particles, respectively. (G) Spastin-induced nanodamage and spontaneous tubulin repair of GDP microtubules (magenta) grown from axonemes and stabilized with a GMPCPP cap (bright cyan); spastin (5 nM) and 5 μM soluble HiLyte488 GTP-tubulin (cyan). White arrows, tubulin incorporation sites, yellow arrows, severing events. Scale bar, 5 μm. (H) Average completion time of a severing event after spastin perfusion. GMPCPP microtubules (brown), GMPCPP capped GDP microtubules (grey) in the absence or presence of soluble tubulin; n=36, 63, 34 and 27 microtubules from multiple chambers for GMPCPP, GMPCPP capped GDP microtubules with 0, 2 μM and 5 μM soluble GTP-tubulin, respectively. Bars, mean and s.d.; **** p-value of < 0.0001 determined by two-tailed t-test for (B), (C), (D) and (H).
Fig. 4.
Fig. 4.. Spastin and katanin promote GTP-tubulin island formation and increase rescues
(A, B) Time course of a dynamic 10% HiLyte647-labeled microtubule (magenta) at 12 μM tubulin in the presence of 25nM spastin without (A) or with ATP (B) showing HiLyte488-labeled tubulin incorporation (cyan) at the microtubule tip (A) or incorporation along the microtubule in addition to the tip (B). First micrograph for each condition was recorded just before the perfusion of 12 μM 10% HiLyte488-labeled tubulin into the chamber. Scale bar, 2μm. (C, D) Time course of a dynamic 10% HiLyte647-labeled microtubule (magenta) at 12 μM tubulin in the presence of 25nM katanin without (C) or with ATP (D) showing HiLyte488-labeled tubulin incorporation (cyan) at the microtubule tip (C) or incorporation along the microtubule in addition to the tip (D). First micrograph for each condition was recorded just before the perfusion of 12 μM 10% HiLyte488- labeled tubulin into the chamber. Scale bar, 2μm. (E) Rescue frequency at 10 μM tubulin in the absence or presence of 25 nM spastin and 25 nM katanin and ATP; n = 47, 45, and 61 microtubules from multiple chambers for control without enzyme, spastin and katanin, respectively. ****, p-value of < 0.0001 determined by the Mann-Whitney test; error bars, s.e.m. throughout. (F) Probability of rescue of a depolymerizing microtubule in the absence or presence of spastin and katanin with ATP; n = 68, 57, 78 depolymerization events for control, spastin and katanin, respectively. ****, p-value of < 0.0001 determined by two-tailed t-test. (G, H) Growth rates (G) and catastrophe frequency (H) in the absence or presence of spastin and katanin and ATP; n = 56, 37 and 34 growth events for control, spastin and katanin, respectively in (G) and n = 62, 70, and 71 microtubules for control, spastin and katanin, respectively in (H).
Fig. 5.
Fig. 5.. Enzyme generated GMPCPP-islands protect against depolymerization and act as rescue sites
(A) Experiment schematic. GDP microtubules (solid magenta) were polymerized from seeds (black) and capped with GMPCPP-tubulin (magenta outline). Spastin, ATP and GMPCPP-tubulin (green) were added and washed out of the chamber. Microtubules were laser-ablated in the absence (B-F) or presence of GTP-tubulin (G-K) (Materials and Methods). (B) Kymograph of a depolymerizing laser-ablated microtubule (magenta) pre-incubated with spastin, no ATP. (C) Kymographs of depolymerizing laser-ablated microtubules pausing at GMPCPP-tubulin islands (green) introduced by spastin, 1mM ATP. White arrows, pauses. Horizontal scale bars, 5μm; vertical, 10 sec. (D) Pie chart shows proportion of depolymerization events that paused at GMPCPP-islands (white) or did not (grey); n = 44. (E) Depolymerization rates of microtubules without GMPCPP-islands pre-incubated with spastin, no ATP or through GMPCPP-islands introduced by spastin, 1mM ATP; n = 17 and 7 microtubules for no ATP and ATP, respectively. (F) Fluorescence intensity of GMPCPP-islands through which microtubules depolymerized or paused; n = 9 and 14, respectively. (G, H) Kymographs of laser-ablated microtubules in the presence of 7μM soluble GTP-tubulin after pre-incubation with spastin no ATP showing complete depolymerization (G) or rescue (green arrows) at a GMPCPP-island introduced by spastin, ATP (H). Horizontal scale bar, 5μm; vertical, 20 sec. (I) Rescue frequency of laser-ablated microtubules incubated with spastin, with or without ATP; n = 23 and 24 microtubules, respectively. (J) Depolymerization rates in the presence of 7μM GTP-tubulin of microtubules pre-incubated with spastin, no ATP or through GMPCPP-islands introduced by spastin, ATP; n = 9 and 6 microtubules, respectively. (K) Intensity of GMPCPP-islands that did not stop depolymerization (n=6) or at which microtubules rescued in the spastin, ATP condition (n = 9). **, ***, p-values of < 0.01 and 0.001 respectively determined by the Mann-Whitney test. Error bars, s.e.m. throughout.
Fig. 6.
Fig. 6.. Spastin and katanin generated GTP-tubulin islands recruit EB1
(A) Time course of EB1-GFP (green) on a dynamic microtubule (magenta) in the presence of 25nM spastin without or with ATP. Scale bar, 2 μm. Line scans on the right show EB1-GFP intensity profiles along the microtubule at indicated times. Intensity profiles start on the microtubule lattice and end at the microtubule tip. (B) Density of EB1-GFP puncta on microtubules incubated without spastin or with spastin without and with ATP; error bars, s.e.m. (C) Time course of EB1-GFP on a dynamic microtubule in the presence of 25nM katanin without and with ATP. Intensity profiles as in (A). (D) Density of EB1-GFP puncta on microtubules incubated without katanin or with katanin without or with ATP; error bars, s.e.m. (E) Co-localization of newly incorporated GTP-tubulin (magenta, top panel) and EB1-GFP (green, middle panel) in the presence of spastin and ATP. Bottom panel, overlay. Images acquired immediately after perfusing enzyme and EB1-GFP into chamber. Scale bar, 2μm. (F) Fluorescence intensity of incorporated tubulin (magenta) and EB1-GFP (green) along the microtubule lattice in (E) showing their co-localization. 89% of tubulin islands co-localize with EB1-GFP (n = 38 puncta from 22 microtubules from multiple chambers measured immediately after perfusion of 10% HyLite647-tubulin). (G) Time course of laser-ablated dynamic microtubules (magenta) incubated with 25 nM spastin, ATPγS (left) or spastin, ATP (right) in the presence of 50 nM EB1-GFP (green) (Materials and Methods). The dotted line marks the ablated region and start of depolymerization. Scale bar, 2 μm. (H, I) Pie charts show fates of plus-ends generated through laser-ablation of microtubules incubated with spastin (H) or katanin (I) with ATPγS or ATP; % of plus-ends that depolymerized (grey) or rescued (white) within 4 s after ablation; n = 13 and 13 microtubules for spastin ATPγS and ATP, respectively, from multiple chambers; n = 54 and 9 microtubules for katanin ATPγS and ATP, respectively, from multiple chambers.
Fig. 7.
Fig. 7.. Severing enzyme-based microtubule number and mass amplification
Plus-ends generated through laser ablation depolymerize. Pie chart shows % of plus-ends that are stable (white) or depolymerize (grey) ; n = 32 microtubules from multiple chambers. Scale bar, 5μm. (B, C) Spastin (B) or katanin (C) severed ends emerge with newly incorporated GTP-tubulin and are stable. Pie chart shows % of plus-ends that are stable (white) or depolymerize (grey); n= 96 and 94 for spastin and katanin, respectively from multiple chambers. Scale bar, 2μm. (D, E) Time lapse showing consecutive spastin (D) or katanin (E) induced severing events on a microtubule. Microtubule (magenta), incorporated tubulin (green). Scale bar, 2μm. (F) Time lapse showing microtubule dynamics at 12μM tubulin in the absence of severing enzyme. Green, newly incorporated tubulin at the growing ends. The last two frames are bleach corrected. Scale bar, 5μm. (G, H) Time lapse showing microtubule number and mass amplification through spastin (G) and katanin (H) severing. Green, newly incorporated HiLyte-488 tubulin perfused into the chambers together with the severing enzymes. (I, J) Microtubule mass as a function of time; n = 4, 5 and 4 chambers for control, spastin and katanin, respectively; error bars, s.e.m.

Comment in

References

    1. Roll-Mecak A, McNally FJ, Microtubule-severing enzymes. Current opinion in cell biology 22, 96–103 (2010). - PMC - PubMed
    1. Sherwood NT, Sun Q, Xue M, Zhang B, Zinn K, Drosophila spastin regulates synaptic microtubule networks and is required for normal motor function. PLoS Biol 2, e429 (2004). - PMC - PubMed
    1. Trotta N, Orso G, Rossetto MG, Daga A, Broadie K, The hereditary spastic paraplegia gene, spastin, regulates microtubule stability to modulate synaptic structure and function. Current Biology 14, 1135–1147 (2004). - PubMed
    1. Stone MC et al., Normal spastin gene dosage is specifically required for axon regeneration. Cell reports 2, 1340–1350 (2012). - PMC - PubMed
    1. Ahmad FJ, Yu W, McNally FJ, Baas PW, An essential role for katanin in severing microtubules in the neuron. The Journal of cell biology 145, 305–315 (1999). - PMC - PubMed

Publication types

LinkOut - more resources