. 2018 Sep 28;361(6409):eaar3146.
doi: 10.1126/science.aar3146. Epub 2018 Aug 23.

Allele-specific epigenome maps reveal sequence-dependent stochastic switching at regulatory loci

Affiliations

Allele-specific epigenome maps reveal sequence-dependent stochastic switching at regulatory loci

Vitor Onuchic et al. Science. .

Abstract

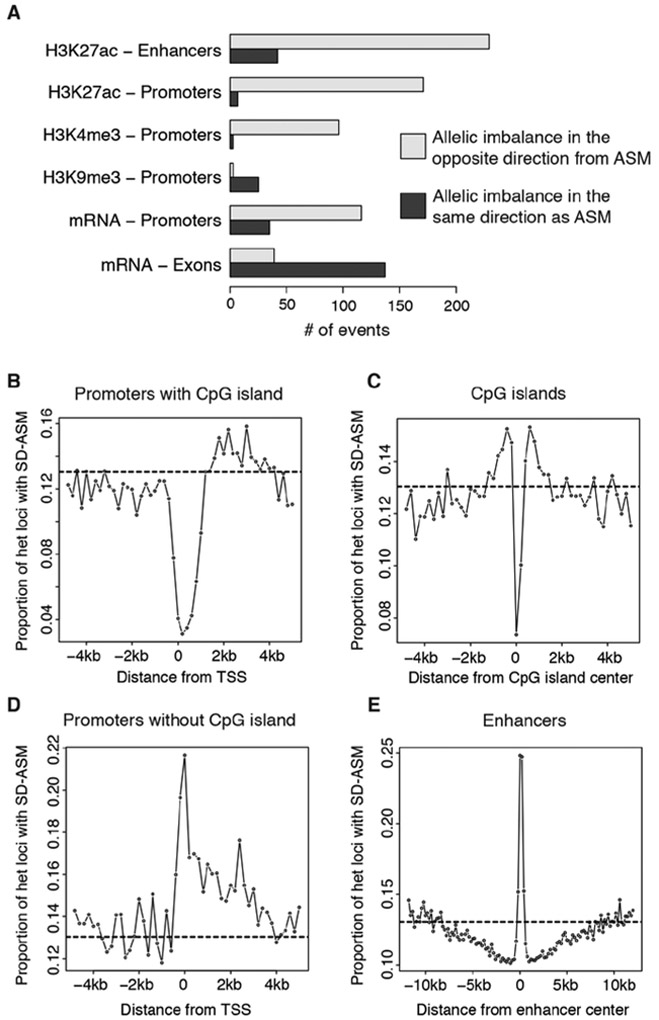
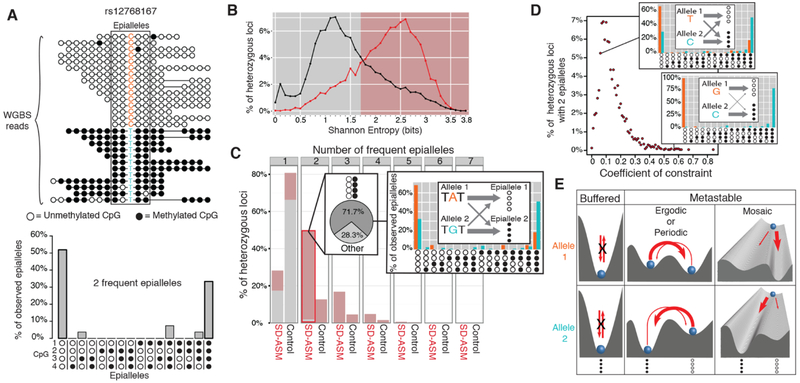
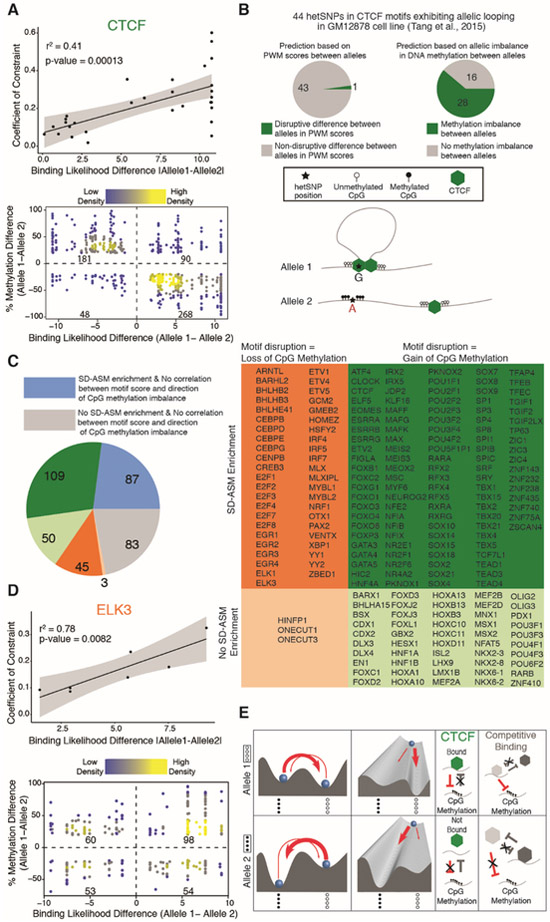
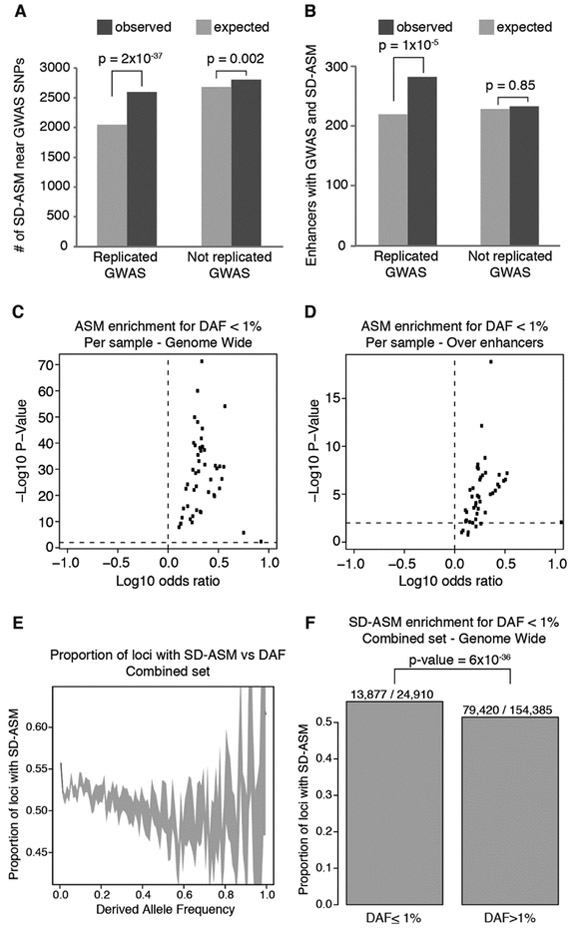
To assess the impact of genetic variation in regulatory loci on human health, we constructed a high-resolution map of allelic imbalances in DNA methylation, histone marks, and gene transcription in 71 epigenomes from 36 distinct cell and tissue types from 13 donors. Deep whole-genome bisulfite sequencing of 49 methylomes revealed sequence-dependent CpG methylation imbalances at thousands of heterozygous regulatory loci. Such loci are enriched for stochastic switching, which is defined as random transitions between fully methylated and unmethylated states of DNA. The methylation imbalances at thousands of loci are explainable by different relative frequencies of the methylated and unmethylated states for the two alleles. Further analyses provided a unifying model that links sequence-dependent allelic imbalances of the epigenome, stochastic switching at gene regulatory loci, and disease-associated genetic variation.


Figures

Fig. 1.
Fig. 1.. Allelic imbalances vary depending on genomic region.
(A) Number of allelic imbalances in histone marks and transcription, overlapping ASM loci, over classes of genomic elements. (B to E) Proportions of SD-ASM loci over total heterozygous loci in 200bp bins near promoters, CpG islands, and enhancers.
Fig. 2.
Fig. 2.. Differences in epiallele frequency spectra causing SD-ASM.
(A) Example of an epiallele frequency spectrum (below) derived from observed epialleles in WGBS reads (top). (B) Histograms of Shannon entropy, in bits, for the epiallele frequency spectra for the hets showing SD-ASM (red) and the nearest (control) hets without SD-ASM (black). (C) Most heterozygous loci with two frequent epialleles show SD-ASM, have entropy larger than 1.7 bits (red portion of the bar), the two epialleles being biphasic (fully methylated or fully unmethylated) 71.7% of the time. The callout on the right provides an example of a het where the difference between epiallele frequency spectra of allele 1 (A, orange) and allele 2 (G, blue) explain SD-ASM. (D). Histogram of Coefficients of Constraint for SD-ASM loci with two frequent epialleles. The callouts illustrate an example het (T/C, top right callout) with a low, and another (G/C, bottom right callout) with a high Coefficient of Constraint. (E) Illustration of buffering in contrast to ergodic/periodic and mosaic metastability.
Fig. 3.
Fig. 3.. Correlations between allelic differences in TF binding affinity, Coefficient of Constraint, and DNA methylation.
(A) (Top) Correlation between absolute CTCF binding affinity differences, based on position weight matrix scores (PWM), and the Coefficient of Constraint for predicted CTCF binding sites with SD-ASM, two frequent epialleles, and a biphasic methylation pattern. (Bottom) Correlation between CTCF binding affinity and DNA methylation at predicted CTCF binding sites. (B) SD-ASM is more predictive of allelic looping (28 true positive of 44 predictions) than motif disruption scores (1 true positive of 44 predictions). To control for specificity, thresholds were selected so that both methods predicted the same number (44) of hets to show allelic looping. (C) SD-ASM at binding sites of 377 TFs defined with the SELEX method. The pie chart on the left and the table on the right indicate both enrichments and directionality trends using a shared color code. (D) Top: Correlation between absolute ELK3 binding affinity differences and the Coefficient of Constraint for predicted binding sites with SD-ASM, two frequent epialleles, and a biphasic methylation pattern; Bottom: Correlation between ELK3 binding affinity and DNA methylation at predicted ELK3 binding sites (E) A mechanistic model of a sequence-dependent energy landscape with two metastable states, Allele 1 (top row) corresponding to a landscape where the most frequently occupied metastable state corresponds to a completely unmethylated epiallele and Allele 2 (bottom row) corresponding to a landscape where the most frequently occupied metastable state corresponds to a completely methylated epiallele. Putative positive feedback loops involving interactions between TF binding and binding site methylation are indicated for CTCF. An alternative model involving competitive binding of two transcription factors is indicated on the right. Significance of correlations tested using t test.
Fig. 4.
Fig. 4.. Association of ASM with disease loci and purifying selection.
(A and B) Enrichment of ASM in the proximity of GWAS loci. ASM hets within 1 kilobase (Kb) of GWAS loci are compared to co-localized hets without ASM. (C to F) Evidence of purifying selection acting on rare variants with ASM. [(C) and (D)] Proportion of variants associated with ASM compared to those without ASM among the rare (DAF < 1%) variants across individual methylomes. [(E) and (F)] Proportion of loci with ASM over total heterozygous loci over windows of increasing DAF in the combined set of methylomes. (F) This bar-chart summary of the data in (E) shows the excess of SD-ASM variants among those with DAF < 1%. Chi-square tests used for significance of enrichments.

References

    1. Kerkel K, Spadola A, Yuan E, Kosek J, Jiang L, Hod E, Li K, Murty VV, Schupf N, Vilain E, Morris M, Haghighi F, Tycko B, Genomic surveys by methylation-sensitive SNP analysis identify sequence-dependent allele-specific DNA methylation. Nat. Genet 40, 904–908 (2008). doi:10.1038/ng.174 Medline - DOI - PubMed
    1. Schalkwyk LC, Meaburn EL, Smith R, Dempster EL, Jeffries AR, Davies MN, Plomin R, Mill J, Allelic skewing of DNA methylation is widespread across the genome. Am. J. Hum. Genet 86, 196–212 (2010). doi:10.1016/j.ajhg.2010.01.014 Medline - DOI - PMC - PubMed
    1. Zhang Y, Rohde C, Reinhardt R, Voelcker-Rehage C, Jeltsch A, Non-imprinted allele-specific DNA methylation on human autosomes. Genome Biol. 10, R138 (2009). doi:10.1186/gb-2009-10-12-r138 - DOI - PMC - PubMed
    1. Gertz J, Varley KE, Reddy TE, Bowling KM, Pauli F, Parker SL, Kucera KS, Willard HF, Myers RM, Analysis of DNA methylation in a three-generation family reveals widespread genetic influence on epigenetic regulation. PLOS Genet. 7, e1002228 (2011). doi:10.1371/journal.pgen.1002228 - DOI - PMC - PubMed
    1. Hellman A, Chess A, Extensive sequence-influenced DNA methylation polymorphism in the human genome. Epigenetics Chromatin 3, 11 (2010). doi:10.1186/1756-8935-3-11 - DOI - PMC - PubMed

Publication types