. 2018 Aug 28;2(16):2115-2126.
doi: 10.1182/bloodadvances.2018022608.

Single-cell heterogeneity in Sézary syndrome

Affiliations

Single-cell heterogeneity in Sézary syndrome

Terkild Brink Buus et al. Blood Adv. .

Abstract

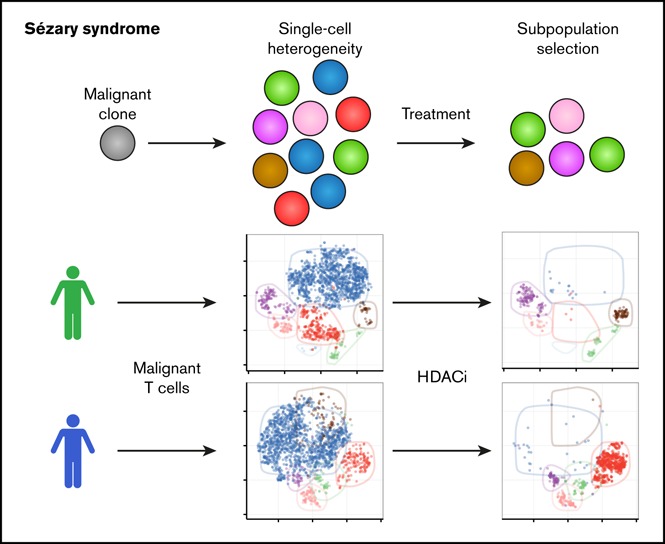
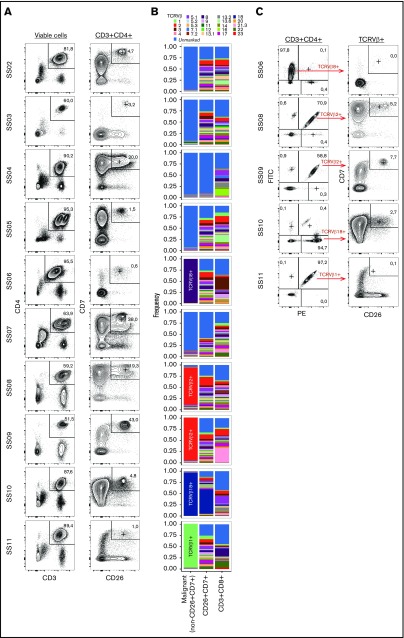
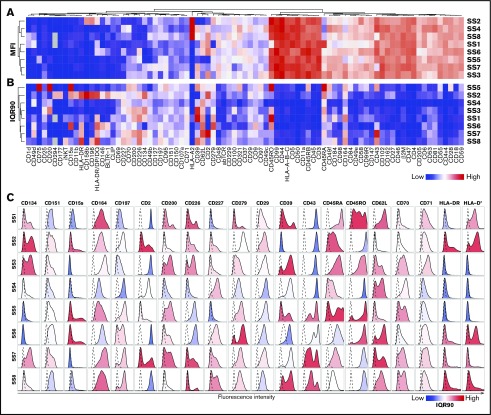
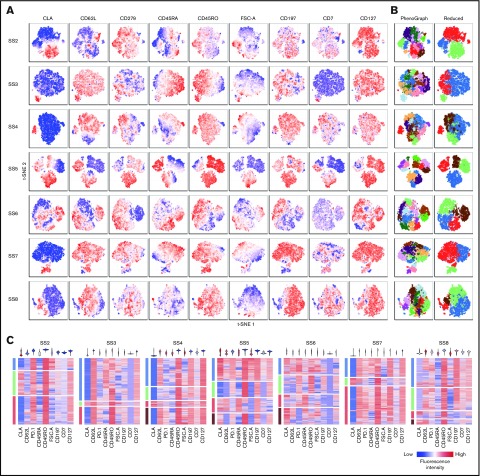
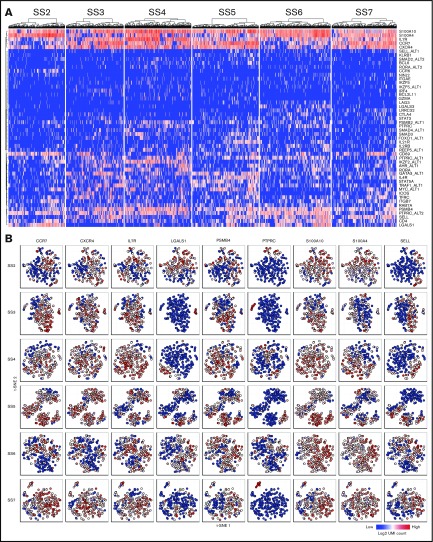
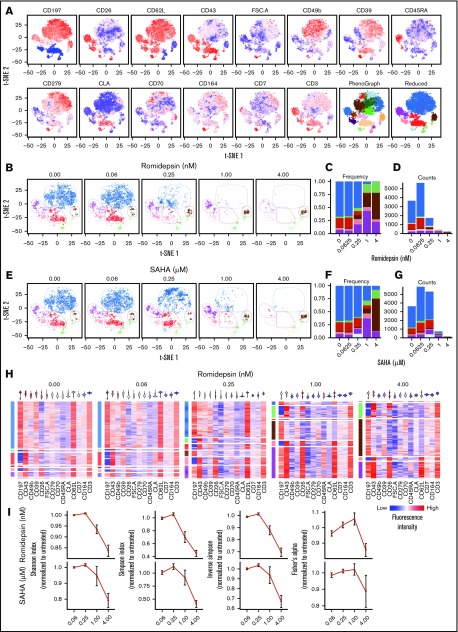
Sézary syndrome (SS) is an aggressive leukemic variant of cutaneous T-cell lymphoma (CTCL) with a median life expectancy of less than 4 years. Although initial treatment responses are often good, the vast majority of patients with SS fail to respond to ongoing therapy. We hypothesize that malignant T cells are highly heterogeneous and harbor subpopulations of SS cells that are both sensitive and resistant to treatment. Here, we investigate the presence of single-cell heterogeneity and resistance to histone deacetylase inhibitors (HDACi) within primary malignant T cells from patients with SS. Using single-cell RNA sequencing and flow cytometry, we find that malignant T cells from all investigated patients with SS display a high degree of single-cell heterogeneity at both the mRNA and protein levels. We show that this heterogeneity divides the malignant cells into distinct subpopulations that can be isolated by their expression of different surface antigens. Finally, we show that treatment with HDACi (suberanilohydroxamic acid and romidepsin) selectively eliminates some subpopulations while leaving other subpopulations largely unaffected. In conclusion, we show that patients with SS display a high degree of single-cell heterogeneity within the malignant T-cell population, and that distinct subpopulations of malignant T cells carry HDACi resistance. Our data point to the importance of understanding the heterogeneous nature of malignant SS cells in each individual patient to design combinational and new therapies to counter drug resistance and treatment failure.


Conflict of interest statement

Conflict-of-interest disclosure: The authors declare no competing financial interests.

Figures

None
Graphical abstract
Figure 1.
Figure 1.
Identification of the malignant population. (A) Gating strategy of nonmalignant CD3+CD4+CD7+CD26+ cells from 10 patients with SS (SS2-SS11). (B) TCRVβ distribution within the CD4+ non-CD26+CD7+ (malignant), CD4+CD26+CD7+ (nonmalignant), and CD8+ T cell populations. Because of incomplete antibody coverage by the TCRVβ screening kit, not all T cells can be assigned to a TCRVβ and are included in the “unmarked” fraction. (C) Assessment of the fraction of CD26+CD7+ cells within the CD4+ population expressing the dominant TCRVβ clone detected in 5 of the 10 patients with SS.
Figure 2.
Figure 2.
Surface marker screening identifies heterogeneity within malignant population. (A-B) Heat map showing (A) MFI or (B) interquantile range (numeric difference between 90% and 10% quantiles: IQR90) of 86 surface markers expressed above isotype levels by at least 10% of the malignant population assayed by flow cytometry. (C) Histograms showing the single-cell distribution of the top 20 most heterogeneously expressed surface markers selected by highest IQR90 within at least 3 patients. Dashed lines display the relevant isotype expression. Histograms are colored by IQR90.
Figure 3.
Figure 3.
Coexpression of surface markers divide malignant cells into subpopulations. (A-B) Coexpression of a panel of surface markers within the malignant population of 7 patients with SS visualized by t-SNE plots colored by (A) fluorescence intensity of the indicated markers or (B) automated clustering using the PhenoGraph algorithm showing all (left) or a reduced number of clusters (right). (C) Single-cell heat maps distributed by reduced PhenoGraph cluster (left bar) and colored by fluorescence intensity of the indicated markers. Violin plots (top) display the overall expression range of the indicated markers within the total malignant population. CLA, cutaneous lymphocyte-associated antigen.
Figure 4.
Figure 4.
Single-cell mRNA sequencing confirm heterogeneity at the transcriptional level. (A) Heat maps showing the single-cell mRNA expression of malignant cells from 6 patients with SS. (B) Single-cell mRNA coexpression of CCR7, CXCR4, IL7R, LGALS1, PSMB4, PTPRC, S100A10, S100A4, and SELL within the malignant population of 6 patients with SS visualized by t-SNE plots. Color indicate the log2 transformed number of unique molecular identifier (UMI) counts for each gene from the individual cells.
Figure 5.
Figure 5.
HDAC inhibitor treatment affect some malignant subpopulations, but not all. (A) Coexpression of surface marker expression within malignant cells from a patient with SS (SS8) visualized by t-SNE plots colored by fluorescence intensity of the indicated markers or by automated clustering using the PhenoGraph algorithm showing all (left) or a reduced number of clusters (right). (B-G) Changes in the malignant subpopulations after treatment with increasing concentrations of 2 HDAC inhibitors. (B-D) Romidepsin or (E-G) SAHA colored by reduced PhenoGraph clusters. (B,E) Visualized by changes in t-SNE plots of clustered cells. (C-D,F-G) Visualized by stacked bar plots of (C,F) cluster frequency or (D,G) total cell counts. (H) Single-cell heat maps of malignant T cells treated with increasing concentrations of romidepsin. Rows are distributed by reduced PhenoGraph clusters (left) and colored by fluorescence intensity of the indicated markers. Violin plots (top) display the overall expression range of the indicated markers within the total malignant population. (I) Normalized quantification of the population diversity within the malignant population of 6 patients with SS after treatment with increasing concentrations of romidepsin or SAHA, based on distribution among PhenoGraph clusters, using different diversity indices (Shannon, Simpson, and inverse Simpson indices and Fisher’s α diversity). Diversity indices were normalized to the diversity of the untreated sample from each patient. Bars depict mean percentage ± standard error of mean of 6 patients with SS (n = 6). Note that cells from SS5 were treated with slightly different concentrations (see “Methods”).

References

    1. Krejsgaard T, Lindahl LM, Mongan NP, et al. . Malignant inflammation in cutaneous T-cell lymphoma-a hostile takeover. Semin Immunopathol. 2017;39(3):269-282. - PMC - PubMed
    1. Agar NS, Wedgeworth E, Crichton S, et al. . Survival outcomes and prognostic factors in mycosis fungoides/Sézary syndrome: validation of the revised International Society for Cutaneous Lymphomas/European Organisation for Research and Treatment of Cancer staging proposal. J Clin Oncol. 2010;28(31):4730-4739. - PubMed
    1. Duvic M, Talpur R, Ni X, et al. . Phase 2 trial of oral vorinostat (suberoylanilide hydroxamic acid, SAHA) for refractory cutaneous T-cell lymphoma (CTCL). Blood. 2007;109(1):31-39. - PMC - PubMed
    1. Piekarz RL, Frye R, Turner M, et al. . Phase II multi-institutional trial of the histone deacetylase inhibitor romidepsin as monotherapy for patients with cutaneous T-cell lymphoma. J Clin Oncol. 2009;27(32):5410-5417. - PMC - PubMed
    1. Wilcox RA. Cutaneous T-cell lymphoma: 2016 update on diagnosis, risk-stratification, and management. Am J Hematol. 2016;91(1):151-165. - PMC - PubMed

Publication types