. 2018 Aug 23;8(1):12658.
doi: 10.1038/s41598-018-30107-3.

Tumour cell invasiveness and response to chemotherapeutics in adipocyte invested 3D engineered anisotropic collagen scaffolds

Affiliations

Tumour cell invasiveness and response to chemotherapeutics in adipocyte invested 3D engineered anisotropic collagen scaffolds

Robert D Hume et al. Sci Rep. .

Abstract

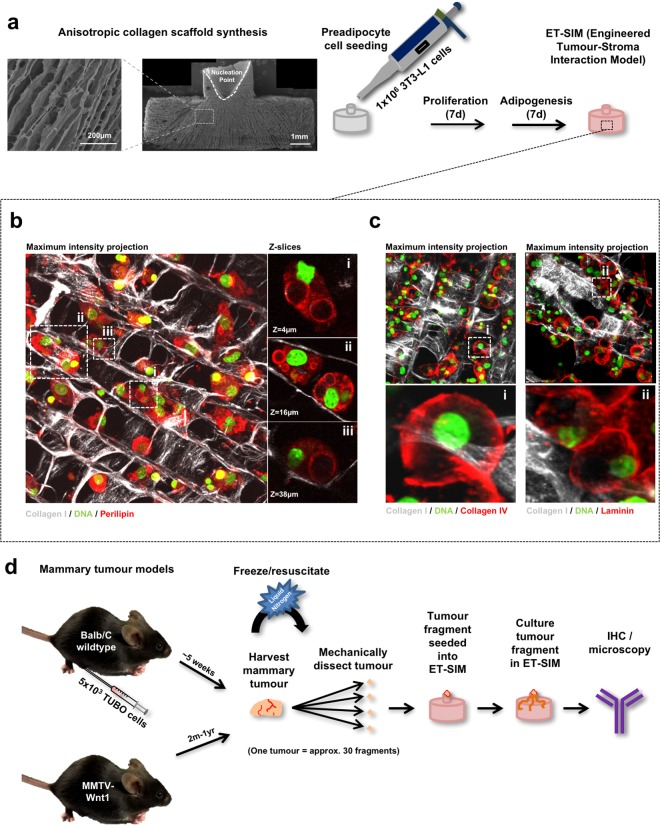
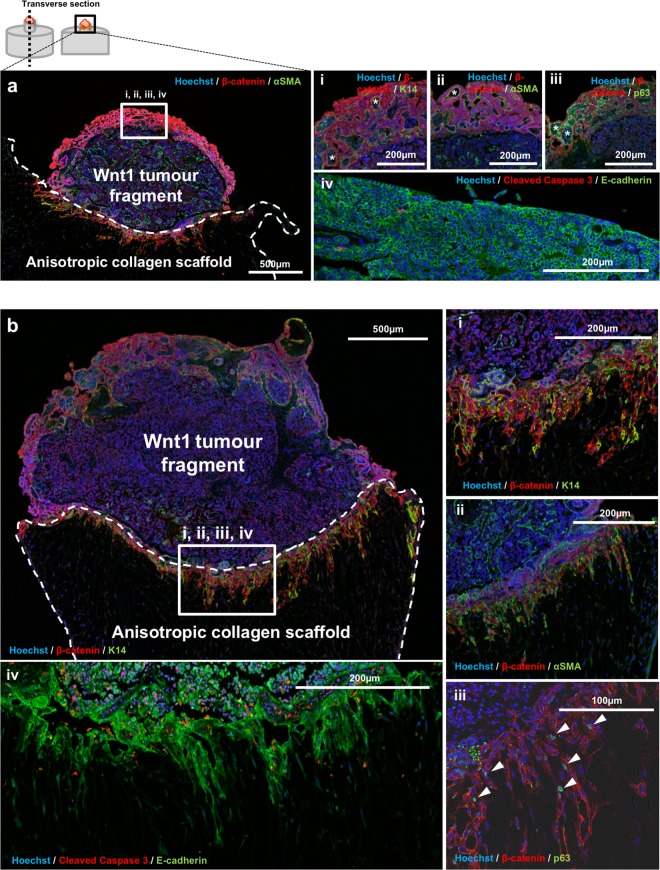
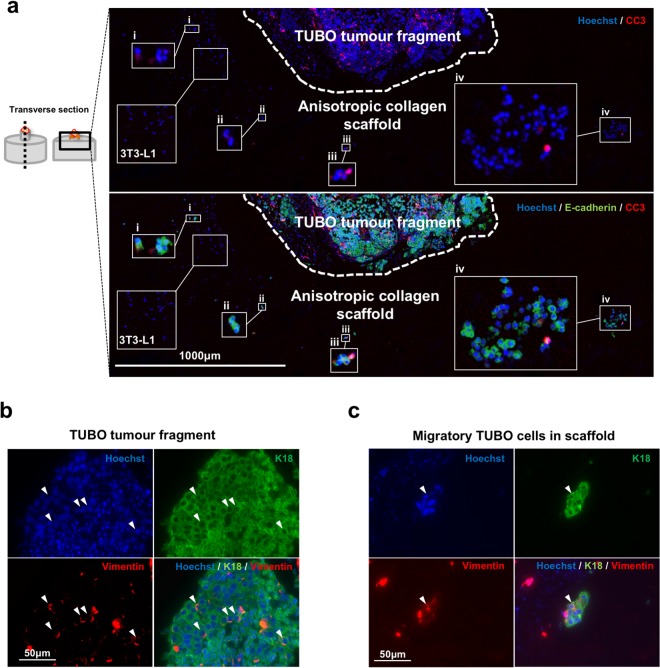
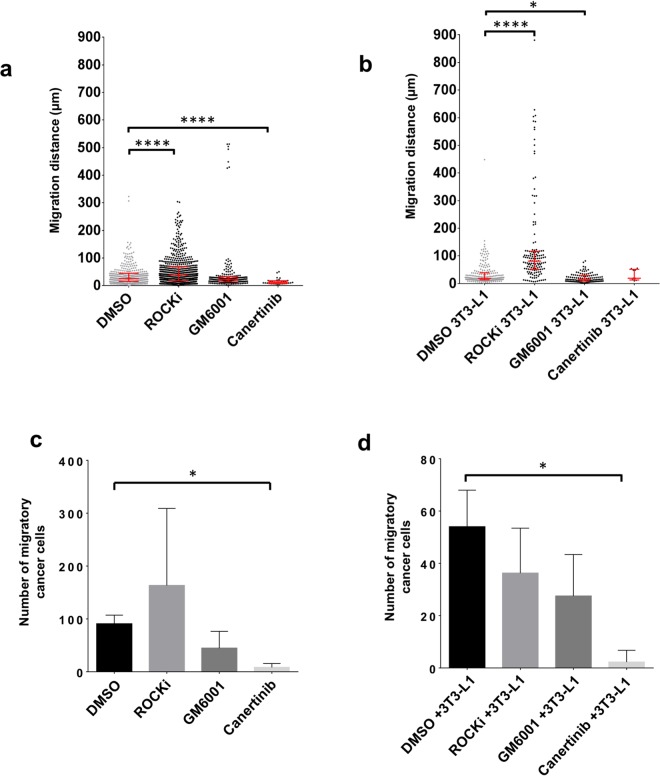
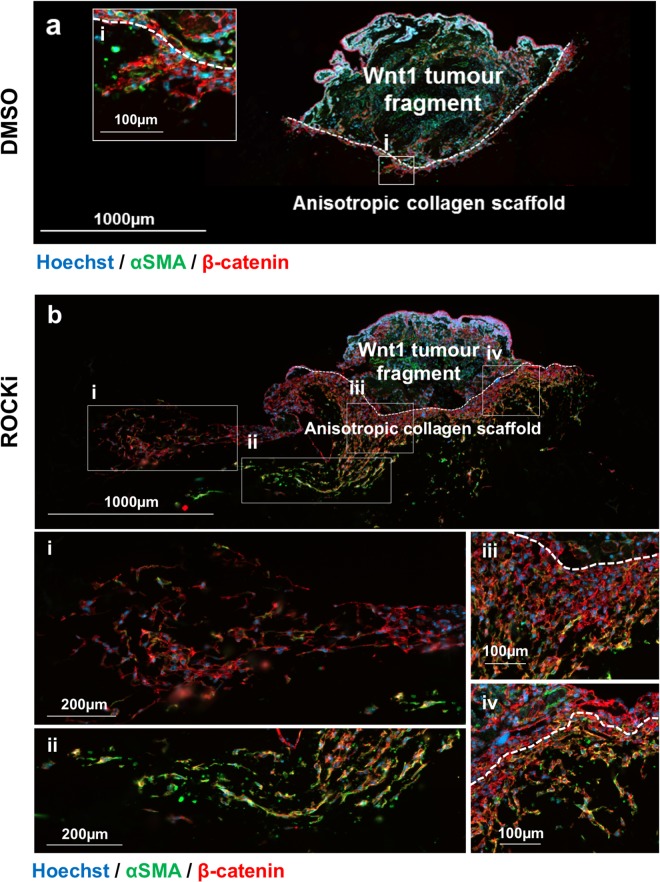
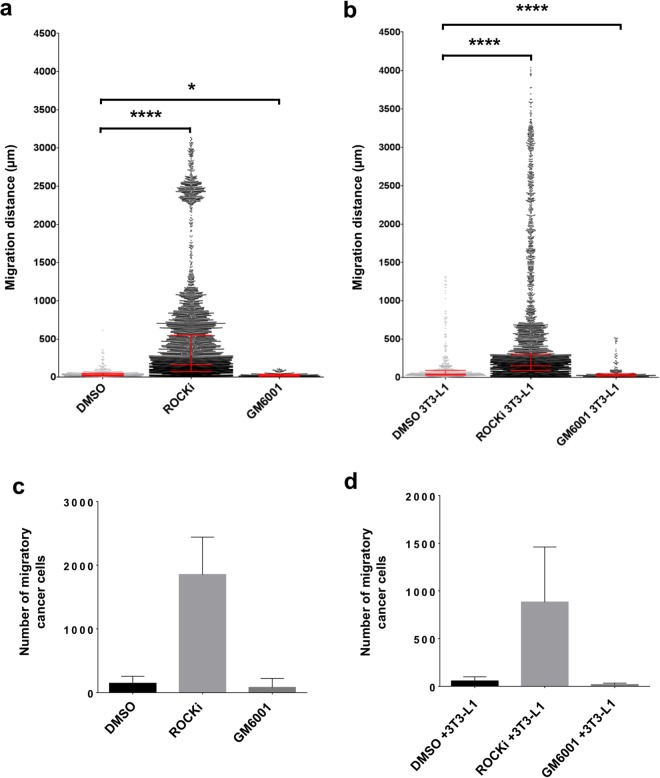
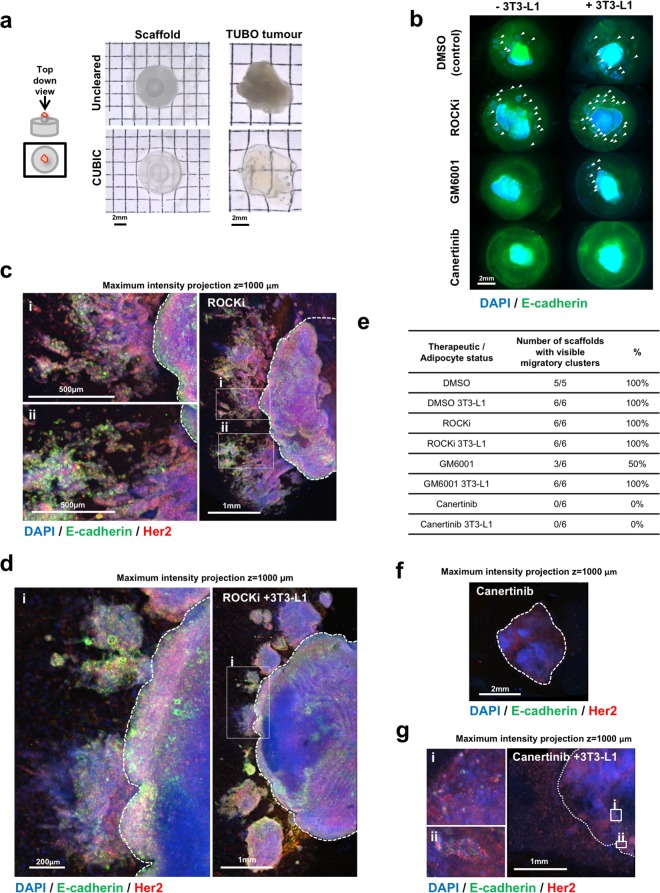
Breast cancers are highly heterogeneous and their metastatic potential and response to therapeutic drugs is difficult to predict. A tool that could accurately gauge tumour invasiveness and drug response would provide a valuable addition to the oncologist's arsenal. We have developed a 3-dimensional (3D) culture model that recapitulates the stromal environment of breast cancers by generating anisotropic (directional) collagen scaffolds seeded with adipocytes and culturing tumour fragments therein. Analysis of tumour cell invasion in the presence of various therapeutic drugs, by immunofluorescence microscopy coupled with an optical clearing technique, demonstrated the utility of this approach in determining both the rate and capacity of tumour cells to migrate through the stroma while shedding light also on the mode of migration. Furthermore, the response of different murine mammary tumour types to chemotherapeutic drugs could be readily quantified.


Conflict of interest statement

The authors declare no competing interests.

Figures

Figure 1
Figure 1
ET-SIM (Engineered Tumour-Stroma Interaction Model) and tumour fragment culture strategy. (a) Scanning electron micrograph (SEM) of anisotropic collagen scaffold (scaffold nucleation point marked with a white dotted line) with directional collagen pores and schematic of ET-SIM (Engineered Tumour-Stroma Interaction Model) culture. (b) Whole mount immunostained ET-SIM culture imaged using second harmonic generation (SHG, collagen I, grey) and two photon fluorescence (2pf) microscopy z-stacks. Nuclei are stained with green fluorescent dye SYTO16 (green). Lipids are stained with anti-perilipin (red). Z-stacks are displayed as maximum intensity projections (left) and individual magnified z-sections (i-iii, right). (c) Whole mount immunostained ET-SIM culture imaged using SHG and 2pf microscopy z-stacks. Nuclei are stained with green fluorescent dye SYTO16 (green). Basement membrane proteins are stained with anti-collagen IV (red, left) and anti-laminin (red, right). Z-stacks are displayed as maximum intensity projections. Magnified maximum intensity projections shown in (i) and (ii). (d) Schematic of tumour fragment and ET-SIM co-culture.
Figure 2
Figure 2
Wnt1 driven tumour fragment co-culture and tumour cell analysis. (a) Immunohistochemistry (IHC) of Wnt1 tumour fragment (top), seeded into the nucleation point (white dotted line) of anisotropic collagen scaffolds/ET-SIM (bottom), cultured for 72 hours, embedded in paraffin and transversely sectioned (diagram, top left). A tile scan of the area containing the tumour fragment and the top of the scaffold is shown in (a). Magnified images of the free edge of the tumour fragment (a, white box) is shown in (i-iv). DNA is marked using Hoechst (blue). Luminal tumour cells are marked with anti-β-catenin (red, i-iii) and E-cadherin (green, iv). Lumen marked as*. Basal tumour cells are marked with anti-cytokeratin-14+ (K14, green, i), anti-α-smooth muscle actin+ (αSMA, green, ii) and anti-p63 (nuclear, green, iii). Apoptotic cells are marked with anti-cleaved caspase-3 (CC3, red, iv). (b) Using the same markers as in (a), the edge of the tumour in contact with an anisotropic collagen scaffold (b, white box) and (i-iv), shows collective migration of K14+/αSMA+/p63+ basal and β-catenin+/E-cadherin+ luminal cells. Arrowheads in (iv) show p63+ nuclei.
Figure 3
Figure 3
TUBO tumour fragment co-culture and tumour cell analysis in ET-SIM. (a) Immunohistochemistry (IHC) of TUBO (Her2-neu overexpressing) tumour fragments (top), seeded into the nucleation point (white dotted line) of anisotropic collagen scaffolds (bottom) with 3T3-L1 adipocytes (insert labelled 3T3-L1), cultured for 72 hours, embedded in paraffin and transversely sectioned (diagram, left). The area shown is a tile scan of the tumour fragment and the top of the scaffold (diagram, left). DNA is marked using Hoechst (blue). TUBO tumour cells are marked with anti-E-cadherin (green). Apoptotic cells are marked with anti-cleaved caspase-3 (CC3, red). Magnified images of migratory TUBO cells are shown in inserts (i-iv). (b) IHC of TUBO cells within the bulk of the seeded tumour fragment. TUBO cells are marker with anti-cytokeratin-18 (K18, green) and epithelial-to-mesenchymal (EMT) transition marker anti-vimentin (red). Stochastic expression of vimentin is localised around one edge of TUBO cell nuclei (arrowheads). (c) IHC of migratory TUBO tumour cells within the anisotropic collagen scaffold with similar stochastic vimentin expression in K18+ TUBO cells (arrowhead).
Figure 4
Figure 4
Analysis of tumour cell migration and response to pathway inhibitors (72 hours). Comparison of Wnt1 tumour cell migratory distance, from the anisotropic collagen scaffold nucleation point to within the scaffold, after 72 hours culture in the absence (a) or presence (b) of differentiated 3T3-L1 cells (known as ET-SIM), with/without pathway inhibitors ROCKi, GM6001 and Canertinib, all statistically compared to DMSO (vehicle control). The total number of migratory Wnt1 tumour cells within the scaffolds, in the absence (c) or presence (d) of differentiated 3T3-L1 cells (known as ET-SIM), with/without the pathway inhibitors ROCKi, GM6001 and Canertinib compared to DMSO (vehicle control). The following statistical analyses were applied: non-parametric unpaired/matching Kruskal-Wallis ANOVA with a Geisser-greenhouse correction combined with a Dunn’s multiple comparison test, *p < 0.05, ****p < 0.0001. Sample size n = 4.
Figure 5
Figure 5
Wnt1 tumour cells treated with ROCKi exhibit increased migration. Immunohistochemistry analysis of Wnt1 tumour fragment seeded into an empty anisotropic collagen scaffold nucleation point (white dotted line), cultured for 10 days then embedded in paraffin and transversely sectioned. Migratory cancer cells are marked with αSMA (green) and β-catenin (red) and DNA is marked with Hoechst. Panel (a) is in the presence of DMSO (vehicle control) for 10 days and (i) shows migratory cells at <500 µm near the nucleation point. Panel (b) is in the presence of ROCKi (Y-27632) for 10 days. (i) and (ii) show migratory cells at distances at >500 µm. (iii) and (iv) show migratory cells at <500 µm near the nucleation point.
Figure 6
Figure 6
Analysis of tumour cell migration and response to pathway inhibitors (10 days). Comparison of Wnt1 tumour cell migratory distance, from the anisotropic collagen scaffold nucleation point to within the scaffold, after 72 hours culture in the absence (a) or presence (b) of differentiated 3T3-L1 cells (known as ET-SIM), with/without pathway inhibitors ROCKi, GM6001 and Canertinib, all statistically compared to DMSO (vehicle control). The total number of migratory Wnt1 tumour cells within the scaffolds, in the absence (c) or presence (d) of differentiated 3T3-L1 cells (known as ET-SIM), with/without the pathway inhibitors ROCKi, GM6001 and Canertinib compared to DMSO (vehicle control). The following statistical analyses were applied: non-parametric unpaired/matching Kruskal-Wallis ANOVA with a Geisser-greenhouse correction combined with a Dunn’s multiple comparison test, *p < 0.05, ****p < 0.0001. Sample size n = 4.
Figure 7
Figure 7
Optical clearing of TUBO tumours in anisotropic collagen scaffolds and cancer therapeutic testing. (a) Transmission stereoscopic images of uncleared and optically cleared (CUBIC) anisotropic collagen scaffold and TUBO (Her2-neu overexpressing) tumour from a top down view. (b) Fluorescent stereoscopic images of TUBO tumour fragments in scaffolds, cultured for 10 days with/without adipocytes (3T3-L1), treated with DMSO (control), ROCKi (Y-27632), GM6001 or Canertinib, CUBIC cleared and immunostained for E-cadherin (green) and Her2 (not shown). Cell nuclei are stained with DAPI (blue). Clusters of cancer cells that have migrated away from the central tumour fragment are marked with arrowheads. (c,d) Large tile scan z-stack (1 mm depth) confocal microscopy images of ROCKi treated TUBO tumour fragments in anisotropic collagen scaffolds without/with adipocytes (3T3-L1), cleared and stained as described in (b) with DAPI (blue), E-cadherin (green) and Her2 (red). (i) and (ii) show magnified images of migratory clusters of Her2 and E-cadherin positive cells. (e) Quantification of the number of tumour/scaffolds that contain one or more visible migratory cell clusters. (f,g) Large tile scan z-stack (1 mm depth) confocal microscopy images of Canertinib treated TUBO tumour fragments in anisotropic collagen scaffolds without/with adipocytes (3T3-L1), cleared and stained as described in (b) with DAPI (blue), E-cadherin (green) and Her2 (red). (i) and (ii) show few non-migratory E-cadherin and Her2 cells seen in the seeded tumour fragment. No migratory cells were observed in the scaffold with Canertinib treatment at this magnification.

References

    1. Boyden S. The chemotactic effect of mixtures of antibody and antigen on polymorphonuclear leucocytes. J. Exp. Med. 1962;115:453–66. doi: 10.1084/jem.115.3.453. - DOI - PMC - PubMed
    1. de Both NJ, Vermey M, Dinjens WN, Bosman FT. A comparative evaluation of various invasion assays testing colon carcinoma cell lines. Br. J. Cancer. 1999;81:934–41. doi: 10.1038/sj.bjc.6690790. - DOI - PMC - PubMed
    1. Todaro GJ, Lazar GK, Green H. The initiation of cell division in a contact-inhibited mammalian cell line. J. Cell. Comp. Physiol. 1965;66:325–333. doi: 10.1002/jcp.1030660310. - DOI - PubMed
    1. Poujade M, et al. Collective migration of an epithelial monolayer in response to a model wound. Proc. Natl. Acad. Sci. USA. 2007;104:15988–15993. doi: 10.1073/pnas.0705062104. - DOI - PMC - PubMed
    1. Bissell MJ, Radisky DC, Rizki A, Weaver VM, Petersen OW. The organizing principle: microenvironmental influences in the normal and malignant breast. Differentiation. 2002;70:537–46. doi: 10.1046/j.1432-0436.2002.700907.x. - DOI - PMC - PubMed

Publication types

LinkOut - more resources