. 2018 Aug 24;7(8):65.
doi: 10.1038/s41389-018-0073-3.

ΔNp63 regulates the expression of hyaluronic acid-related genes in breast cancer cells

Affiliations

ΔNp63 regulates the expression of hyaluronic acid-related genes in breast cancer cells

Veronica Gatti et al. Oncogenesis. .

Abstract

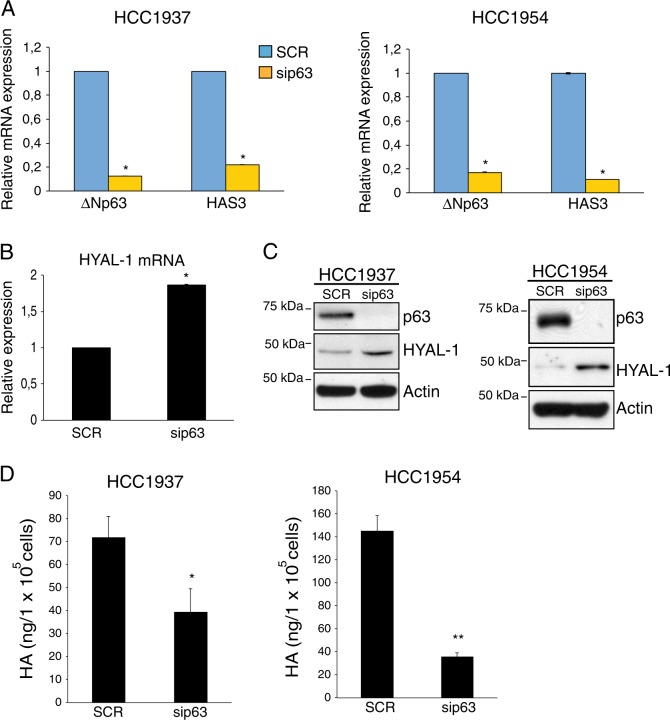
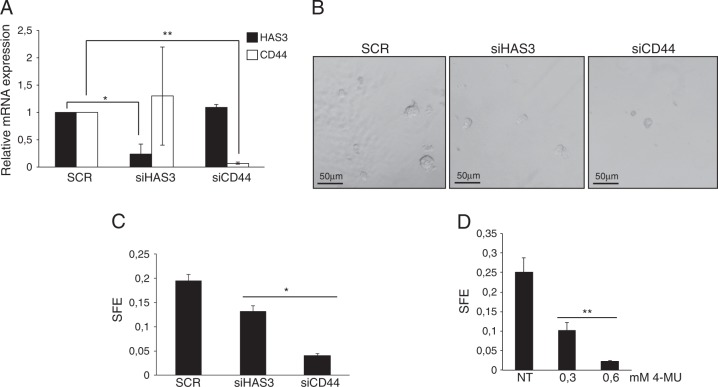
Triple negative breast cancers (TNBC) represent the most aggressive and clinically relevant breast carcinomas. On the basis of specific molecular signature, the majority of TNBC can be classified as basal-like breast carcinoma. Here, we report data showing that in basal-like breast carcinoma cells ΔNp63 is capable of sustaining the production of the hyaluronic acid (HA), one of the major component of the extracellular matrix (ECM). At molecular level, we found that ΔNp63 regulates the expression of HA-related genes, such as the HA synthase HAS3, the hyaluronidase HYAL-1 and CD44, the major HA cell membrane receptor. By controlling this pathway, ∆Np63 contributes to maintain the self-renewal of breast cancer stem cells. Importantly, high HAS3 expression is a negative prognostic factor of TNBC patients. Our data suggest that in basal-type breast carcinoma ∆Np63 might favor a HA-rich microenviroment, which can sustain tumor proliferation and stemness.


Conflict of interest statement

The authors declare that they have no conflict of interest.

Figures

Fig. 1
Fig. 1. p63 sustains the HA metabolism by controlling the expression of the HA-related genes HAS3 and HYAL-1.
a HCC1954 and HCC1937 breast carcinoma cell lines were grown in RPMI-1640 medium (Gibco, Invitrogen); H1299 cells (non-smal cell lung cancer cell line) were cultured in Dulbecco’s modified Eagle’s medium (Gibco, Invitrogen) supplemented with 10% v/v fetal bovine serum (FBS), 100 µg/mL penicillin and 100 µg/mL streptomycin (Gibco, Invitrogen). Cells were cultured at 37 °C with 5% CO2. Breast carcinoma cell lines were purchased from ATCC and routinely tested for mycoplasma contaminations. HAS3 and ΔNp63 mRNA levels were quantified by Real-Time PCR analysis (qRT-PCR) in the indicated basal-type breast tumor cell lines transfected with scrambled (SCR) or p63 siRNA (sip63) oligos. For siRNA oligos transfection cells were seeded at a density of 1.4 × 105 cells/well in a six-well plate and transfected with oligos using RNAimax (Invitrogen) according to manufacturer’s instructions. Smart pool siRNA oligos direct against p63, HAS3 mRNA, and non-relevant gene (scramble) were purchased by Dharmacon (Thermo Scientific). Cells were collected 48 h after transfection and lysates were subjected to qRT-PCR analysis. Total mRNA was isolated using the RNeasy mini kit (Qiagen, Duesseldorf, Gemrany) following the manufacturer’s recommendations. Total RNA was quantified using a NanoDrop Spectophotometer (Thermo Scientific, Delaware, USA) and used for cDNA synthesis using Superscript Reverse Transcriptase (Promega, Fithburg, WI, USA), according to the manufacturer’s protocol. cDNA was subsequently used for qRT-PCR. Each 25 µl reaction contained 2X SYBR-Green PCR Master Mix (Promega), 2 µl cDNA and the appropriate specific primers (0.5 µM). Amplification and fluorescence detection according to the manufacturer’s instructions was performed using the ABI PRISM 7700 Sequence Detection System (Applied Biosystems, France). The expression of each gene was defined from threshold cycle (Ct), and the relative expression levels were calculated using the 2-ΔΔCt method. The primers used for qRT-PCR are the following: human ΔNp63 for 5′-GAAGAAAGGACAGCAGCATTG-3′; rev 5′-GGGACTGGTGGACGAGGAG-3′; human HAS3 for 5′-TGTGCATTGCCGCATACC-3′; rev 5′-CCGAGCGCAGGCACTT-3′; human GAPDH for 5′-AGCCACATCGCTCAGACA-3′; rev 5′-GCCCAATACGACCAAATC-3′; human Actin for 5′-GTTGCTATCCAGGCTGTG-3′; rev 5′-AATGTCACGCACGATTTCCCG-3′; Bars represent the mean of three technical replicates (n = 3, PCR runs) ± SD and are representative of three independent experiments (n = 3 biological replicates). No data were excluded form the analysis. *p- value < 0.05. b HYAL-1 mRNA levels were measured by qRT-PCR in HCC1937 cells transfected as in a. The following oligos were utilized for HYAL-1 mRNA expression analysis: human HYAL-1 for 5′-CGATATGGCCCAAGGTTTAG-3′; rev 5′-ACCACATCGAAGACACTGACAT-3′. Bars represent the mean of three technical replicates (n = 3, PCR runs) ± SD and are representative of two independent experiments (n = 2 biological replicates). No data were excluded form the analysis. *p- value < 0.05. c Total protein lysates extracted by the HCC1937 and HCC1954 cells transfected as in a were analyzed by immunoblotting (IB) using antibodies to the indicated proteins. IB was performed as previously described. The following antibodies were utilized: rabbit monoclonal anti p63-α D2K8X (Cell Signaling Technology); mouse monoclonal anti β-actin (AC-15) (Sigma-Aldrich) and rabbit polyclonal anti HYAL-1 (Sigma-Aldrich). d HCC1937 and HCC1954 cells (2 × 105 cells/well) were transfected with scrambled (SCR) or p63 siRNA (sip63) oligos. Forty-eight hours after transfection growth medium of transfected cells was collected and extracellular hyaluronic acid (HA) levels were measured using Hyaluronan Enzyme-Linked Immunosorbent Assay Kit (HA-ELISA) (Echelon) following the manufacturer’s recommendations. The amount of hyaluronic acid (ng) was normalized per the number of cells (105 cells). Bars represent the mean of four replicates (n = 3) ± SD. *p-value < 0.05; **p-value < 0.01. Statistical evaluation was determined by using a two-tailed t-test.
Fig. 2
Fig. 2. p63-dependent regulation of HA/CD44 pathway favors EGF-R activation
a The indicated basal-type breast tumor cells transfected with scrambled (SCR) or p63 siRNA oligos (sip63) were analyzed for the expression of CD44 by qRT-PCR. We utilized the following CD44 oligos. CD44 total: forward 5′-CAACTCCATCTGTGCAGCAAA-3′; rev 5′-GTAACCTCCTGAAGTGCTGCTC-3′. CD44v6 forward 5′-AGTACAACGGAAGAAACAGCTA-3′; rev 5′-TGTCCCTGTTGTCGAATGG-3′. Bars represent the mean of four independent experiments (n = 4 biological replicates) ± SD. No data were excluded from the analysis. *p-value < 0.05. b The indicated basal-type breast tumor cells treated as in a were analyzed by immunoblotting using the antibodies for the indicated proteins. Mouse monoclonal antibody anti-CD44 (8E2) (Cell Signaling Technology) or mouse monoclonal anti-HCAM (CD44) (DF1485) (Santa Cruz Biotechnology) were utilized. c HCC1937 and HCC1954 cells were transfected as in a and total protein lysates were immunoblotted utilizing antibodies for the indicated proteins. Rabbit polyclonal anti-EGF Receptor (Cell Signaling Technology) and rabbit monoclonal anti-Phospho-EGF Receptor (Tyr1068) (D7A5) (Cell Signaling Technology) were utilized; d HCC1954 cells were transfected with scrambled (SCR), or p63 siRNA (sip63) oligos for 48 h and then transfected cells were plated for the sphere-forming assay. Briefly, breast cancer cells were plated in low-attachment 24-well culture plates at a density of 1000 cells per milliliter, in DMEM supplemented with 5 μg/mL insulin, 0.5 μg/mL hydrocortisone, 2% (vol/vol) B27 (Invitrogen), 20 ng/mL EGF and bFGF (BD Bio-sciences), and 4 μg/mL heparin (Sigma). The medium was made semisolid by the addition of 1% (vol/vol) methylcellulose to prevent cell aggregation. Total protein lysates were immunoblotted, utilizing antibodies for the indicated proteins. Rabbit polyclonal anti-Phospho-p44/42 MAPK (Erk1/2) (Thr202/Tyr204) (Cell Signaling Technology) and rabbit monoclonal p44/42 MAPK (Erk1/2) (Cell Signaling Technology, clone 137F5) were utilized. e Representative image of clonogenic assay (left panel) performed by treating HCC1954 cells (500 cell per well) with the indicated concentration of 4-methylumbelliferone (4-MU, Sigma-Aldrich) for 1 week. Growth curve (middle panel) was performed by treating 1 × 105 cells with the indicated concentration of 4-MU for the indicated days. Cells were counted at the indicated time points in quadruplicates (n = 4 technical replicates). The mean ± SD at days 2 and 5 was calculated and plotted. The graph is representative of two independent experiments. *p-value < 0.05. In parallel, protein lysates were immunoblotted for the indicated proteins (right panel)
Fig. 3
Fig. 3. HA/CD44 pathway regulates breast tumor stemness.
a HCC1954 cells were transfected with scrambled (SCR), HAS3 (siHAS3), or CD44 siRNA (siCD44) oligos for 48 h and then the efficiency of HAS3 or CD44 silencing has been measured by qRT-PCR. siRNA oligos against CD44 mRNA was purchased by Qiagen (Flexitube siRNA SI03098123). Bars represent the mean of three independent experiments (n = 3, biological replicates) ± SD. No data were excluded from the analysis. *p-value < 0.05. **p-value < 0.01. b Representative images of the mammospheres derived from HCC1954 cells transfected as in a. c HCC1954 cells transfected as in a were plated for the sphere-forming assay. The sphere-forming efficiency (SFE) was calculated as the percentage of the number of spheres per plated cells. Values represent the mean of the number of spheres counted in 12 (n = 12) different fields. The values are representative of three independent experiments (n = 3 biological replicates). *p-value < 0.05. d HCC1954 cells were plated for the sphere-forming assay in the presence of the indicated concentration of 4-MU. SFE was calculated as in c. Values represent the mean of the number of spheres counted in 10 (n = 10) different fields. The values are representative of three independent experiments (n = 3 biological replicates). **p-value < 0.01.
Fig. 4
Fig. 4. HAS3 expression is a negative prognostic factor of TNBC patient survival.
Analysis of TP63 and HAS3 co-expression in breast tumors (TCGA-BRCA, 1033 patients) (a) and in triple-negative breast tumors (TCGA-BRCA, 134 patients) datasets (b). Pearson’s correlation coefficient (PCC) was calculated for primary tumors using the matlab routine corr. c Basal-type breast tumor samples from a cohort of 360 patients were clustered into two groups displaying low and high HAS3 expression. The lower and upper quartiles were selected by using the best performing threshold as cutoff. Relapse-free survival (RFS) has been calculated (p-value: 0.0068). d Schematic model of the ΔNp63-mediated regulation of the HA metabolism and signaling

References

    1. Cancer Genome Atlas N. Comprehensive molecular portraits of human breast tumours. Nature. 2012;490:61–70. doi: 10.1038/nature11412. - DOI - PMC - PubMed
    1. Carey L, Winer E, Viale G, Cameron D, Gianni L. Triple-negative breast cancer: disease entity or title of convenience? Nat. Rev. Clin. Oncol. 2010;7:683–692. doi: 10.1038/nrclinonc.2010.154. - DOI - PubMed
    1. Foulkes WD, Smith IE, Reis-Filho JS. Triple-negative breast cancer. New Engl. J. Med. 2010;363:1938–1948. doi: 10.1056/NEJMra1001389. - DOI - PubMed
    1. Al-Ejeh F, et al. Meta-analysis of the global gene expression profile of triple-negative breast cancer identifies genes for the prognostication and treatment of aggressive breast cancer. Oncogenesis. 2014;3:e124. doi: 10.1038/oncsis.2014.41. - DOI - PMC - PubMed
    1. Branham MT, et al. Methylation profile of triple-negative breast carcinomas. Oncogenesis. 2012;1:e17. doi: 10.1038/oncsis.2012.17. - DOI - PMC - PubMed

LinkOut - more resources