. 2018 Aug 23;9(1):3377.
doi: 10.1038/s41467-018-05728-x.

Polycomb complexes associate with enhancers and promote oncogenic transcriptional programs in cancer through multiple mechanisms

Affiliations

Polycomb complexes associate with enhancers and promote oncogenic transcriptional programs in cancer through multiple mechanisms

Ho Lam Chan et al. Nat Commun. .

Abstract

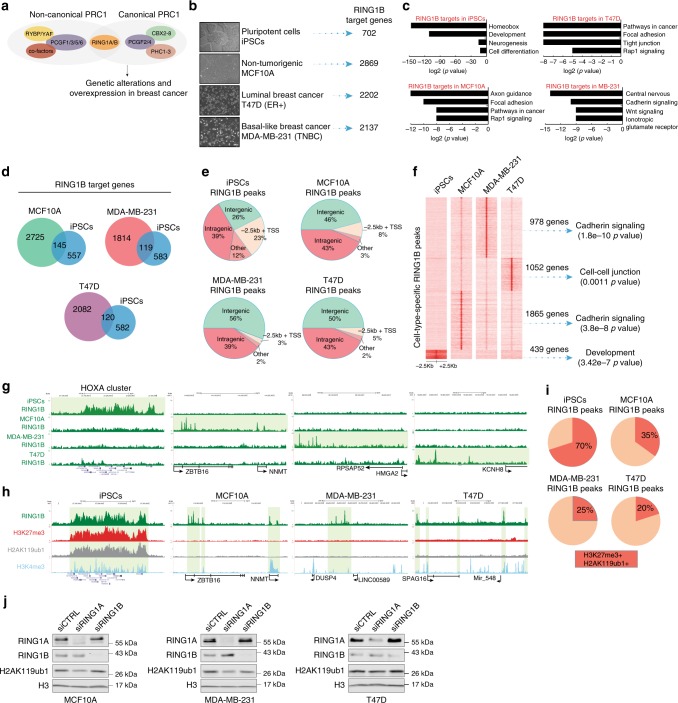
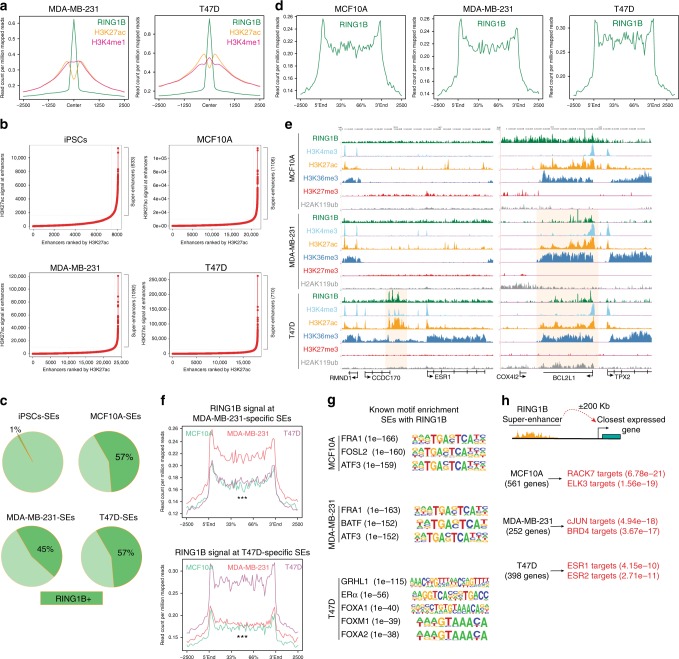
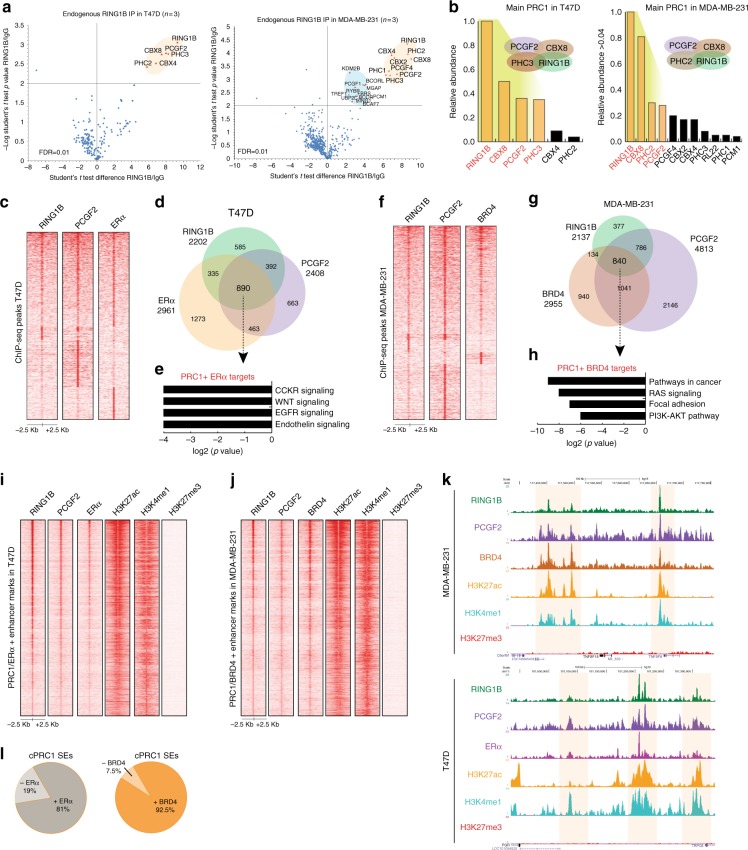
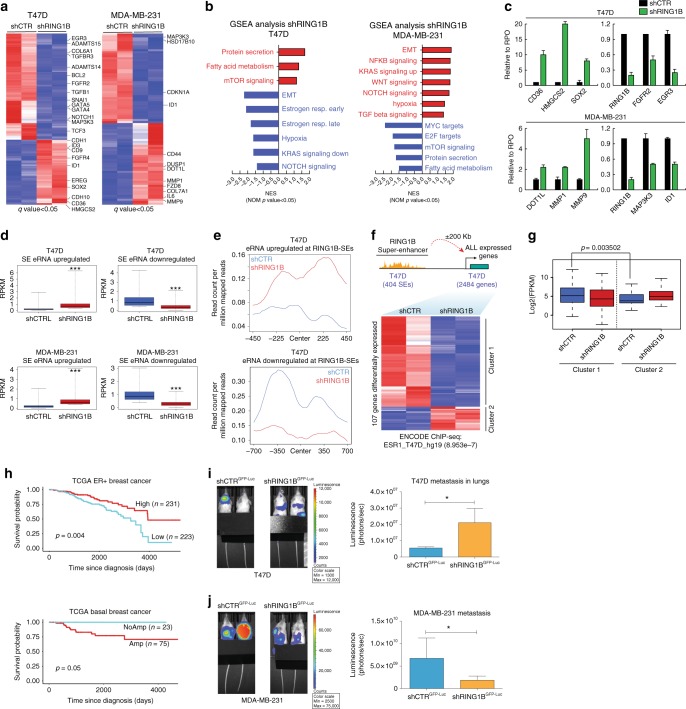
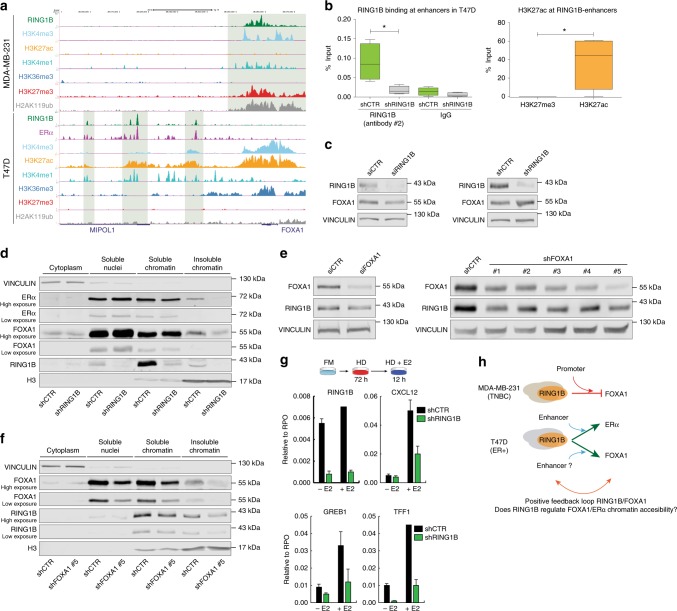
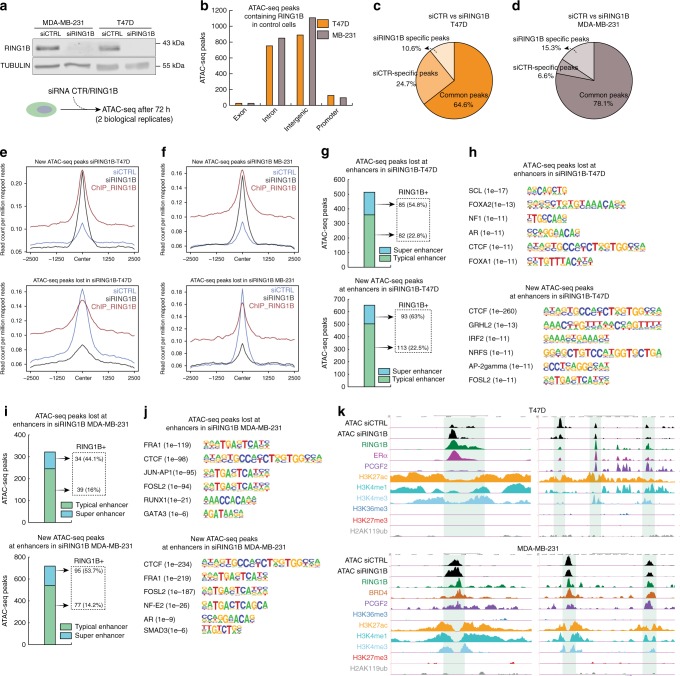
Polycomb repressive complex 1 (PRC1) plays essential roles in cell fate decisions and development. However, its role in cancer is less well understood. Here, we show that RNF2, encoding RING1B, and canonical PRC1 (cPRC1) genes are overexpressed in breast cancer. We find that cPRC1 complexes functionally associate with ERα and its pioneer factor FOXA1 in ER+ breast cancer cells, and with BRD4 in triple-negative breast cancer cells (TNBC). While cPRC1 still exerts its repressive function, it is also recruited to oncogenic active enhancers. RING1B regulates enhancer activity and gene transcription not only by promoting the expression of oncogenes but also by regulating chromatin accessibility. Functionally, RING1B plays a divergent role in ER+ and TNBC metastasis. Finally, we show that concomitant recruitment of RING1B to active enhancers occurs across multiple cancers, highlighting an under-explored function of cPRC1 in regulating oncogenic transcriptional programs in cancer.


Conflict of interest statement

The authors declare no competing interests.

Figures

Fig. 1
Fig. 1
Genome-wide occupancy and activity of RING1B in breast cancer cells. a Model depicting RING1B and cPRC1 subunits that are genetically amplified and overexpressed in breast cancer. b Number of RING1B target genes. Representative phase-contrast images of each cell line are shown at ×10 magnification. Scale bar represents 100 µm. c GO analysis of RING1B target genes. d Venn diagrams of overlapping RING1B target genes. e Distribution of RING1B ChIP-seq peaks. f ChIP-seq heat maps of specific RING1B peaks in each of the cell lines. GO analysis performed on target genes identified in each peak cluster. g Genome browser screenshots of unique RING1B-binding sites in each of the cell lines. RING1B peaks are highlighted in green. h Pie chart showing percentage of RING1B peaks overlapping with H2AK119ub1 and H3K27me3. i Genome browser screenshots of RING1B, H3K27me3, H2AK119ub1, and H3K4me3 in each of the cell lines. RING1B peaks are highlighted in green. j Representative western blots of RING1A, RING1B, and H2AK119ub1 of control and RING1B-depleted cells. Histone H3 was used as a loading control (n = 3)
Fig. 2
Fig. 2
RING1B is recruited to super-enhancers. a H3K27ac and H3K4me1 ChIP-seq signals relative to RING1B peak summit. b Super-enhancers (SEs) identified in each cell line. c Pie charts showing percentage of SEs containing RING1B. d RING1B ChIP-seq signal at SEs. e Genome browser screenshots of RING1B and histone modifications. SE regions near ESR1 and BCL2L1 are highlighted in yellow. f RING1B ChIP-seq signal at T47D-specific SEs (top) or MDA-MB-231–specific SEs (bottom). RING1B ChIP-seq signal in RING1B-T47D SEs compared to RING1B ChIP-seq signal in the same genomic region in MDA-MB-231 (p-value = 3.07e − 24) and MCF10A (p-value = 2.39e − 29). RING1B ChIP-seq signal in RING1B-MDA-MB-231 SEs compared to RING1B ChIP-seq signal in the same genomic region in T47D (p-value = 1.15e − 16) and MCF10A (p-value = 1.36e − 09). Significance was determined by the Kolmogorov–Smirnov test. ***p-value < 0.001. g Transcription factor motif analysis of SEs containing RING1B. h Enrichr analysis of ENCODE ChIP-seq data using the nearest genes from SEs containing RING1B
Fig. 3
Fig. 3
The RING1B interactome and its genome-wide association with ERα and BRD4 in ER+ and TNBC cells. a Endogenous RING1B immunoprecipitation with whole-cell extracts. Proteins bound to RING1B were identified by LC-MS/MS, and enrichment was calculated based on LFQ intensities. IgG was used as a negative control. Experiments were performed in three biological replicates. b Relative abundance of RING1B interactors. c ChIP-seq heat maps of RING1B, PCGF2, and ERα in T47D. d Overlapping of RING1B, PCGF2, and ERα target genes in T47D. e GO analysis of RING1B/PCGF2/ERα co-target genes. f ChIP-seq heat maps of RING1B, PCGF2, and BRD4 in MDA-MB-231. g Overlapping of RING1B, PCGF2, and BRD4 target genes in MDA-MB-231. h GO analysis of RING1B/PCGF2/BRD4 co-target genes. ij ChIP-seq heat maps of RING1B, PCGF2, ERα, and histone modifications associated with active enhancers and SEs in T47D, and PCGF2, BRD4 in MDA-MB-231. k Genome browser screenshots of SEs. SE regions are highlighted in yellow. l Pie charts of cPRC1-SEs with ERα in T47D and BRD4 in MDA-MB-231
Fig. 4
Fig. 4
RING1B regulates specific oncogenic pathways and metastasis in breast cancer subtypes. a RNA-seq heat maps of upregulated and downregulated genes in RING1B-depleted (shRING1B) T47D and MDA-MB-231 cells. RNA-seq experiments were performed in two biological replicates. b GSEA analyses after RING1B depletion. c Real-time qPCR of selected genes in control and RING1B-depleted T47D and MDA-MB-231. Expression was normalized to the housekeeping gene RPO. Data represent the average of two independent experiments. d Box plots of deregulated eRNAs in SEs after RING1B depletion. e eRNA signal at RING1B-occupied SE regions. f Heatmap of deregulated genes near SEs containing RING1B in shRING1B T47D. g Genes in f that are downregulated (cluster 1) or upregulated (cluster 2) in shRING1B T47D. h Kaplan–Meier survival analysis of patients from TCGA with ER+ tumors (top) or Basal (TNBC) breast cancer tumors segregated by RNF2 expression. ij Representative images of metastatic signal detected by IVIS in NSG mice 65 days after injection of control and shRING1B T47DGFP-luc and MDA-MB-231GFP-luc cells in the mammary fat pad (n = 5/group). Quantification of luciferase signal by IVIS in control and shRING1B T47DGFP-luc and MDA-MB-231GFP-luc cells. Error bars represent SD. *p-value < 0.05; ***p-value < 0.001, two-tailed t-test. Center line of box plots represent the median and upper and lower bounds of whiskers represent the maximum and minimum values, respectively
Fig. 5
Fig. 5
RING1B regulates FOXA1 and ERα through multiple mechanisms. a Genome browser screenshots of the profiles of RING1B and histone modifications in T47D and MDA-MB-231 cells at the FOXA1 locus. b RING1B, H3K27me3 and H3K27ac ChIP-qPCR of RIN1GB-containing enhancers in control and RING1B-depleted T47D cells. IgG antibody was used as a negative control. As additional control, RING1B ChIP-qPCR were performed using a different RING1B antibody from the one used for ChIP-seq. Error bars represent the SD of two independent experiments. *p-value < 0.05, two-tailed t-test. c Western blot of RING1B and FOXA1 from control and RING1B-depleted cells 72 h after siRNA transfection (left panel) or after puromycin selection of shRING1B T47D cells (right panel). VINCULIN was used a loading control. d Western blot of RING1B, FOXA1 and ERα after cellular fractionation of control and RING1B-depleted T47D cells. VINCULIN and histone H3 were used as a cytoplasmic and chromatin fraction controls, respectively. e Western blot of RING1B and FOXA1 from control and FOXA1-depleted cells 72 h after siRNA transfection (left panel) or after puromycin selection of shFOXA1 T47D cells (right panel). VINCULIN was used a loading control. f Western blot of RING1B and FOXA1 after cellular fractionation of control and FOXA1-depleted T47D cells. VINCULIN and histone H3 were used a cytoplasmic fraction and chromatin fraction control, respectively. All the cellular fractionation experiments and total protein extracts shown in the figure were performed at least three times. g RT-qPCR of E2-responsive genes in control and RING1B-depleted T47D after administration of E2 (10 mM) for 12 h in cells cultured in hormone-deprived (HD) media for 72 h. FM full media. Error bars represent SD of two independent experiments. h Model of RING1B action in MDA-MB-231 and T47D cells
Fig. 6
Fig. 6
RING1B regulates chromatin accessibility at enhancers. a Western blot of RING1B from control and RING1B-depleted cells 72 h after siRNA transfection. TUBULIN was used a loading control. ATAC-seq experiments were performed in two biological replicates after siRNAs transfections. b ATAC-seq peak distribution in genomic sites bound by RING1B in RING1B-depleted cells. c, d Pie charts showing percentage of ATAC-seq peaks not affected by RING1B depletion (common peaks), lost after RING1B depletion (siCTR-specific peaks), or gained after RING1B depletion (siRING1B-specific peaks. Two ATAC-seq experiments were performed after two independent siRING1B transfections. e, f RING1B ChIP-seq signals and ATAC-seq signals at acquired and lost ATAC-seq peaks. g ATAC-seq peaks at enhancers after RING1B depletion, number of enhancers containing RING1B ChIP-seq signals in T47D. h Transcription factor-binding motif analysis of peaks acquired or lost at enhancers in T47D. i Acquired and lost ATAC-seq peaks at enhancers after RING1B depletion, number of enhancers containing RING1B ChIP-seq signals in MDA-MB-231. j Transcription factor-binding motif analysis in peaks acquired or lost at enhancers in MDA-MB-231. k Genome browser screenshots of ChIP-seq and ATAC-seq profiles at selected enhancers
Fig. 7
Fig. 7
RING1B is recruited to super-enhancers in other cancer types. a SEs identified in HepG2 and K562 cells. b Percentage of SEs containing RING1B in HepG2 and K562. c Transcription factor-binding motif enrichment of SEs containing RING1B in HepG2 cells. d ChIP-seq heat maps of RING1B and histone modifications associated with active enhancers and SEs. e Genome browser screenshots of co-occupancy of RING1B and bHLHE40 at enhancers in HepG2. f Transcription factor-binding motif enrichment of SEs containing RING1B in K562 cells. g ChIP-seq heat maps of RING1B and histone modifications associated with active typical enhancers and SEs, and GATA1 in K562 cell lines. h Genome browser screenshots of co-occupancy of RING1B and GATA1 at enhancers in K562. i Genome browser screenshots of RING1B and GATA1 or RING1B and bHLHE40 co-occupancy at specific SEs in K562 and HepG2 cells, respectively. j Model: In cancer, cPRC1 complexes have a dual function. cPRC1 is recruited to gene promoters to repress gene expression and to active cancer-specific enhancers in different cancer subtypes to modulate their expression and chromatin accessibility to oncogenic transcription factors

References

    1. Schuettengruber B, Bourbon HM, Di Croce L, Cavalli G. Genome regulation by Polycomb and Trithorax: 70 years and counting. Cell. 2017;171:34–57. doi: 10.1016/j.cell.2017.08.002. - DOI - PubMed
    1. Laugesen A, Helin K. Chromatin repressive complexes in stem cells, development, and cancer. Cell Stem Cell. 2014;14:735–751. doi: 10.1016/j.stem.2014.05.006. - DOI - PubMed
    1. Gao Z, et al. PCGF homologs, CBX proteins, and RYBP define functionally distinct PRC1 family complexes. Mol. Cell. 2012;45:344–356. doi: 10.1016/j.molcel.2012.01.002. - DOI - PMC - PubMed
    1. Morey L, Helin K. Polycomb group protein-mediated repression of transcription. Trends Biochem. Sci. 2010;35:323–332. doi: 10.1016/j.tibs.2010.02.009. - DOI - PubMed
    1. Comet I, Riising EM, Leblanc B, Helin K. Maintaining cell identity: PRC2-mediated regulation of transcription and cancer. Nat. Publ. Group. 2016;16:803–810. - PubMed

Publication types

MeSH terms