

doi: 10.1175/BAMS-D-16-0182.1.
Epub 2017 Oct 30.
THE OLYMPIC MOUNTAINS EXPERIMENT (OLYMPEX)
Affiliations
- PMID: 30140097
- PMCID: PMC6101968
- DOI: 10.1175/BAMS-D-16-0182.1
Item in Clipboard
THE OLYMPIC MOUNTAINS EXPERIMENT (OLYMPEX)
Bull Am Meteorol Soc.
2017 Oct.
Abstract
OLYMPEX is a comprehensive field campaign to study how precipitation in Pacific storms is modified by passage over coastal mountains.
Figures

Map of the region where the OLYMPEX campaign occurred, including the mountainous terrain of the Olympic Peninsula.

The OLYMPEX observational network.

Examples of the OLYMPEX surface observation sites. (a) Beach House site on the coast. (b) Mule train taking instruments to remote higher-elevation sites. (c) Installation of 2DVD (foreground) at the Fisheries site; dual-platform tipping-bucket gauge and Parsivel disdrometer are in the background. (d) University of Washington mobile trailer facility in the Wynoochee drainage. Photo credits: (a) Lynn McMurdie, (b) William Baccus, and (c),(d) Joe Zagrodnik.

Timeline of OLYMPEX operations. Solid arrows indicate periods when various facilities were in operation. Striped arrow shows the period in which the surface sites were reduced in number. Also indicated are the times that the ASO aircraft carried out lidar surveys of the snow cover in the Olympic Mountains (red dashed lines) and that crews were helicoptered into the high terrain to make measurements of snow depth (black dashed lines).

Coordinated DC-8 (yellow), Citation (blue), and ER-2 (red) flights during ~ 1500— 1600 UTC 3 Dec 2015 within the GPM satellite Ku-band radar swath. GPM overpass time 1522 UTC 3 Dec 2015. (a) Horizontal projection of Ku-band reflectivity and locations of ground-based radars. (b) Vertical cross section of GPM Ku-band along the black line in (a), showing flight altitudes, 0°C level, and underlying topography (dark green).

Attenuated backscatter shown by the 532-nm cloud physics lidar (CPL) aboard the ER-2 on 3 Dec 2015. Time is in UTC and height in km. Since the scattering cross section of cloud-top ice crystals is approximately twice their physical cross section, the CPL is very sensitive to the precise location of cloud top. The strength of the signal tends to penetrate approximately 3–3.5 optical depths, providing an approximate indication of the density of hydrometeors in the cloud-top region.
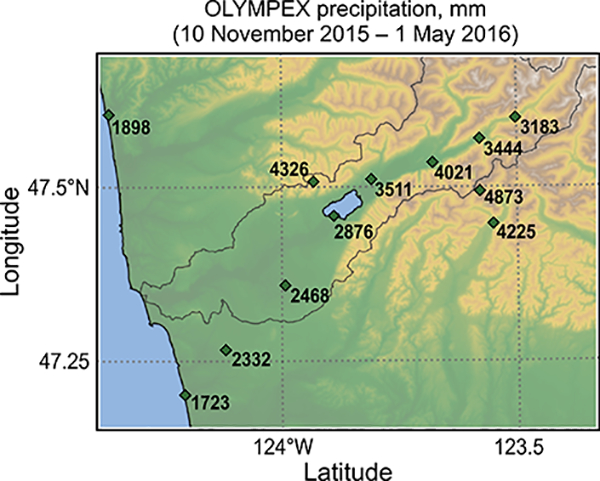
Total accumulated liquid water equivalent precipitation at OLYMPEX ground sites from 10 Nov 2015 through 1 May 2016. The elevation scale is as in Figs. 1 and 2.
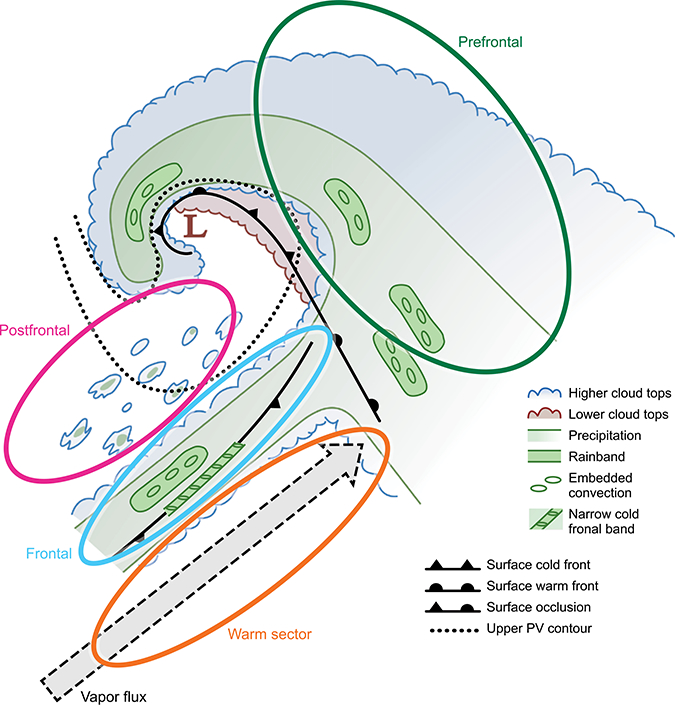
Idealization of the sectors of a typical extratropical cyclone passing over the OLYMPEX region. Modified from Houze (2014).
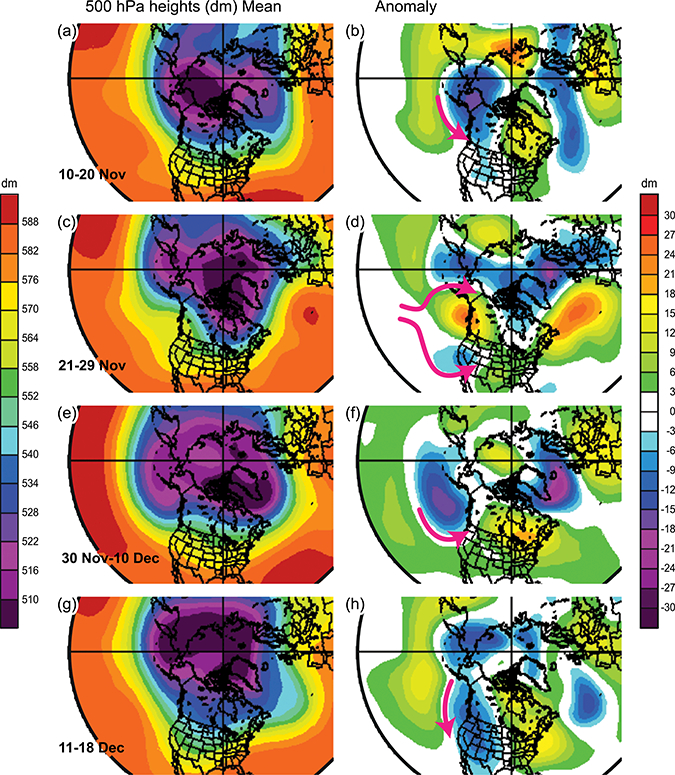
(left) Mean and (right) anomaly heights of the 500-hPa surface during four subperiods of OLYMPEX. Pink arrows indicate anomalous flow pattern at that level. The anomalies were calculated by subtracting the mean flow from the 30-yr climatology of the same time period. This figure was constructed from the NCEP-NCAR reanalysis dataset (Kalnay et al. 1996), and the images were provided by the NOAA/ESRL/Physical Sciences Division, Boulder, Colorado, from their website (www.esrl.noaa.gov/psd/ ).

Six-hour forecast of the precipitation accumulation for 1500–1800 UTC 8 Dec 2015 from the real-time University of Washington version of the Weather Research and Forecasting Model (Skamarock et al. 2008). Black box indicates NPOL/D3R location with NPOL range rings at 50 and 100 km (dashed). Black line indicates Quinault River valley.
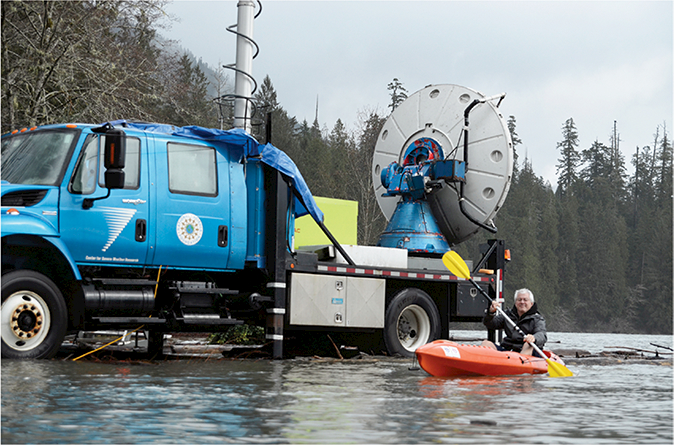
Dr. Joshua Wurman of Center for Severe Weather Research at the DOW radar site on 9 Dec 2015. Photo credit: Alycia Gilliland.

(a) NPOL radar reflectivity showing approaching NCFR at 2032 UTC 17 Nov 2015. Range rings (white) are at intervals of 25 km. (bottom) Data from soundings launched from the NPOL site (b) before (2021 UTC) and (c) after (2153 UTC) passage of the NCFR.

Down-looking APR-3 radar data as the DC-8 flew southwest (left side) to northeast (right side) over the Olympic Mountains on 8 Dec 2015. The flight track was from the Pacific Ocean, over the Queets valley, over the high terrain and the Hurricane Ridge area, to the leeside of the mountains. Note that the radar reflectivity data have not yet been corrected for attenuation.

Example of a radial velocity RHI over the Quinault valley from the NPOL at 0135 UTC 13 Nov 2015. The white region at the bottom of the cross section masks out the mountains. In this and subsequent NPOL figures, the quality-control process includes clutter removal. The data show a jet of cross-barrier flow rising over the terrain as indicated by the arrow.
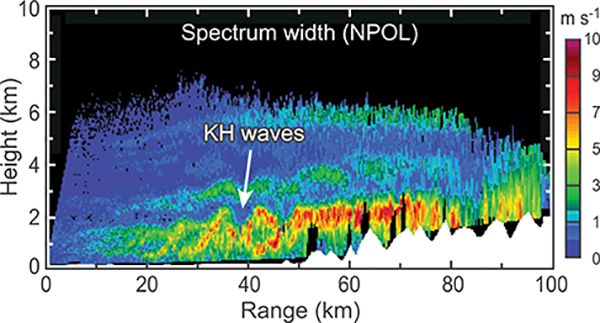
Example of Doppler spectrum width RHI from the NPOL over the Quinault valley at 1936 UTC 5 Dec 2015. The white region at the bottom of the cross section masks out the mountains. The data show a classic pattern of Kelvin-Helmholtz waves in the low-level flow.

Example of a differential reflectivity vertical RHI over the Quinault valley from the DOW radar at 0914 UTC 8 Dec 2015. The white region at the bottom of the cross section masks out the mountains. The data show a melting layer between 1- and 2-km altitude and a secondary maximum at 4–5 km.

Example of an RHI of Ka-band reflectivity observed by the D3R radar in an azimuth directed from the coast (range 0 km) toward the Quinault valley at 1828 UTC 18 Dec 2015.
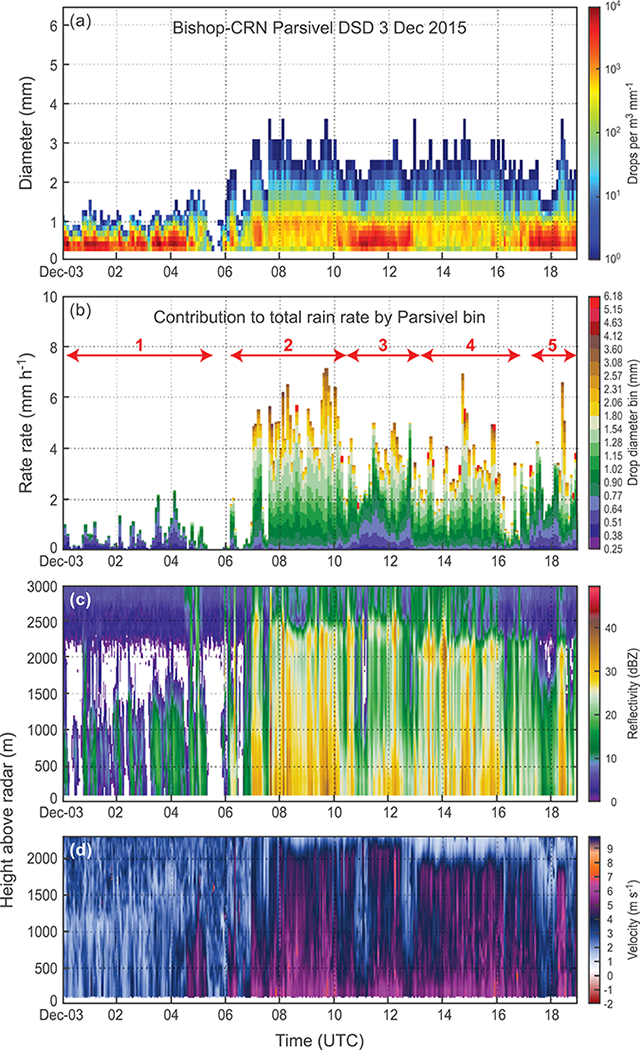
Time series of ground instrument observations from the Bishop Field (CRN) site at 285-m altitude in the Quinault valley for the period 0000–1900 UTC 3 Dec 2015. (a) Parsivel-2 drop size distribution, (b) contribution to total rain rate by Parsivel drop size bin, (c) MRR reflectivity, and (d) MRR fall velocity. The red arrows in (b) highlight five periods of differing drop size distribution characteristics that are discussed in the text.
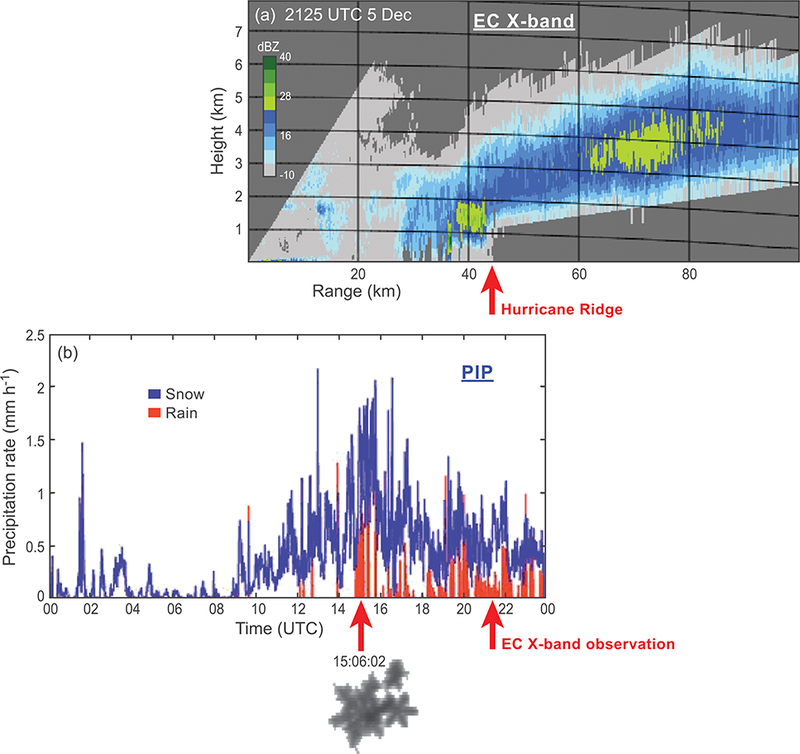
(a) Reflectivity RHI from the EC X-band radar at Albert Head, Vancouver Island. The azimuth of the RHI points to the south over Hurricane Ridge. Beyond Hurricane Ridge, the beam is blocked by terrain. (b) Precipitation rates from the PIP at Hurricane Ridge. An example of snow particle images recorded by the PIP at the indicated time is shown.

Example of Citation data obtained 1459–1530 UTC 5 Dec 2015 as the aircraft spiraled upward through cloud. Concentrations of ice particles in different size ranges are shown as a function of altitude. Temperature as a function of altitude is shown by the pink line.

Seasonal snow depth as measured at one of the snow poles (pink dots) located at 1301-m elevation near Mount Seattle (red triangle in Fig. 2) and two estimates of the snow depth by the ASO lidar flights made on 8–9 Feb and 29–30 Mar 2016 (blue box and whiskers). The lidar measurements are valid over a 60-m bounding area at the Mount Seattle location, the blue boxes on the plot enclose the first and third quartiles of the snow depth estimates, and the lowest and highest points outside each box are the lowest 10% and 90% snow depth values, respectively, within the 60-m area. Gaps in the snow-pole depth measurements are due to uncertainties when the camera lens was blocked or the snow depth was uneven around the pole. The vertical grid lines represent the beginning of each month. Figure adapted from Currier et al. (2017).
References
-
- Chapman D, and Browning KA, 1997: Radar observations of wind-shear splitting within evolving atmospheric Kelvin-Helmholtz billows. Quart. J. Roy. Meteor. Soc, 123, 1433–1439, doi:10.1002/qj.49712354114. - DOI
-
- Currier WR, Thorson T, and Lundquist JD, 2017: Independent evaluation of frozen precipitation from WRF and PRISM in the Olympic Mountains, WA, USA. J. Hydrometeor, doi:10.1175/JHM-D-17-0026.1, in press. - DOI
-
- Hou AY, and Coauthors, 2014: The Global Precipitation Measurement mission. Bull. Amer. Meteor. Soc, 95, 701–722, doi:10.1175/BAMS-D-13-00164.1. - DOI
-
- Houze RA Jr., 2012: Orographic effects on precipitating clouds. Rev. Geophys, 50, RG1001, doi:10.1029/2011RG000365. - DOI
Grants and funding
LinkOut - more resources
Full Text Sources
Other Literature Sources
Molecular Biology Databases