

Population projection accuracy: The impacts of sociodemographics, accessibility, land use, and neighbour characteristics
- PMID: 30140176
- PMCID: PMC6100728
- DOI: 10.1002/psp.2129
Population projection accuracy: The impacts of sociodemographics, accessibility, land use, and neighbour characteristics
Abstract
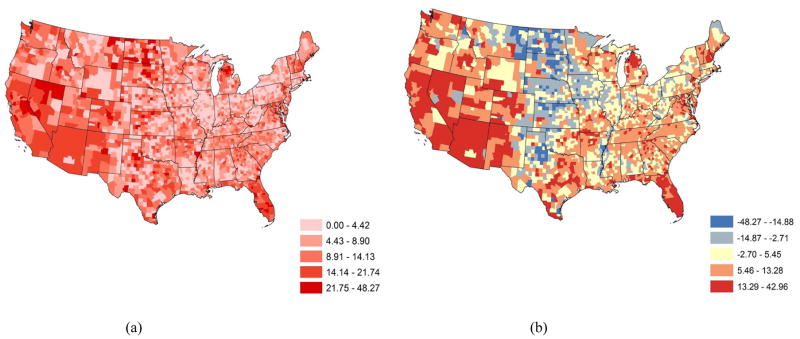
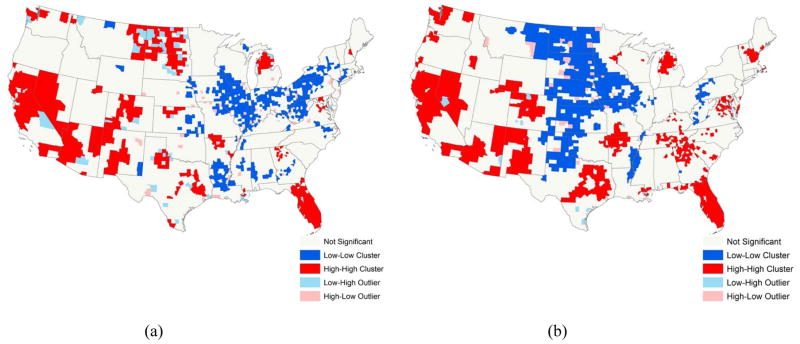
Population projection is essential to governments, businesses, and research communities for many purposes. Although projection performance is often evaluated, we know very little about what factors affect projection accuracy. It is important to understand these factors in order to utilize the projections knowledgeably. This study fills this gap in the literature by comprehensively investigating the possible factors associated with population projection accuracy in 2010 for the continental US counties. The results indicate that the counties whose populations are more predictable tend to be desirable places-places with abundant employment opportunities, reliable public transportation infrastructure, easy access to work, and/or high land development potential; their neighboring counties tend to have a well-educated population and a higher income level. Also, projection accuracy is highly spatially associated. The findings provide important insights for population projection users to understand the characteristics of counties and their neighboring counties associated with their projection accuracy.
Keywords: bias; driving factors; neighboring counties’ characteristics; population projection; precision; projection accuracy.
Figures
References
-
- Agresti A, Finlay B. Statistical methods for the social sciences. Upper Saddle River, NJ: Pearson; 2009.
-
- Anselin L. Local indicators of spatial association—LISA. Geographical Analysis. 1995;27(2):93–115.
-
- Boyce RR. The edge of the metropolis: The wave theory analog approach. British Columbia Geographical Series. 1966;7:31–40.
-
- Bracken I. A surface model approach to small area population estimation. The Town Planning Review. 1991;62(2):225–237. - PubMed
Grants and funding
LinkOut - more resources
Full Text Sources
Other Literature Sources
Miscellaneous