. 2018 Jul 25:9:1725.
doi: 10.3389/fimmu.2018.01725. eCollection 2018.

Survival, Retention, and Selective Proliferation of Lymphocytes Is Mediated by Gingival Fibroblasts

Affiliations

Survival, Retention, and Selective Proliferation of Lymphocytes Is Mediated by Gingival Fibroblasts

Carolyn G J Moonen et al. Front Immunol. .

Abstract

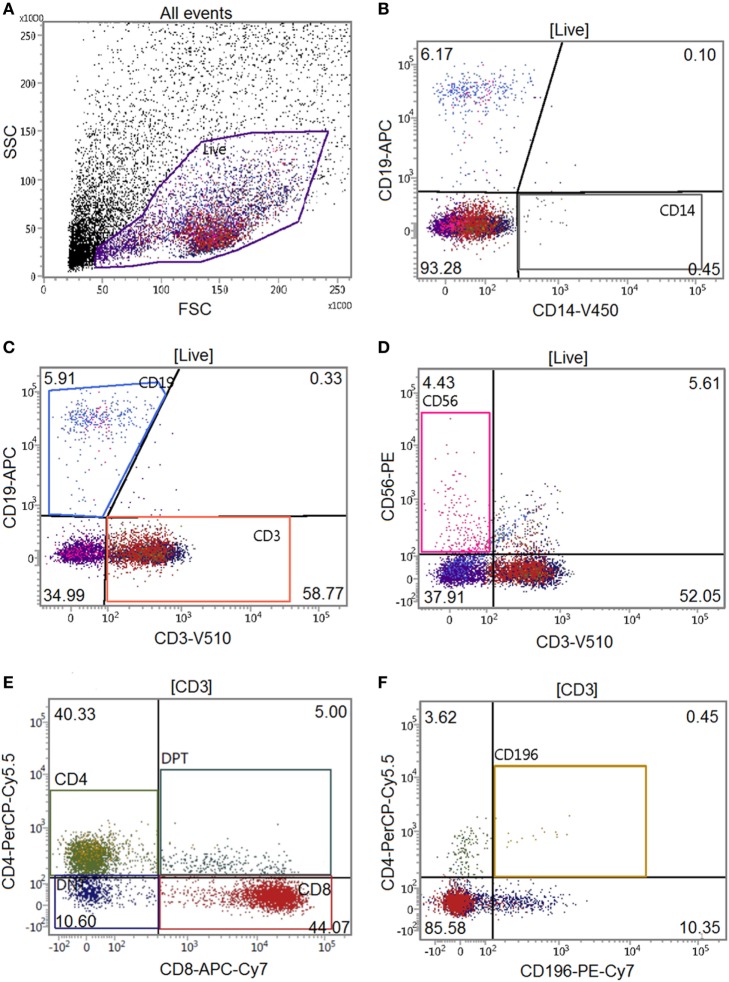
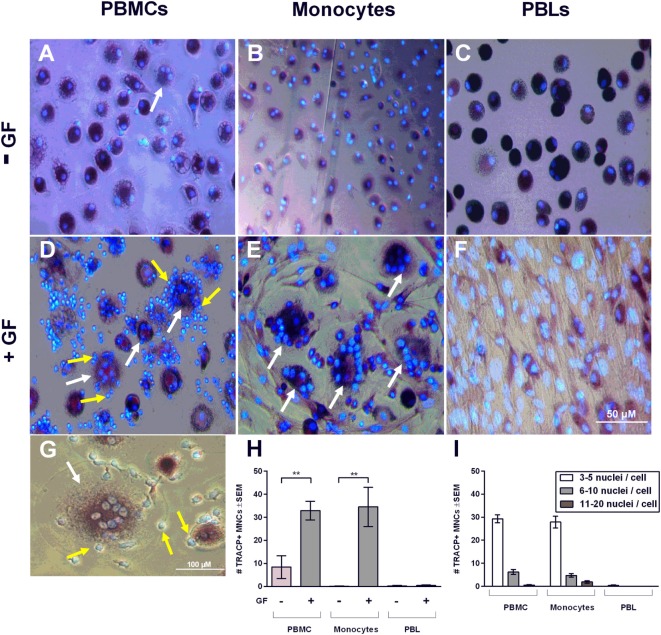
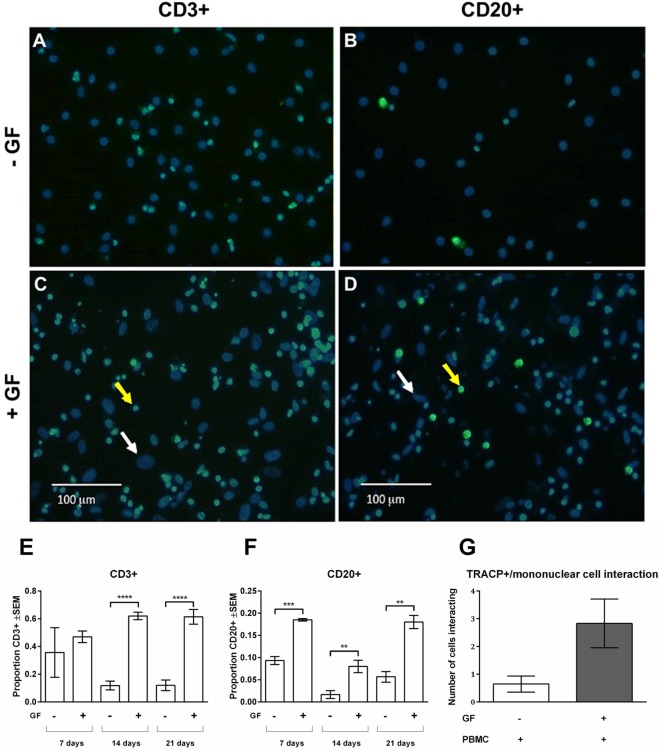
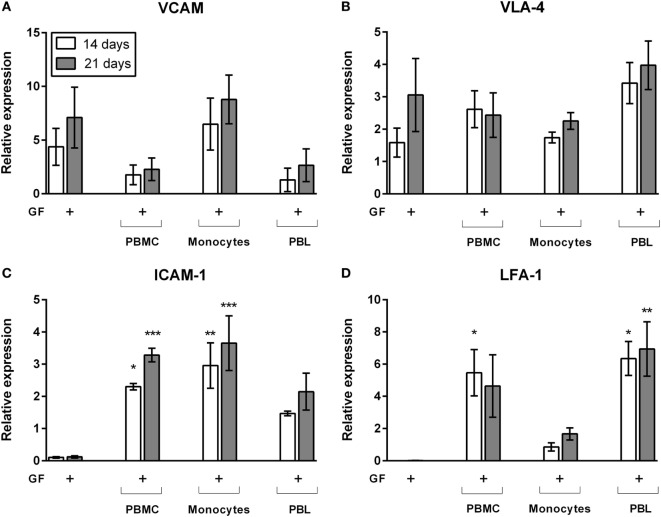
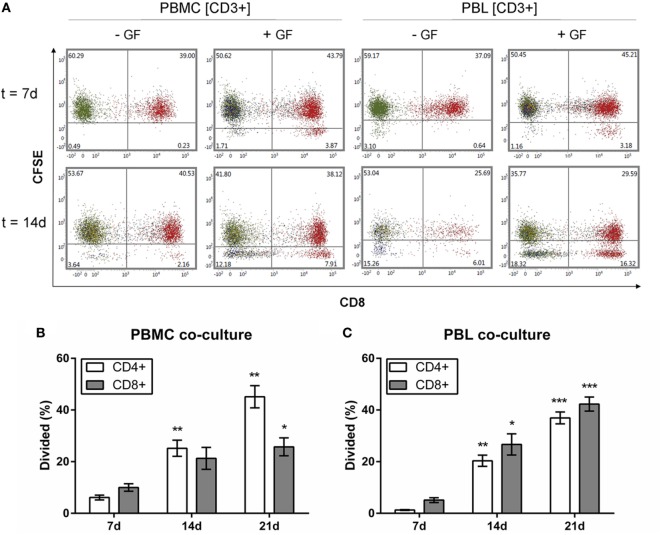
Periodontitis, a chronic inflammatory disease of the periodontium, is characterized by osteoclast-mediated alveolar bone destruction. Gingival fibroblasts (GFs) present in the bone-lining mucosa have the capacity to activate the formation of osteoclasts, but little is known about which local immune cells (co-)mediate this process. The aim of this study was to investigate the cellular interactions of GFs with immune cells, including the contribution of GFs to osteoclast formation and their possible role in the proliferation of these immune cells. In addition, we investigated the expression of adhesion molecules and the inflammatory cytokines that are evoked by this interaction. GFs were cocultured with peripheral blood mononuclear cells (PBMCs), CD14+ monocytes or peripheral blood lymphocytes (PBLs) for 7, 14, and 21 days. After 21 days, comparable numbers of multinucleated cells (osteoclasts) were found in gingival fibroblast (GF)-PBMC and GF-monocyte cocultures. No osteoclasts were formed in GF-PBL cocultures, indicating that the PBLs present in GF-PBMC cocultures do not contribute to osteoclastogenesis. Persisting mononuclear cells were interacting with osteoclasts in GF-PBMC cocultures. Remarkably, a predominance of CD3+ T cells was immunohistochemically detected in GF cocultures with PBLs and PBMCs for 21 days that frequently interacted with osteoclasts. Significantly more T, B (CD19+), and NK (CD56+CD3-) cells were identified with multicolor flow cytometry in both GF-PBMC and GF-PBL cocultures compared to monocultures without GFs at all time points. GFs retained PBLs independently of the presence of monocytes or osteoclasts over time, showing a stable population of T, B, and NK cells between 7 and 21 days. T helper and cytotoxic T cell subsets remained stable over time in GF cocultures, while the number of Th17 cells fluctuated. Lymphocyte retention is likely mediated by lymphocyte-function-associated antigen-1 (LFA-1) expression, which was significantly higher in GF-PBL cultures compared to GF-monocyte cultures. When assessing inflammatory cytokine expression, high tumor necrosis alpha expression was only observed in the GF-PBMC cultures, indicating that this tripartite presence of GFs, monocytes, and lymphocytes is required for such an induction. Carboxyfluorescein succinimidyl ester-labeling showed that only the CD3+ cells proliferated in presence of GFs. This study demonstrates a novel role for GFs in the survival, retention, and selective proliferation of lymphocytes.

Keywords: cell–cell interaction; gingival fibroblast; leukocytes; osteoclast formation; osteoimmunology; peripheral blood cells.


Figures

Figure 1
Figure 1
Gating tree of flow cytometry experiments. The antibody combination for flow cytometric experiments was CD14-V450/CD19-APC/CD3-V500/CD56-PE/CD4-PerCPCy5.5/CD8-APC-Cy7/CD196-PE-Cy7 (Table 1). Acquisition and analysis were performed on a BD FACSverse flow cytometer using associated FACSuite software. The number in quadrants indicate percentages of cells in the corresponding gating. The gating tree was set as follows: (A) forward scatter/sideward scatter represents the distribution of cells in the light scatter based on size and intracellular composition, respectively, where the live population is encircled in purple. In the “live” population, (B) CD14+, (C) CD19+, CD3+, (D) CD56+CD3− cells were identified. In the CD3+ gating, (E) CD4+, CD8+, and (F) CD196+ populations were identified. Here, a characterization of a gingival fibroblast-peripheral blood mononuclear cell coculture after 21 days is shown.
Figure 2
Figure 2
Gingival fibroblasts (GFs) enhance osteoclastogenesis in the presence of monocytes. Micrographs of monocultures of (A) peripheral blood mononuclear cell (PBMCs), (B) monocytes, and (C) peripheral blood lymphocytes (PBLs) after 21 days. Micrographs of cocultures of GFs with (D) PBMCs, (E) monocytes, and (F) PBLs after 21 days of culture. Cells were stained for TRACP activity (purple) and nuclei were stained with 4′,6-diamidino-2-fenylindool (blue). TRACP+ multinucleated cells (MNCs) were considered to be osteoclasts when TRACP+ with at least three nuclei. Osteoclasts are depicted with white arrows and are exclusively visible in conditions with cocultures of GFs with PBMCs and monocytes (D,E). All micrographs are representatives for four independent experiments with seven different GF sources. Scale bar represents 50 µM. (G) Osteoclast (white arrow) present in coculture of GFs with PBMCs. Interacting TRACP-negative mononuclear cells with osteoclasts are depicted with yellow arrows (D,G). Scale bar represents 100 µM. (H) Quantification of the number of TRACP+ MNCs per five standardized pictures per well in monocultures and cocultures of PBMCs, monocytes, or PBLs after 21 days. Significantly more osteoclasts were found in cocultures of GFs with PBMCs or monocytes when compared to monocultures, n = 4 GF donors, **p < 0.01. (I) Number of nuclei per TRACP+ cell in GF cocultures with PBMCs, monocytes, and PBLs after 21 days. Mainly, osteoclasts with 3–5 nuclei were found in cocultures with monocytes.
Figure 3
Figure 3
Gingival fibroblasts (GFs) are involved in the retention and survival of T and B cells after coculture with peripheral blood mononuclear cells (PBMCs). Overlay of immunohistochemical stainings with 4′,6-diamidino-2-fenylindool (DAPI) and CD3+ or CD20+ staining of (A,B) monocultures of PBMCs and (C,D) GF cocultures with PBMCs after 21 days of culture. (A,C) CD3+ and (B,D) CD20+ stainings (green) were performed to identify T and B cells, respectively. Nuclei are stained with DAPI (blue). GF nuclei are depicted with white arrows. CD3+ cells (A,C) and CD20+ cells (B,D) are depicted with yellow arrows, which are abundantly present in cocultures with GFs. Micrographs are representatives for two independent experiments with five different GF sources. Scale bars represent 100 µM. Proportions of CD3+ (E) and CD20+ (F) cells of total mononuclear cells after 7, 14, and 21 days were quantified from two standardized pictures per well. Significantly more CD3+ and CD20+ cells were identified in GF cocultures. The number of mononuclear cells interacting with TRACP+ cells (G) in PBMC monoculture (white bar) and GF coculture (gray bar). No significant difference (p = 0.0561) between mono- and cocultures was found. n = 5 GF donors, n = 2 buffy coats **p < 0.01, ***<0.001, ****<0.0001.
Figure 4
Figure 4
Peripheral blood lymphocytes cells survive in presence of gingival fibroblasts (GFs) after 21 days. Distribution of CD56+CD3−, CD3+, CD14+, and CD19+ as indicated by stack bars over time; (A) before coculturing (0 days), (B) after 7 days, and (C) after 21 days. The proportion of cells (in percentages ± SEM) in live populations of (A) monocultures and (B,C) cocultures are presented in the table below (A–C) per cell subtype for cocultures with GFs. (D–G) Specification of (C) at 21 days. (D) CD3+ T cells, (E) CD19+ B cells, (F) CD56+CD3− NK cells, (G) CD14+ monocytes. (D–F) For all peripheral blood lymphocytes (PBLs), significantly more events per microliters were detected in cocultures with peripheral blood mononuclear cells and PBLs. (H) Specification of CD3+ cell population at baseline levels where CD3+CD4+, CD3+CD8+, and CD3+CD4+CD196+ T cells are shown. (I) Specification of CD3+ cell populations after 21 days where CD3+CD4+, CD3+CD8+, and CD3+CD4+CD196+ T cells are shown. Tables below figures (H,I) represent proportion (percentages ± SEM) of cell populations per (H) monoculture and (I) coculture. Data are presented as events per microliter (A–C,H,I) ±SEM (D–G). n = 10 GF donors, n = 2 buffy coats, *p < 0.05, **<0.01.
Figure 5
Figure 5
Survival and retention of peripheral blood lymphocytes in coculture of gingival fibroblast (GF) over time. Percentages of cells present in cocultures. (A) The proportion of CD14+ cells (percentage ± SEM) present in GF cocultures with peripheral blood mononuclear cells (PBMCs) (solid line) and monocytes (dotted line). (B) Geometric mean fluorescence intensity (gMFI) of CD14+ cells over time of GF cocultures with PBMCs (solid line) and monocytes (dotted line). No significant difference of CD14+ percentage (A) or gMFI (B) after 7 days was observed. Percentages ±SEM of (C) CD19+, (D) CD56+CD3−, (E) CD3+, (F) CD3+CD4+, (G) CD3+CD8+, (H) CD3+CD4+CD196+ cells present in GF cocultures with PBMCs (solid line) and peripheral blood lymphocytes (PBLs) (dotted line). No significant increase or decrease of percentage (D) CD56+CD3−, (E) CD3+, (F) CD3+CD4+ cells is shown over time in both cocultures of PBMCs and PBLs. (C) A significant decrease of CD19+ cells after 7 days is shown in PBL cocultures. Significant decrease of CD3+CD8+ cells is shown after 7 days in PBMC cocultures. A significant decrease of CD3+CD4+CD196+ cells after 14 days is shown in PBMC and PBL cocultures. Time point 0 represents monocultures of (A,B) monocytes, (C–H) PBMCs, and PBLs. All significant differences were tested after 7 days since time point 0 represents a characterization of one experiment. n = 10 GF donors, n = 2 buffy coats, *p < 0.05, **<0.01.
Figure 6
Figure 6
Gene expression of cell adhesion molecules of gingival fibroblast (GF) mono- and cocultures. Relative gene expression of adhesion molecules after 14 (white bars) and 21 days (gray bars) of culture. Gene expression of (A) VCAM, (B) very late antigen-4 (VLA-4), (C) intercellular adhesion molecule 1 (ICAM-1), and (D) LFA-1. No significant differences were found in VCAM and VLA-4 expression (A,B) while LFA-1 and ICAM-1 (C,D) expression is significantly increased in cocultures in comparison to GF monocultures. No significant differences were found over time. All genes are expressed relative to the geometric mean of housekeeping genes hypoxanthine phosphoribosyltransferase (HPRT) and porphobilinogen deaminase (PBGD). Data are presented as means ± SEM. All significant differences were compared to GF monocultures. n = 4 GF donors, *p < 0.05, **<0.01, ***<0.001.
Figure 7
Figure 7
Gene expression and cytokine protein levels of tumor necrosis alpha (TNF-α) and interleukin 1 beta (IL-1β). Gene and protein expression of inflammatory cytokines (A,B) TNF-α and (C,D) IL-1β. Relative gene expression of inflammatory cytokines (A) TNF-α and (C) IL-1β after 14 (white bars) and 21 days (gray bars) of culture. Protein levels (pg/mL) of (B) TNF-α and (D) IL-1β after 7 (dark gray bars), 14 (white bars), and 21 days (gray bars). TNF-α (A) gene expression levels are significantly increased in gingival fibroblast (GF)-peripheral blood mononuclear cell (PBMC) cocultures (14 days) and GF-peripheral blood lymphocyte (PBL) cocultures (14 and 21 days) in comparison to GF monocultures. TNF-α (B) protein levels are significantly increased in GF-PBMC cocultures (7 days) and GF-PBL cocultures (21 days) in comparison to GF monocultures. No significant differences were found for IL-1β gene expression (C) and protein levels (D). All genes are expressed relative to the geometric mean of housekeeping genes hypoxanthine phosphoribosyltransferase and porphobilinogen deaminase. Data are presented as means ± SEM. All significant differences were compared to GF monocultures. n = 6 GF donors for gene expression data, n = 5 GF donors for cytokine quantification data, *p < 0.05, **<0.01, ***<0.001, ****<0.0001.
Figure 8
Figure 8
CD3+CD4+ and CD3+CD8+ cells proliferate in the presence of gingival fibroblasts (GFs). Quantification of proliferating Carboxyfluorescein succinimidyl ester (CFSE)-labeled CD3+ cells over time. (A) Dot plots of CD3+ cells within peripheral blood mononuclear cell (PBMC) (left panels) and peripheral blood lymphocyte (PBL) (right panels) cocultures after 7 (upper panels) and 14 days (lower panels). CFSE intensity is plotted on the y-axis and CD8+ is plotted on the x-axis. CD3+CD8+ cells are shown in red, CD3+CD8− (CD3+CD4+) cells are shown in green. Numbers in lower quadrants indicate the percentages of cells that have divided. (B) Quantification of the divided CD4+ (white bars) and CD8+ (gray bars) cells (normalized percentages ± SEM) in PBMC cocultures over time. (C) Quantification of the divided CD4+ (white bars) and CD8+ (gray bars) cells (normalized percentages ± SEM) in PBL cocultures over time. All significant differences were compared to 7 days. n = 5 GF donors, *p < 0.05, **<0.01, ***<0.001.

Similar articles

Cited by

References

    1. Balta MG, Loos BG, Nicu EA. Emerging concepts in the resolution of periodontal inflammation: a role for resolvin E1. Front Immunol (2017) 8:1–11.10.3389/fimmu.2017.01682 - DOI - PMC - PubMed
    1. de Vries TJ, Andreotta S, Loos BG, Nicu EA. Genes critical for developing periodontitis: lessons from mouse models. Front Immunol (2017) 8:1–16.10.3389/fimmu.2017.01395 - DOI - PMC - PubMed
    1. Silva N, Abusleme L, Bravo D, Dutzan N, Garcia-Sesnich J, Vernal R, et al. Host response mechanisms in periodontal diseases. J Appl Oral Sci (2015) 23:329–55.10.1590/1678-775720140259 - DOI - PMC - PubMed
    1. Khan SA, Kong EF, Meiller TF, Jabra-Rizk MA. Periodontal diseases: bug induced, host promoted. PLoS Pathog (2015) 11:1–8.10.1371/journal.ppat.1004952 - DOI - PMC - PubMed
    1. Hienz SA, Paliwal S, Ivanovski S. Mechanisms of bone resorption in periodontitis. J Immunol Res (2015) 2015:1–10.10.1155/2015/615486 - DOI - PMC - PubMed

MeSH terms