. 2018 Aug 9:9:1086.
doi: 10.3389/fpls.2018.01086. eCollection 2018.

Real-Time PCR for Diagnosing and Quantifying Co-infection by Two Globally Distributed Fungal Pathogens of Wheat

Affiliations

Real-Time PCR for Diagnosing and Quantifying Co-infection by Two Globally Distributed Fungal Pathogens of Wheat

Araz S Abdullah et al. Front Plant Sci. .

Abstract

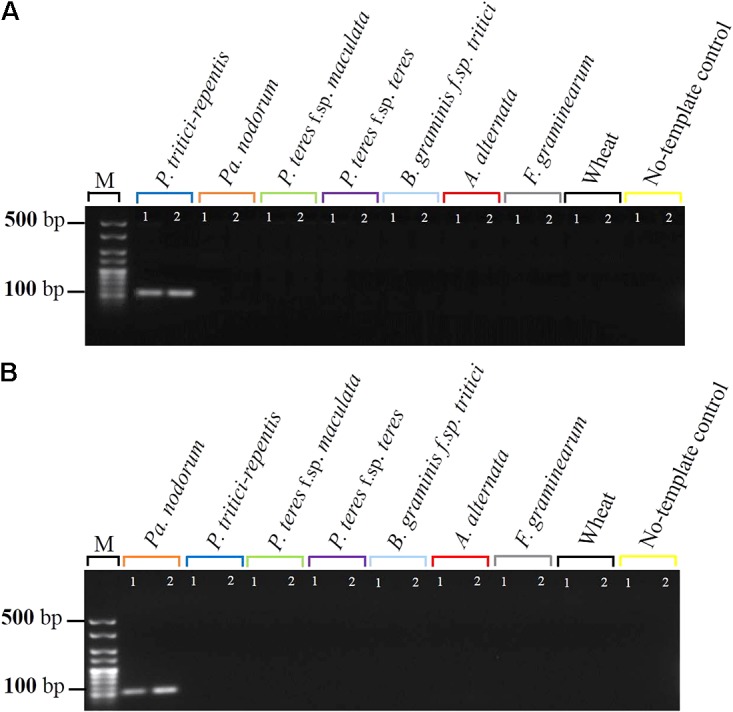
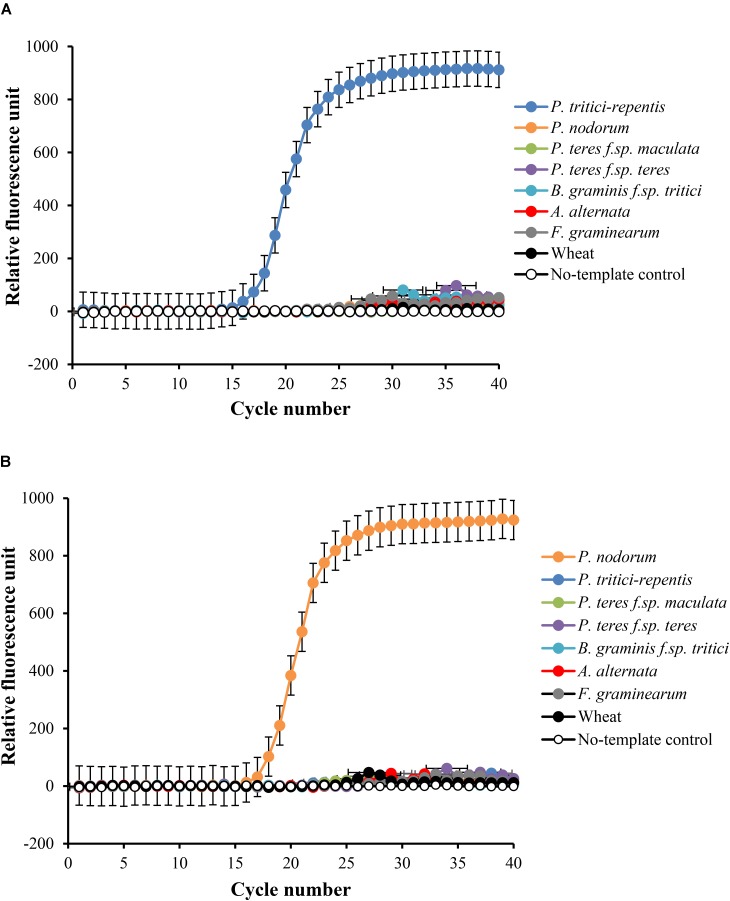
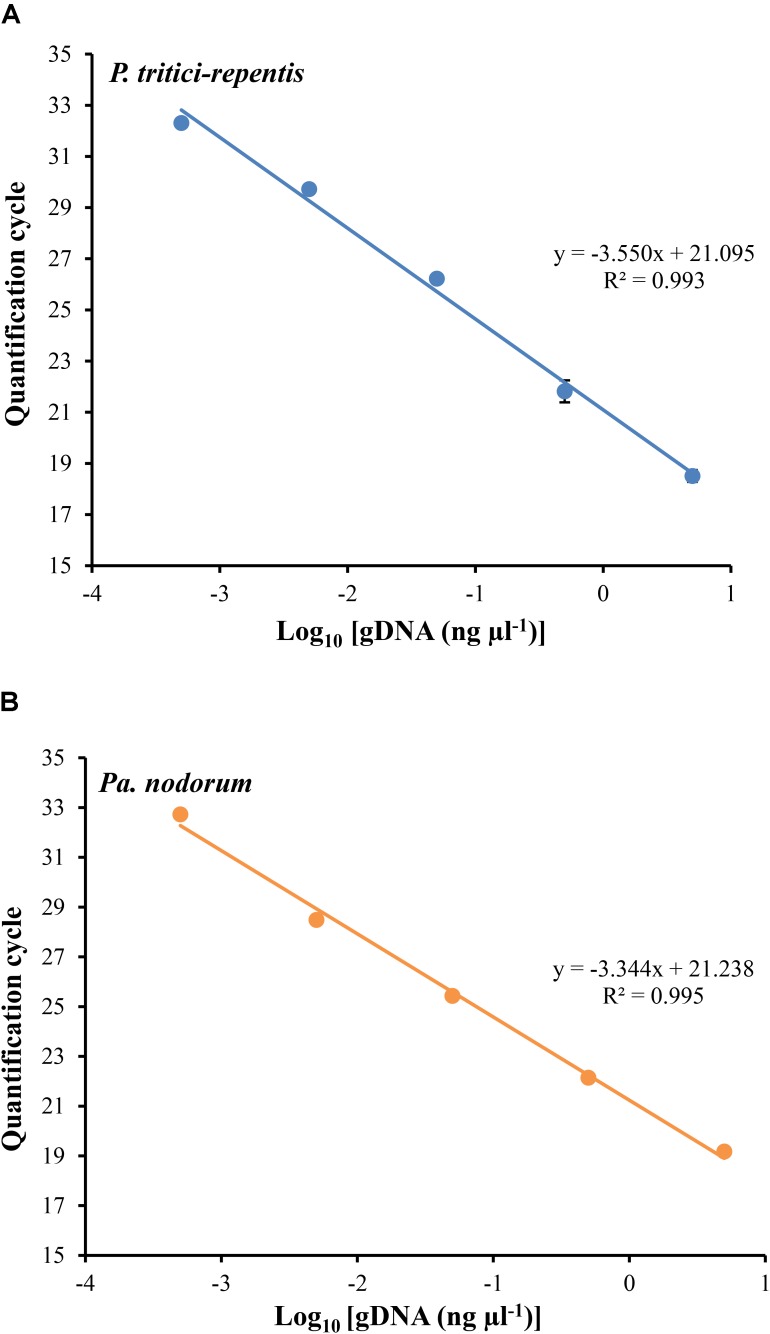
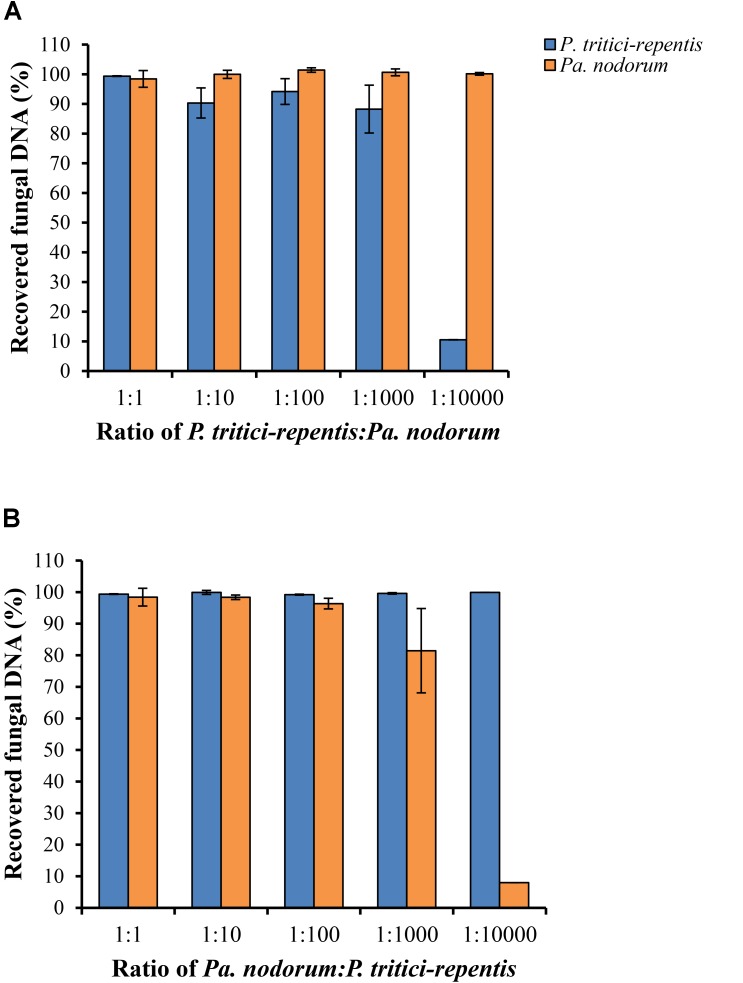
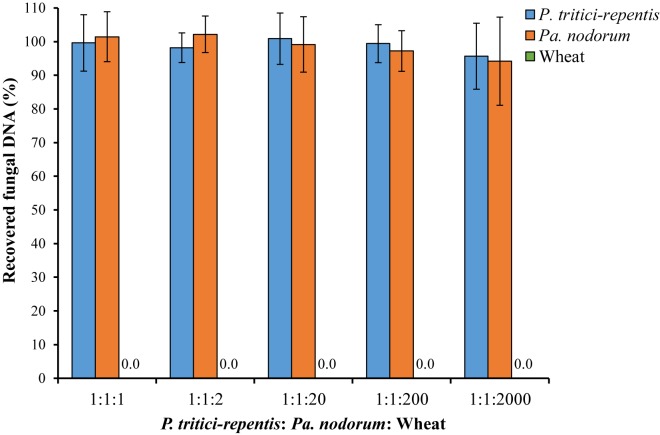
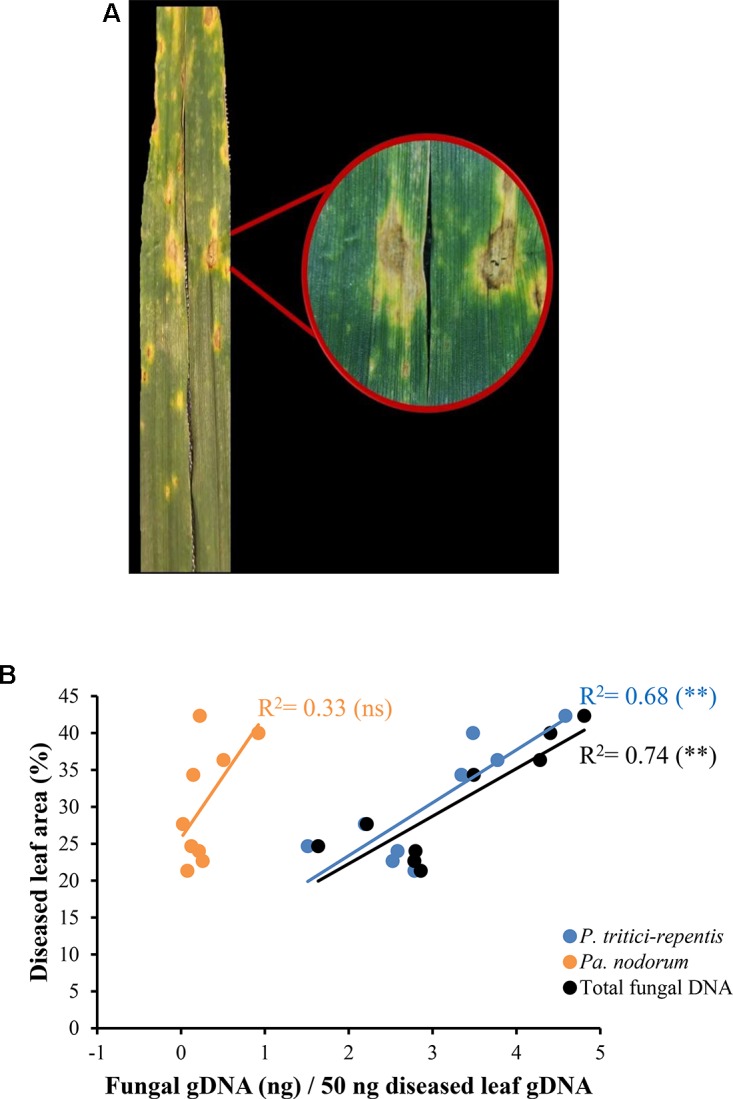
Co-infections - invasions of a host-plant by multiple pathogen species or strains - are common, and are thought to have consequences for pathogen ecology and evolution. Despite their apparent significance, co-infections have received limited attention; in part due to lack of suitable quantitative tools for monitoring of co-infecting pathogens. Here, we report on a duplex real-time PCR assay that simultaneously distinguishes and quantifies co-infections by two globally important fungal pathogens of wheat: Pyrenophora tritici-repentis and Parastagonospora nodorum. These fungi share common characteristics and host species, creating a challenge for conventional disease diagnosis and subsequent management strategies. The assay uses uniquely assigned fluorogenic probes to quantify fungal biomass as nucleic acid equivalents. The probes provide highly specific target quantification with accurate discrimination against non-target closely related fungal species and host genes. Quantification of the fungal targets is linear over a wide range (5000-0.5 pg DNA μl-1) with high reproducibility (RSD ≤ 10%). In the presence of host DNA in the assay matrix, fungal biomass can be quantified up to a fungal to wheat DNA ratio of 1 to 200. The utility of the method was demonstrated using field samples of a cultivar sensitive to both pathogens. While visual and culture diagnosis suggested the presence of only one of the pathogen species, the assay revealed not only presence of both co-infecting pathogens (hence enabling asymptomatic detection) but also allowed quantification of relative abundances of the pathogens as a function of disease severity. Thus, the assay provides for accurate diagnosis; it is suitable for high-throughput screening of co-infections in epidemiological studies, and for exploring pathogen-pathogen interactions and dynamics, none of which would be possible with conventional approaches.

Keywords: co-infections; hydrolysis probes; molecular disease diagnosis; pathogen interactions; qPCR.


Figures

FIGURE 1
FIGURE 1
Specificity testing of primers by agarose gel electrophoresis. (A) Primers of P. tritici-repentis, Ptr-Forward and Ptr-Reverse, were tested against Pa. nodorum DNA, and (B) primers of Pa. nodorum, Pn-Forward and Pn-Reverse, were tested against P. tritici-repentis DNA in two separate PCR reactions. Reactions included negative controls of DNA samples from five cereal fungal pathogens. Reactions including positive and negative controls were electrophoresed on 2% agarose with two technical replicates.
FIGURE 2
FIGURE 2
Specificity testing of primers and their matching probes in singleplex real-time qPCR settings. Amplification curve for P. tritici-repentis is plotted in blue (A) and amplification curve of Pa. nodorum is plotted in orange (B). Primers and probes (Table 1) were tested against DNA from the five fungal species, a negative wheat control, and a no template control and reactions were run separately. Data represent means ± standard deviation (n = 3).
FIGURE 3
FIGURE 3
(A) The relationship between quantification cycle and logarithm of the concentration of fungal DNA in duplexed qPCR settings. Triplicate dilution series corresponding to gDNA concentrations of 5000, 500, 50, 5, and 0.5 pg μl-1 were prepared. No-template samples were included in every reaction as negative controls (n = 10). The quantification cycle at which fluorescent signals were observed is plotted against the logarithm of DNA concentrations of P. tritici-repentis (A) and Pa. nodorum (B). The corresponding regression equations and coefficient of determinations (R2) are shown on the plot. Data are means ± standard deviation where visible (n = 3).
FIGURE 4
FIGURE 4
Detection and quantification of P. tritici-repentis and Pa. nodorum in a simulated DNA matrix of various ratios. (A) P. tritici-repentis DNA was spiked with Pa. nodorum DNA at ratios of 1:1, 1:10, 1:100, 1:1000, and 1:10000. (B) Pa. nodorum was spiked with P. tritici-repentis DNA at same ratios. The starting concentration was 5 ng μl-1 of each pathogen DNA. The subsequent ratios were sequential 10-fold dilutions (0.5, 0.05, 0.005, and 0.0005 ng μl-1) of one pathogen DNA, with the other held constant at 5 ng μl-1. Data represent means ± standard deviation (n = 6).
FIGURE 5
FIGURE 5
Simulated DNA matrix of various ratios of fungi to wheat DNA. Increasing concentrations (5–100 ng μl-1) of wheat DNA were spiked with decreasing concentrations of fungal DNA (5–0.05 ng μl-1). Quantification was done in real-time quantitative PCR and reactions were duplexed each containing four fungal-specific primers and two complementary probes (Table 1). DNA concentrations respectively were 5:5:5, 5:5:10, 5:5:100, 0.5:0.5:100, and 0.05:0.05:100 ng μl-1. Data represent means ± standard deviation (n = 6). Wheat DNA was not quantified/detected.
FIGURE 6
FIGURE 6
Quantification of fungal DNA in naturally infected wheat leaves. (A) Leaves displaying tan spot symptoms with tan necrotic centers and yellow halos. (B) A linear model fitted into the relationship between fungal DNA measured in real-time quantitative PCR and conventional disease score. The corresponding regression equation and coefficient of determination (R2) are shown on the plot. ns and ∗∗ refer to not significant and significant (P < 0.01), respectively.

References

    1. Abdullah A. S. A., Moffat C., Lopez Ruiz F. J. L., Gibberd M. G., Hamblin J., Zerihun A. Z. (2017). Host–multi–pathogen warfare: pathogen interactions in co-infected plants. Front. Plant Sci. 8:1806. 10.3389/fpls.2017.01806 - DOI - PMC - PubMed
    1. Alizon S., De Roode J. C., Michalakis Y. (2013). Multiple infections and the evolution of virulence. Ecol. Lett. 16 556–567. 10.1111/ele.12076 - DOI - PubMed
    1. Armbruster D. A., Pry T. (2008). Limit of blank, limit of detection and limit of quantitation. Clin. Biochem. Rev. 29(Suppl. 1), S49–S52. - PMC - PubMed
    1. Atallah Z. K., Bae J., Jansky S. H., Rouse D. I., Stevenson W. R. (2007). Multiplex real-time quantitative PCR to detect and quantify Verticillium dahliae colonization in potato lines that differ in response to Verticillium wilt. Phytopathology 97 865–872. 10.1094/PHYTO-97-7-0865 - DOI - PubMed
    1. Bakker M. G., Schlatter D. C., Otto-Hanson L., Kinkel L. L. (2014). Diffuse symbioses: roles of plant–plant, plant-microbe and microbe-microbe interactions in structuring the soil microbiome. Mol. Ecol. 23 1571–1583. 10.1111/mec.12571 - DOI - PubMed