Randomized Controlled Trial
. 2018 Aug 22;4(8):eaar8590.
doi: 10.1126/sciadv.aar8590. eCollection 2018 Aug.

Acute sleep loss results in tissue-specific alterations in genome-wide DNA methylation state and metabolic fuel utilization in humans

Affiliations
Randomized Controlled Trial

Acute sleep loss results in tissue-specific alterations in genome-wide DNA methylation state and metabolic fuel utilization in humans

Jonathan Cedernaes et al. Sci Adv. .

Abstract

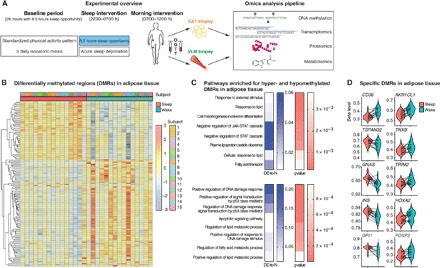
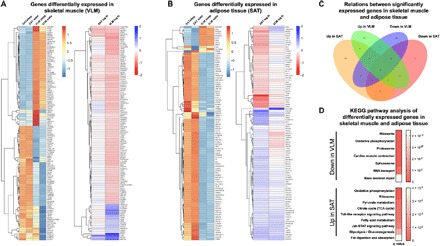
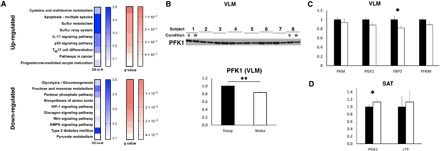
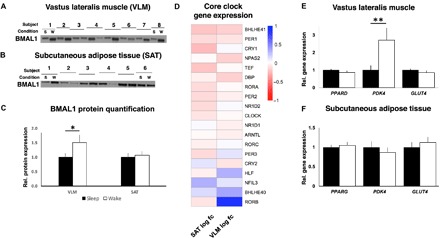
Curtailed sleep promotes weight gain and loss of lean mass in humans, although the underlying molecular mechanisms are poorly understood. We investigated the genomic and physiological impact of acute sleep loss in peripheral tissues by obtaining adipose tissue and skeletal muscle after one night of sleep loss and after one full night of sleep. We find that acute sleep loss alters genome-wide DNA methylation in adipose tissue, and unbiased transcriptome-, protein-, and metabolite-level analyses also reveal highly tissue-specific changes that are partially reflected by altered metabolite levels in blood. We observe transcriptomic signatures of inflammation in both tissues following acute sleep loss, but changes involving the circadian clock are evident only in skeletal muscle, and we uncover molecular signatures suggestive of muscle breakdown that contrast with an anabolic adipose tissue signature. Our findings provide insight into how disruption of sleep and circadian rhythms may promote weight gain and sarcopenia.


Figures

Fig. 1
Fig. 1. Acute sleep loss induces changes in DNA methylation in adipose tissue in healthy humans.
(A) Participants were investigated both after a night of sleep loss (that is, overnight wakefulness) and after a night of normal sleep, in each condition after an in-lab baseline day and night (26 hours in total, with an 8.5-hour baseline sleep opportunity) with standardized physical activity levels and isocaloric meals. Biopsies from the vastus lateralis muscle (VLM) and subcutaneous adipose tissue (SAT), as well as fasting blood sampling, preceded an oral glucose tolerance test (OGTT) and subsequent blood sampling. This was followed by a pipeline of omic analyses across tissues. (B) Differentially methylated regions (DMRs; FDR < 0.05) in adipose tissue showing DNA methylation (beta levels) after sleep and sleep loss (wake) across the 15 participants, with hierarchical clustering of DMR beta levels (z scores). (C) Significant gene ontology (GO) annotations based on hypermethylated (top) and hypomethylated DMRs (bottom) in adipose tissue in response to sleep loss, showing the ratio of differentially expressed gene-associated DMRs (DE) to the total number (N) of genes in a given pathway (“DE-to-N”) and adjusted P values (q values, FDR< 0.05). (D) Beta levels across some of the most significant DMRs in adipose tissue, in proximity to the specified genes, following sleep and sleep loss.
Fig. 2
Fig. 2. Tissue-specific transcriptomic alterations in response to acute sleep loss in healthy humans.
(A) Relative expression levels of differentially expressed genes (FDR < 0.05) in VLM showing levels across both VLM and SAT in both sleep and wake states (left; normalized by row, that is, all rows share the same mean and the same variance; the scale is truncated at −1 and 1). The fold changes for each tissue in response to sleep loss (that is, overnight wakefulness, wake) are also shown (right). (B) Corresponding analysis as shown in (A) for genes differentially expressed in adipose tissue in response to sleep loss. (C) Venn diagram displaying the number and overlap for significantly up- and down-regulated genes in each tissue following sleep loss. (D) GSEA using the R package GAGE against the KEGG ontology showing significant pathways (q values, with FDR < 0.05; scale shown to the right) that are down-regulated in VLM compared with pathways up-regulated in SAT in response to sleep loss (see table S4, A to D, for a complete list of all up- and down-regulated pathways in each tissue). fc, fold change.
Fig. 3
Fig. 3. Acute sleep loss down-regulates protein levels in the glycolysis pathway in skeletal muscle of healthy young men.
(A) KEGG pathway analysis of significantly altered VLM proteins (via mass spectrometry) in the morning following sleep loss compared with after a night of normal sleep (n = 15 pairs; see also Table 1 and table S5). Shown as ratio of differentially expressed proteins in relation to total number of proteins in pathway (DE-to-N), and as adjusted P values (q values; FDR < 0.05) for pathways based on up-regulated (top) and down-regulated (bottom) proteins. (B) Immunoblot analysis of PFK1 in VLM (P = 0.009), normalized to loading control (loading control shown in fig. S4A; showing 8 representative pairs out of a total of 13 analyzed pairs); quantified in the bottom for sleep loss [wake (w)] compared with normal sleep (s). qPCR analyses of significant proteomic hits in response to sleep loss in (C) VLM and in (D) SAT (P = 0.027 for FBP2 in VLM; P = 0.031 for PGK1 in adipose tissue for hypothesized contrasts between sleep versus sleep loss). Solid black bars represent values after sleep (set to 1); white bars indicate values obtained after sleep loss (n = 15 pairs for both tissues). FBP2, fructose-bisphosphatase 2; LTF, lactotransferrin; PFKM, 6-phosphofructokinase, muscle type; PKM, pyruvate kinase muscle isozyme. *P < 0.05 and **P < 0.01; two-sided t tests. TH17, T helper 17; IL-17, interleukin 17.
Fig. 4
Fig. 4. Acute sleep loss induces tissue-specific changes in clock genes and downstream pathways in healthy young men.
Representative blots for protein abundance of BMAL1 in (A) skeletal muscle (VLM; P = 0.017; showing 8 representative pairs out of a total of 13 analyzed pairs) and in (B) SAT (P = 0.51; 6 representative pairs out of 11 analyzed pairs shown), (C) with quantification, after a night of sleep (s) and a night of sleep loss (wake or w). Western blots were normalized to loading control (see fig. S4, B and C; expression shown relative to controls that were set to 1). (D) Transcriptomic changes in core circadian clock genes, with log2 fold change for each of the investigated tissues (VLM and SAT, n = 15 pairs for each tissue), after sleep loss (wake) compared with after normal sleep (all FDR > 0.05). (E and F) Relative gene expression of targeted genes based on qPCR (PDK4: P = 0.007; all other P > 0.10, n = 15 pairs for each tissue). BMAL1, brain and muscle Arnt-like protein-1; GLUT4, glucose transporter 4; PDK4, pyruvate dehydrogenase kinase isozyme 4; PPARD/PPARG, peroxisome proliferator–activated receptor delta (PPARD)/gamma (PPARG); s, sleep; w, wake (sleep loss). *P < 0.05 and **P < 0.05; two-sided t tests.
Fig. 5
Fig. 5. Hierarchical clustering analyses reveal close relationship between changes in serum and skeletal muscle metabolite levels in response to acute sleep loss.
(A) Shared metabolites across subcutaneous adipose tissue, skeletal muscle, and fasting serum. Rows indicate metabolites—based on gas chromatography mass spectrometry (GCMS) metabolomic data—and have been ranked according to relatedness in terms of (i) changes across tissues (column-wise ranking) and (ii) fold changes across metabolites, following sleep loss (wake) (using log2 values for the sleep loss/sleep ratio). The degree of changes in metabolites following sleep loss is color-coded, with red indicating increased levels and blue indicating decreased levels (sleep loss/sleep). Metabolite set enrichment analysis for (B) skeletal muscle and serum metabolites and for (C) subcutaneous adipose tissue metabolites. n = 13 for each tissue.

References

    1. Cappuccio F. P., D’Elia L., Strazzullo P., Miller M. A., Quantity and quality of sleep and incidence of type 2 diabetes: A systematic review and meta-analysis. Diabetes Care 33, 414–420 (2010). - PMC - PubMed
    1. Cappuccio F. P., Taggart F. M., Kandala N. B., Currie A., Peile E., Stranges S., Miller M. A., Meta-analysis of short sleep duration and obesity in children and adults. Sleep 31, 619–626 (2008). - PMC - PubMed
    1. Wong P. M., Hasler B. P., Kamarck T. W., Muldoon M. F., Manuck S. B., Social jetlag, chronotype, and cardiometabolic risk. J. Clin. Endocrinol. Metab. 100, 4612–4620 (2015). - PMC - PubMed
    1. Roenneberg T., Allebrandt K. V., Merrow M., Vetter C., Social jetlag and obesity. Curr. Biol. 22, 939–943 (2012). - PubMed
    1. Spaeth A. M., Dinges D. F., Goel N., Effects of experimental sleep restriction on weight gain, caloric intake, and meal timing in healthy adults. Sleep 36, 981–990 (2013). - PMC - PubMed

Publication types