. 2018 Aug 1;18(8):10.
doi: 10.1167/18.8.10.

Sensory and decision-making processes underlying perceptual adaptation

Affiliations

Sensory and decision-making processes underlying perceptual adaptation

Nathan Witthoft et al. J Vis. .

Abstract

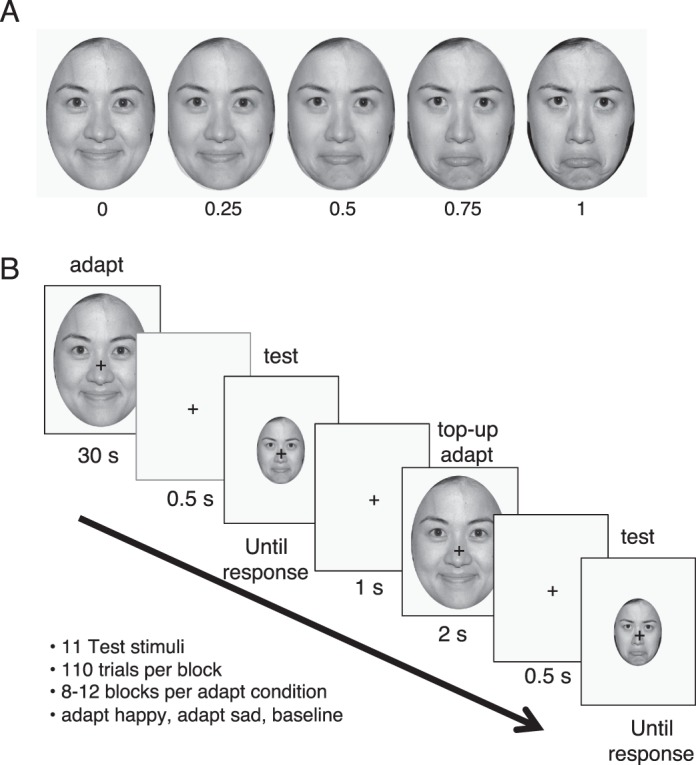
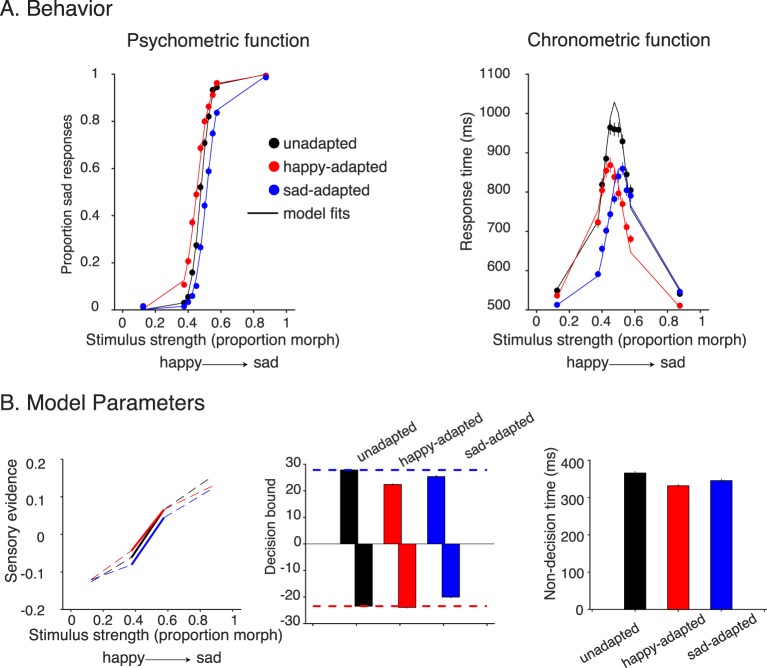
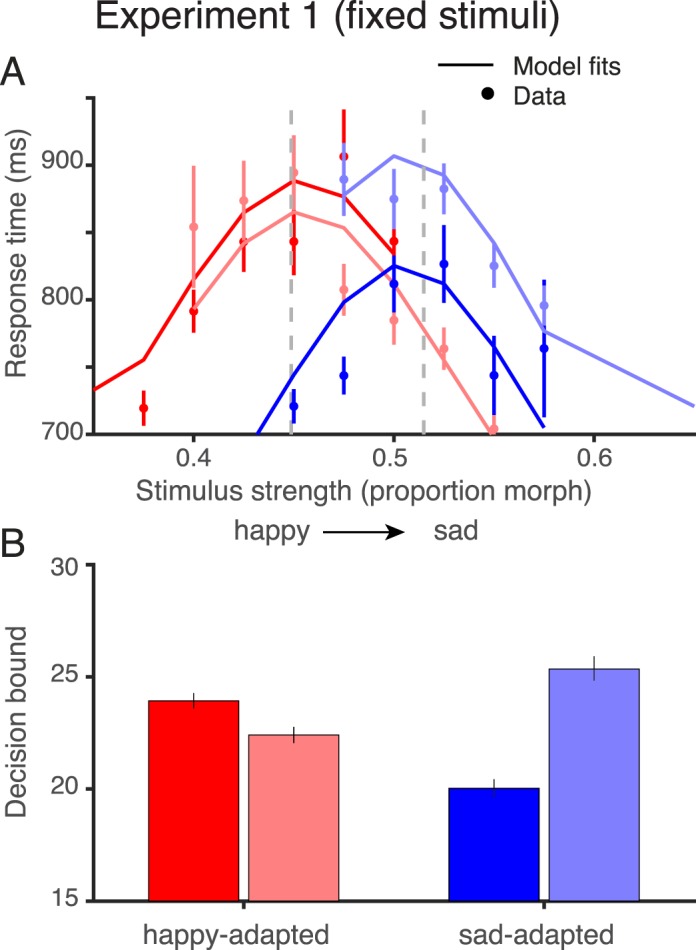
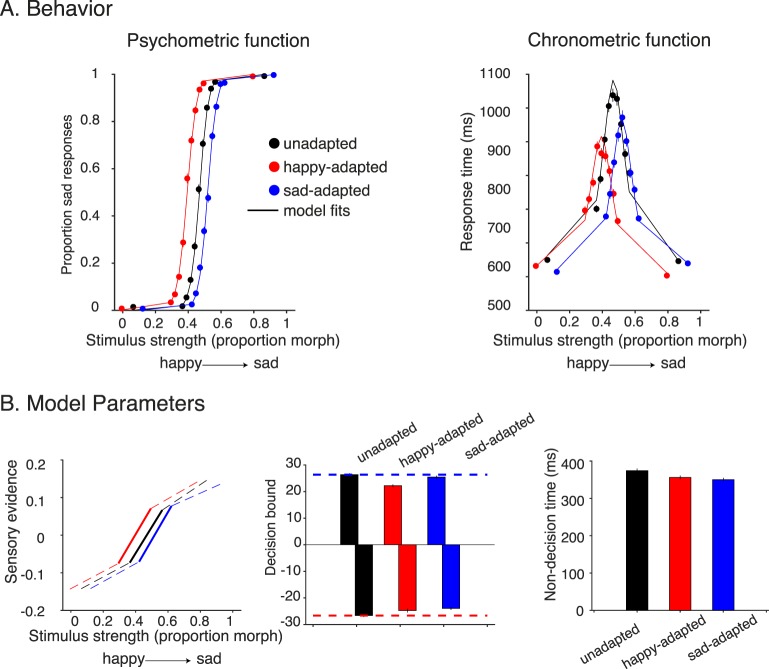
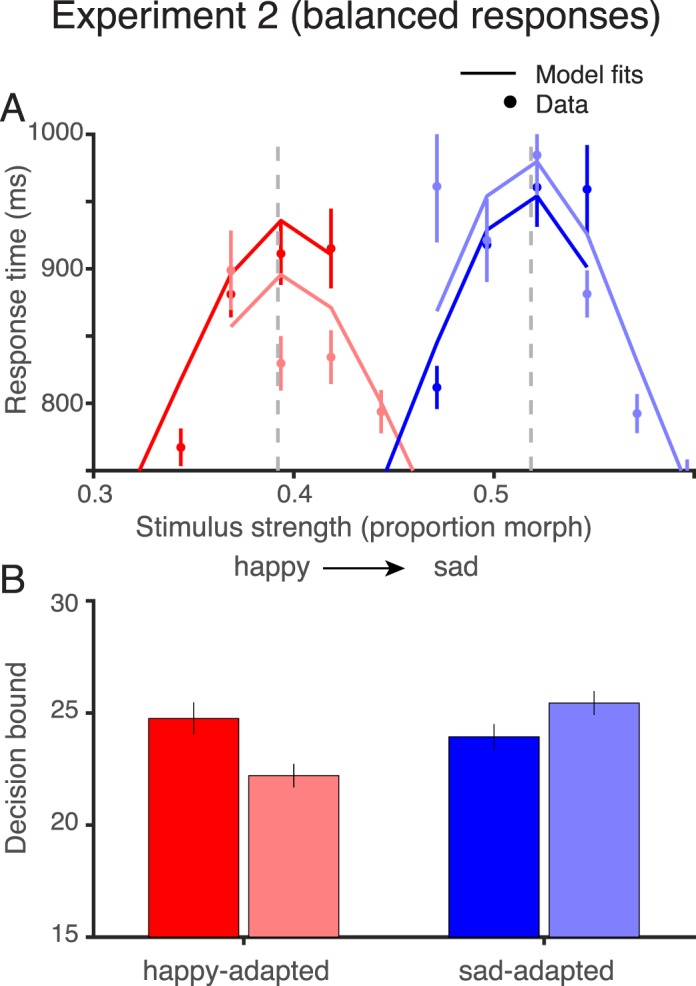
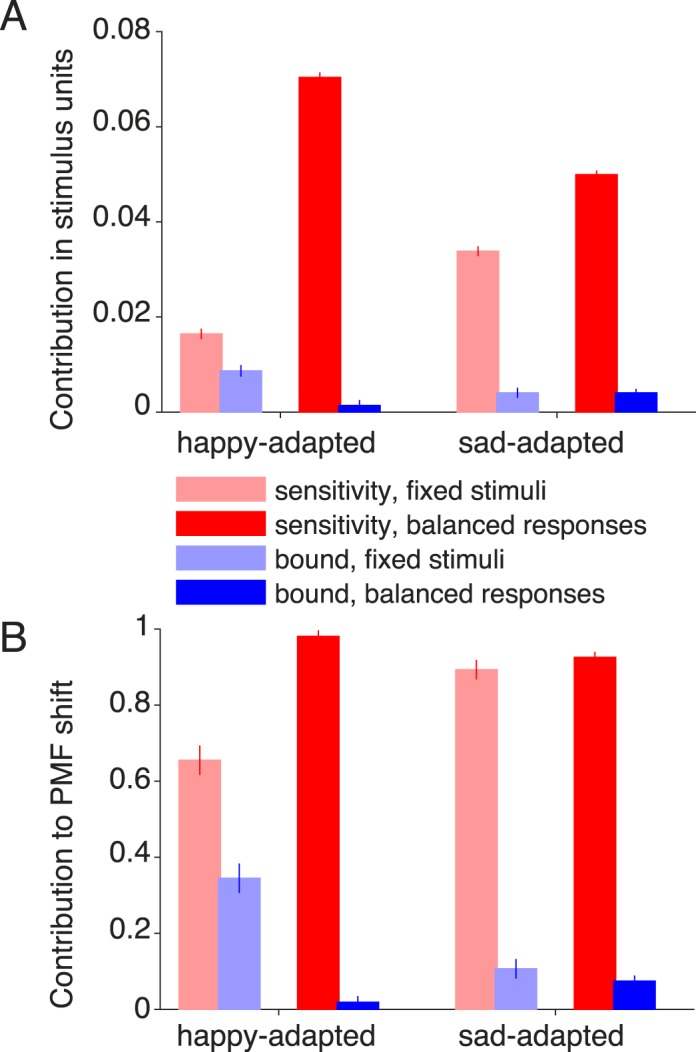
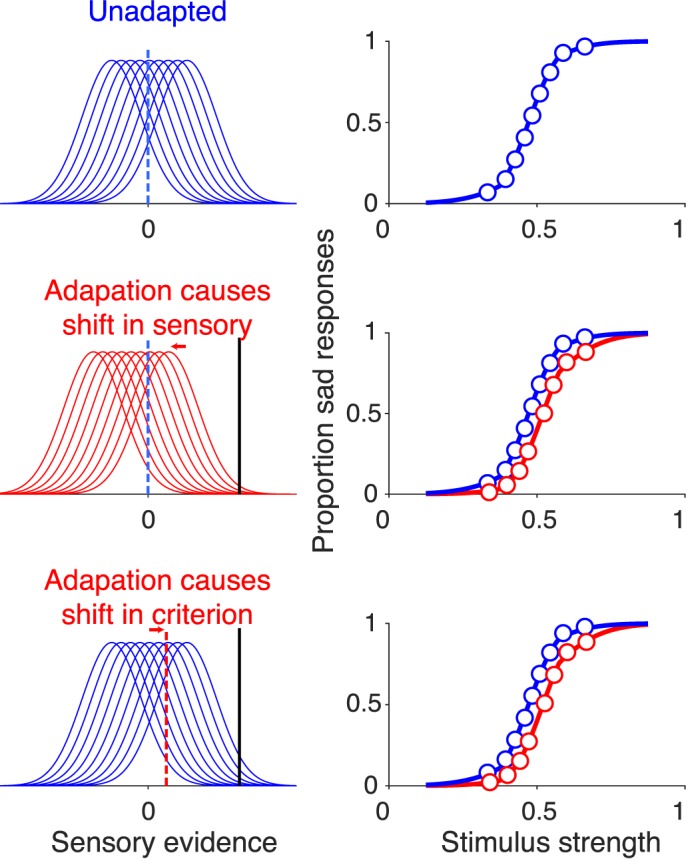
Perceptual systems adapt to their inputs. As a result, prolonged exposure to particular stimuli alters judgments about subsequent stimuli. This phenomenon is commonly assumed to be sensory in origin. Changes in the decision-making process, however, may also be a component of adaptation. Here, we quantify sensory and decision-making contributions to adaptation in a facial expression paradigm. As expected, exposure to happy or sad expressions shifts the psychometric function toward the adaptor. More surprisingly, response times show both an overall decline and an asymmetry, with faster responses opposite the adapting category, implicating a substantial change in the decision-making process. Specifically, we infer that sensory changes from adaptation are accompanied by changes in how much sensory information is accumulated for the two choices. We speculate that adaptation influences implicit expectations about the stimuli one will encounter, causing modifications in the decision-making process as part of a normative response to a change in context.


Figures

Figure 1
Figure 1
Stimulus set and procedure for Experiment 1. (A) Stimulus morph line from happy to sad. The end points, stim-0 and stim-1 were the two adapting stimuli, and defined the range from happy to sad. The intermediate stimuli smoothly transitioned between the two emotional expressions. (B) Trial structure. The participant viewed the adapting stimulus for 30 s at the start of each block, fixating the black cross. After a 0.5-s delay, the test stimulus was presented, scaled down by 50%, and remained on the screen until the participant made a key press to indicate a sad or happy facial expression. Each block consisted of 110 trials, with each trial testing one of 11 stimuli that spanned the morph line. After the first trial, the participant viewed the same adapting stimulus, but for 2 s rather than 30 s. The prototype stimuli were adopted from photographs of Model #18 in the MacBrain Face Stimulus Set (https://www.macbrain.org/resources.htm; the model gave permission to reprint the images in scientific journals).
Figure 2
Figure 2
Test stimuli for Experiments 1 and 2. The upper panel shows the test stimuli for Experiment 1 (fixed stimulus set). Each row shows one adaptation condition indicated by the dot colors (blue: adapt sad; red: adapt happy; black: unadapted). The test stimuli were identical for all participants and all adapting conditions. The test comprised nine equally spaced stimuli near the midpoint of our stimulus set, and two stimuli near the extremes. The middle stimuli are most useful for estimating the steep portion of the psychometric curves, and the more extreme stimuli for estimating the asymptotes. The lower panel shows the stimuli for Experiment 2 (balanced responses). These stimuli differed for each participant and each adapting condition. The stimuli were chosen in order to achieve an approximately equal probability of happy and sad responses for each participant and each adapting condition, as determined in practice blocks. To obtain balanced responses, the range of test stimuli was generally shifted towards the adapting stimulus.
Figure 3
Figure 3
Perceptual validity of the stimulus set. The unadapted condition was used to assess the validity of the stimulus set. (A) Psychometric functions from Experiments 1 (fixed stimulus set) and 2 (balanced responses) show smooth and generally monotonic patterns for each subject. (B) The psychometric functions fit to the pooled data across observers were plotted using the logit function on the y-axis rather than percent correct. If stimuli that are equally spaced on the x-axis are equally spaced perceptually, and the participant makes a decision via a diffusion process with fixed bounds, then a linear relationship is predicted. This approximately holds for the middle range of stimuli in both experiments. Linearity fails for the extreme stimuli. (C) The level of sensory evidence for each stimulus was computed from a diffusion process in which the bounds could be asymmetric. The results again show a linear relationship for the middle stimuli in both experiments.
Figure 4
Figure 4
Adaptation results from Experiment 1 (fixed stimulus set). (A) Behavioral results of Experiment 1 from group data. The psychometric function (left) shows evidence of adaptation: Adapting happy or sad increased the likelihood of responding sad or happy, respectively. The chronometric functions (right) show a shift in the direction of adaptation, peaking at the PSE. In addition, adapting to happy or sad faces reduced the response time compared to no adaptation. Fitted curves on the psychometric and chronometric functions are derived from the same drift-diffusion model fits (one fit per adaptation condition). (B) Model parameters for the three adaptation conditions. Adaptation caused a shift in the sensory evidence plots (left) in the direction of adaptation. Adaptation also caused a reduction in decision bounds (middle), with a larger reduction for sad when adapting happy, and vice versa. Positive and negative bounds in the drift-diffusion model corresponded to sad and happy choices, respectively. Finally, there was a modest reduction in nondecision time during the adaptation conditions (right).
Figure 5
Figure 5
Chronometric functions by response for Experiment 1. (A) Response times as a function of stimulus strength (x-axis), adaptation condition (happy in red, sad in blue), and choice (happy responses with darker colors; sad responses with lighter colors). The stimulus range is reduced to emphasize the data near the PSEs. The PSEs are indicated by the dashed vertical lines. Lines are model fits. (B) The absolute value of the decision bounds, with darker colors for the happy bound and lighter colors for the sad bounds, replotted from Figure 4. An asymmetry in the response time for stimuli near the PSE (upper panel) is reflected in an asymmetry in the decision bound (lower panel).
Figure 6
Figure 6
Adaptation results from Experiment 2 (balanced responses). Same as Figure 4, but for Experiment 2 in which the stimulus set was adjusted to ensure that responses were balanced in each adaptation condition.
Figure 7
Figure 7
Chronometric functions by response for Experiment 2. Same as Figure 5, but for Experiment 2. When participants adapted to the happy face (red plots) the response time was slower for happy judgments than sad judgments (upper panel), consistent with a lower bound for sad faces (lower panel). When adapting sad, the pattern was reversed, but the effect was much smaller.
Figure 8
Figure 8
Contribution of model parameters to shift in psychometric function. (A) The shifts in the psychometric functions resulting from adaptation were partitioned into the contributions from sensitivity changes and from bound changes. Each bar represents the contribution to the shift in the psychometric function attributed to one of the two types of parameters. Positive values indicate that the contribution was a shift in the direction toward the adapting stimulus. The sum of the two bars is equal to the amount that the PSE shifted, in units of stimulus strength, during happy-adapted or sad-adapted conditions compared to the unadapted condition. (B) Same as Panel A, but normalized to the total shift in the PSE so that each pair of bars sums to 1.
Figure 9
Figure 9
Adaptation from the perspective of signal detection theory. (Upper) The left panel shows hypothetical distributions of sensory evidence for nine stimulus levels in the unadapted condition. The stimuli can be thought of as the nine central stimuli in our first experiment, ranging from happy (leftmost curve) to sad (rightmost curve). The vertical dashed line is the criterion, assumed to be unbiased. On any given trial, a sensory response greater than the criterion results in a sad judgment, and lower than the criterion to a happy judgment. The proportion of sad judgments is plotted on the right, where the nine symbols correspond to the nine stimuli on the left. (Middle) Same as upper panel, but assuming that the participant has adapted to a sad stimulus (black vertical line), causing a leftward shift in sensory evidence, indicated by the red arrow and the shifted distributions, and no change in criterion. The shift in sensory evidence away from the adaptor translates to a psychometric function shifted toward the adaptor, shown as the red psychometric function on the right. (The blue psychometric function is replotted from the upper panel for comparison). (Lower) The third row is the same as the middle row, except that adaptation is assumed to shift the criterion (red dashed line) toward the adaptor, rather than shifting the internal responses away from the adaptor. This predicts a shift in the psychometric function that is identical to the shift in the middle panel.

Similar articles

Cited by

References

    1. Afraz S. R, Cavanagh P. Retinotopy of the face aftereffect. Vision Research. (2008);48(1):42–54. - PMC - PubMed
    1. Benucci A, Saleem A. B, Carandini M. Adaptation maintains population homeostasis in primary visual cortex. Nature Neuroscience. (2013);16(6):724–729. - PMC - PubMed
    1. Blake R, Hiris E. Another means for measuring the motion aftereffect. Vision Research. (1993);33(11):1589–1592. - PubMed
    1. Blakemore C, Campbell F. W. On the existence of neurones in the human visual system selectively sensitive to the orientation and size of retinal images. Journal of Physiology. (1969);203(1):237–260. - PMC - PubMed
    1. Bogacz R. Optimal decision network with distributed representation. Neural Networks. (2007);20(5):564–576. - PubMed

Publication types