Predicting ligand binding affinity using on- and off-rates for the SAMPL6 SAMPLing challenge
- PMID: 30141102
- PMCID: PMC8299730
- DOI: 10.1007/s10822-018-0149-3
Predicting ligand binding affinity using on- and off-rates for the SAMPL6 SAMPLing challenge
Abstract
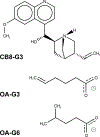
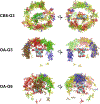
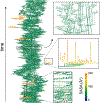
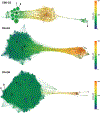
Interest in ligand binding kinetics has been growing rapidly, as it is being discovered in more and more systems that ligand residence time is the crucial factor governing drug efficacy. Many enhanced sampling methods have been developed with the goal of predicting ligand binding rates ([Formula: see text]) and/or ligand unbinding rates ([Formula: see text]) through explicit simulation of ligand binding pathways, and these methods work by very different mechanisms. Although there is not yet a blind challenge for ligand binding kinetics, here we take advantage of experimental measurements and rigorously computed benchmarks to compare estimates of [Formula: see text] calculated as the ratio of two rates: [Formula: see text]. These rates were determined using a new enhanced sampling method based on the weighted ensemble framework that we call "REVO": Reweighting of Ensembles by Variance Optimization. This is a further development of the WExplore enhanced sampling method, in which trajectory cloning and merging steps are guided not by the definition of sampling regions, but by maximizing trajectory variance. Here we obtain estimates of [Formula: see text] and [Formula: see text] that are consistent across multiple simulations, with an average log10-scale standard deviation of 0.28 for on-rates and 0.56 for off-rates, which is well within an order of magnitude and far better than previously observed for previous applications of the WExplore algorithm. Our rank ordering of the three host-guest pairs agrees with the reference calculations, however our predicted [Formula: see text] values were systematically lower than the reference by an average of 4.2 kcal/mol. Using tree network visualizations of the trajectories in the REVO algorithm, and conformation space networks for each system, we analyze the results of our sampling, and hypothesize sources of discrepancy between our [Formula: see text] values and the reference. We also motivate the direct inclusion of [Formula: see text] and [Formula: see text] challenges in future iterations of SAMPL, to further develop the field of ligand binding kinetics prediction and modeling.
Keywords: Binding affinity; Kinetics; Molecular dynamics; REVO; Rare events; SAMPL6; WExplore; Weighted ensemble.
Figures


Similar articles
-
The SAMPL6 SAMPLing challenge: assessing the reliability and efficiency of binding free energy calculations.J Comput Aided Mol Des. 2020 May;34(5):601-633. doi: 10.1007/s10822-020-00290-5. Epub 2020 Jan 27. J Comput Aided Mol Des. 2020. PMID: 31984465 Free PMC article.
-
Detailed potential of mean force studies on host-guest systems from the SAMPL6 challenge.J Comput Aided Mol Des. 2018 Oct;32(10):1013-1026. doi: 10.1007/s10822-018-0153-7. Epub 2018 Aug 24. J Comput Aided Mol Des. 2018. PMID: 30143917
-
Overview of the SAMPL6 host-guest binding affinity prediction challenge.J Comput Aided Mol Des. 2018 Oct;32(10):937-963. doi: 10.1007/s10822-018-0170-6. Epub 2018 Nov 10. J Comput Aided Mol Des. 2018. PMID: 30415285 Free PMC article.
-
The SAMPL4 host-guest blind prediction challenge: an overview.J Comput Aided Mol Des. 2014 Apr;28(4):305-17. doi: 10.1007/s10822-014-9735-1. Epub 2014 Mar 6. J Comput Aided Mol Des. 2014. PMID: 24599514 Free PMC article. Review.
-
Predicting Binding Free Energies: Frontiers and Benchmarks.Annu Rev Biophys. 2017 May 22;46:531-558. doi: 10.1146/annurev-biophys-070816-033654. Epub 2017 Apr 7. Annu Rev Biophys. 2017. PMID: 28399632 Free PMC article. Review.
Cited by
-
Local Ion Densities can Influence Transition Paths of Molecular Binding.Front Mol Biosci. 2022 Apr 26;9:858316. doi: 10.3389/fmolb.2022.858316. eCollection 2022. Front Mol Biosci. 2022. PMID: 35558558 Free PMC article.
-
Gaussian-Accelerated Molecular Dynamics with the Weighted Ensemble Method: A Hybrid Method Improves Thermodynamic and Kinetic Sampling.J Chem Theory Comput. 2021 Dec 14;17(12):7938-7951. doi: 10.1021/acs.jctc.1c00770. Epub 2021 Nov 30. J Chem Theory Comput. 2021. PMID: 34844409 Free PMC article.
-
Accurate Characterization of Binding Kinetics and Allosteric Mechanisms for the HSP90 Chaperone Inhibitors Using AI-Augmented Integrative Biophysical Studies.JACS Au. 2024 Apr 1;4(4):1632-1645. doi: 10.1021/jacsau.4c00123. eCollection 2024 Apr 22. JACS Au. 2024. PMID: 38665669 Free PMC article.
-
Wepy: A Flexible Software Framework for Simulating Rare Events with Weighted Ensemble Resampling.ACS Omega. 2020 Dec 2;5(49):31608-31623. doi: 10.1021/acsomega.0c03892. eCollection 2020 Dec 15. ACS Omega. 2020. PMID: 33344813 Free PMC article.
-
Structure-based drug repurposing: Traditional and advanced AI/ML-aided methods.Drug Discov Today. 2022 Jul;27(7):1847-1861. doi: 10.1016/j.drudis.2022.03.006. Epub 2022 Mar 14. Drug Discov Today. 2022. PMID: 35301148 Free PMC article. Review.
References
-
- De Ruiter A, Oostenbrink C (2011) Free energy calculations of protein-ligand interactions. Curr Opion Chem Biol 15(4):547–552 - PubMed
-
- Gapsys V, Michielssens S, Peters JH, de Groot BL, Leonov H (2015) Calculation of binding free energies. Methods Mol Biol (Clifton, NJ) 1215:173–209 - PubMed
-
- Geballe MT, Skillman AG, Nicholls A, Guthrie JP, Taylor PJ (2010) The SAMPL2 blind prediction challenge: introduction and overview. J Comput Aided Mol Des 24(4):259–279 - PubMed
-
- Rizzi A, Shirts M, Mobley D (2018) SAMPL6. https://github.com/MobleyLab/SAMPL6/blob/master/SAMPLing_instructions.md
-
- Copeland RA (2016) The drug-target residence time model: a 10-year retrospective. Nat Rev Drug Discov 15(February):87–95 - PubMed
Publication types
MeSH terms
Substances
Grants and funding
LinkOut - more resources
Full Text Sources
Other Literature Sources
Miscellaneous

