. 2018 Aug 24;14(8):e1007607.
doi: 10.1371/journal.pgen.1007607. eCollection 2018 Aug.

Identification of expression quantitative trait loci associated with schizophrenia and affective disorders in normal brain tissue

Affiliations

Identification of expression quantitative trait loci associated with schizophrenia and affective disorders in normal brain tissue

Oneil G Bhalala et al. PLoS Genet. .

Abstract

Schizophrenia and the affective disorders, here comprising bipolar disorder and major depressive disorder, are psychiatric illnesses that lead to significant morbidity and mortality worldwide. Whilst understanding of their pathobiology remains limited, large case-control studies have recently identified single nucleotide polymorphisms (SNPs) associated with these disorders. However, discerning the functional effects of these SNPs has been difficult as the associated causal genes are unknown. Here we evaluated whether schizophrenia and affective disorder associated-SNPs are correlated with gene expression within human brain tissue. Specifically, to identify expression quantitative trait loci (eQTLs), we leveraged disorder-associated SNPs identified from 11 genome-wide association studies with gene expression levels in post-mortem, neurologically-normal tissue from two independent human brain tissue expression datasets (UK Brain Expression Consortium (UKBEC) and Genotype-Tissue Expression (GTEx)). Utilizing stringent multi-region meta-analyses, we identified 2,224 cis-eQTLs associated with expression of 40 genes, including 11 non-coding RNAs. One cis-eQTL, rs16969968, results in a functionally disruptive missense mutation in CHRNA5, a schizophrenia-implicated gene. Importantly, comparing across tissues, we find that blood eQTLs capture < 10% of brain cis-eQTLs. Contrastingly, > 30% of brain-associated eQTLs are significant in tibial nerve. This study identifies putatively causal genes whose expression in region-specific tissue may contribute to the risk of schizophrenia and affective disorders.


Conflict of interest statement

The authors have declared that no competing interests exist.

Figures
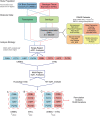
Fig 1
Fig 1. Study design for identification of multi-region brain eQTLs.
Two studies with genotype and transcriptomic data (UKBEC and GTEx) were analysed for eQTLs based on SNPs that were found to be associated with schizophrenia, bipolar disorder and major depressive disorder through 11 GWAS studies. UKBEC consisted of samples from neurologically-normal individuals; samples from individuals with neurological disease (see Methods) were removed from GTEx prior to analyses. Single-region eQTL analyses were performed for each study and brain region using Matrix eQTL. Next, multi-region eQTL analyses were performed using two methods: (1) the R package meta and (2), the MT-eQTL analysis package. Intersection of these results yielded the list of multi-region meta-analysis eQTLs for UKBEC (pukbec), GTEx (pgtex) and UKBEC+GTEx (pmeta). Results from UKBEC+GTEx were further analysed in the study, including permutation analysis. CRBL, cerebellum; FCTX, frontal cortex; HIPP, hippocampus; PUTM, putamen.
Fig 2
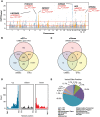
Fig 2. Manhattan plot and effect predictions of multi-region meta-analysis cis-eQTLs.
A,–log10(pmeta) are plotted for cis-eQTLs identified in a multi-region meta-analysis of eight brain regions from UKBEC and GTEX (Fig 1, analysis C). Top eGenes associated with these eQTLs are provided, along with the associated cis-eQTL and pmeta. Solid red line denotes threshold at which FDR = 0.05. Dashed red line denotes threshold at which p-value < pbonferroni (S4 Table). B, C, Overlap of cis-eQTLs and eGenes, respectively, between UKBEC+GTEx, UKBEC and GTEx with pmeta/ukbec/gtex < pbonferroni. D, Frequency of cis-eQTLs with respect to distance from associated eGene TSS (transcription start site) and TES (transcription end site). E, SNP effect prediction (from Ensembl Variant Effect Predictor) for 2,224 high-confidence cis-eQTLs.
Fig 3
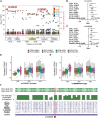
Fig 3. Mapping and gene expression effects of CHRNA5 associated eQTLs.
A, LocusZoom plot for the most significant cis-eQTL (rs12438181) identified in the multi-region meta-analysis of UKBEC and GTEx (Fig 1, analysis C; Table 1). This SNP is cis to CHRNA5, denoted in yellow highlight. rs16969968, the cis-eQTL leading to a missense mutation in CHRNA5, is also identified. Other SNPs that are within the study and cis to CHRNA5 are plotted for their pmeta (left y-axis) and LD-value (r2 denoted by colour of circle, calculated as relative to rs12438181). Recombination rate of genomic region is plotted in red. B, C, Summarized forest plots of random effects meta-analysis for rs12438181 and rs16969968, respectively. D, E, Boxplot of gene expression levels (normalised separately for UKBEC and GTEx per region) by genotype of the rs12438181 and rs16969968 eQTLs, respectively. Vertical lines for each plot capture data between -1.5 x interquartile rage and 1.5 x interquartile range, with outliers depicted as black points. The number of individuals with a particular genotype ordered by the illustrated study-regions for rs12438181 were GG: 5/5/5/5/6/4/4/6, GA: 41/40/33/34/29/23/21/21, AA: 84/81/74/78/50/45/41/41. The number of individuals with a particular genotype per study-region for rs16969968 were AA: 19/17/10/14/10/5/6/4, AG: 61/57/56/55/29/25/22/24, GG: 50/52/46/48/47/43/38/41. F, Amino acid conservation plot for CHRNA5. Missense mutation resulting from the eQTL rs16969968 is highlighted. CRBL, cerebellum; FCTX, frontal cortex; HIPP, hippocampus; PUTM, putamen.
Fig 4
Fig 4. Overlap of multi-region meta-analysis cis-eQTLs with those from non-brain tissues.
A-C, Venn diagrams for number of distinct and overlapping cis-eQTLs between multi-region meta-analysis (Meta, Fig 1, analysis C) and eQTLs Blood eQTL Browser (Westra Blood), GTEx whole blood tissue (GTEx Blood) and GTEx Tibial Nerve, respectively. D-F, Scatterplot of beta z-scores of Meta and Westra Blood, GTEx Blood and GTEx Tibial Nerve, respectively. Points are coloured by the cis-eQTL p- and FDR-values from the y-axis analyses. pb-meta is the Bonferroni correction threshold for pmeta.

References

    1. WHO. Mental Disorders: World Health Organization; 2014 [cited 2015 23 September]. http://www.who.int/mediacentre/factsheets/fs396/en/.
    1. Murray CJ, Vos T, Lozano R, Naghavi M, Flaxman AD, Michaud C, et al. Disability-adjusted life years (DALYs) for 291 diseases and injuries in 21 regions, 1990–2010: a systematic analysis for the Global Burden of Disease Study 2010. Lancet. 2012;380(9859):2197–223. 10.1016/S0140-6736(12)61689-4 . - DOI - PubMed
    1. Uher R. Gene-environment interactions in severe mental illness. Front Psychiatry. 2014;5:48 10.3389/fpsyt.2014.00048 . - DOI - PMC - PubMed
    1. Schizophrenia Psychiatric Genome-Wide Association Study Consortium. Genome-wide association study identifies five new schizophrenia loci. Nat Genet. 2011;43(10):969–76. 10.1038/ng.940 . - DOI - PMC - PubMed
    1. Ripke S, O’Dushlaine C, Chambert K, Moran JL, Kahler AK, Akterin S, et al. Genome-wide association analysis identifies 13 new risk loci for schizophrenia. Nat Genet. 2013;45(10):1150–9. 10.1038/ng.2742 . - DOI - PMC - PubMed

Publication types