. 2018 Aug 24;19(1):125.
doi: 10.1186/s13059-018-1486-1.

HiGlass: web-based visual exploration and analysis of genome interaction maps

Affiliations

HiGlass: web-based visual exploration and analysis of genome interaction maps

Peter Kerpedjiev et al. Genome Biol. .

Abstract

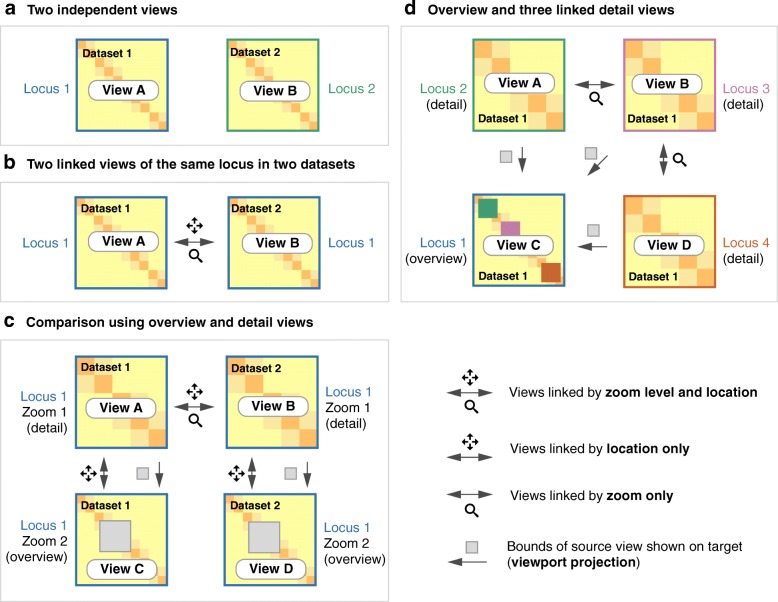
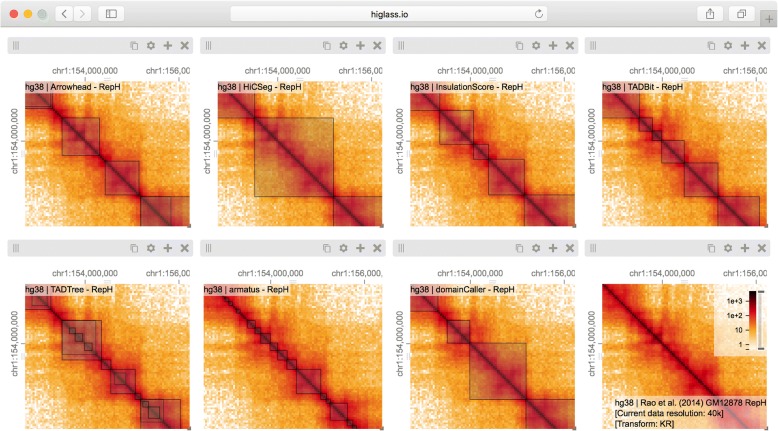
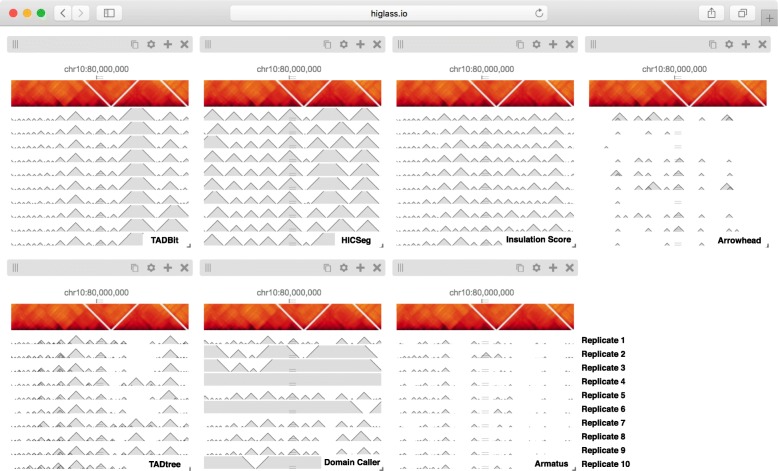
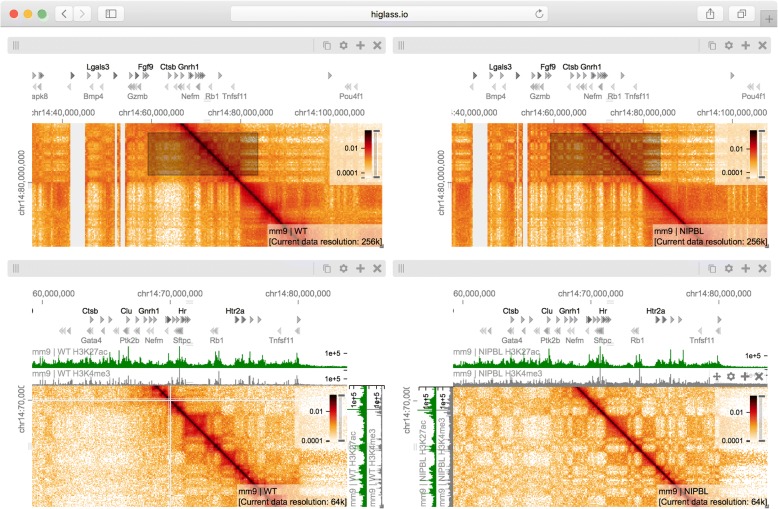
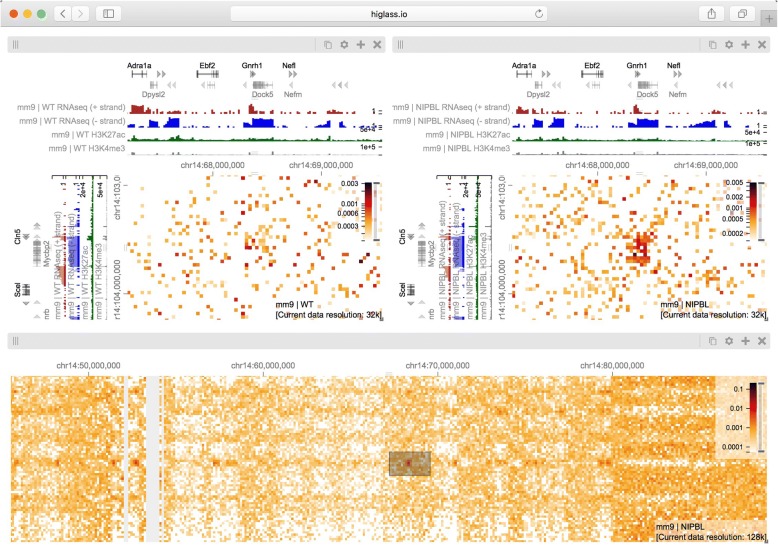
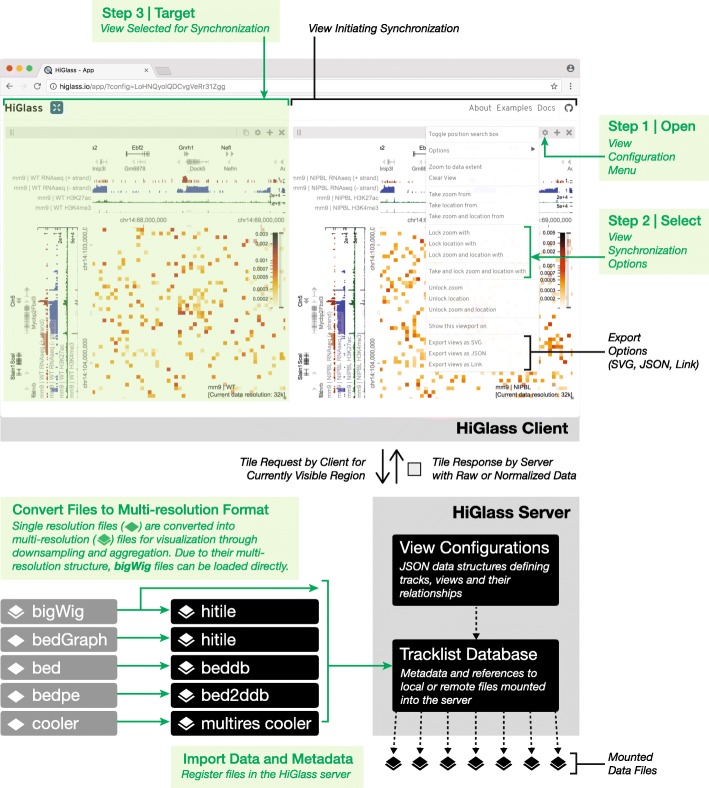
We present HiGlass, an open source visualization tool built on web technologies that provides a rich interface for rapid, multiplex, and multiscale navigation of 2D genomic maps alongside 1D genomic tracks, allowing users to combine various data types, synchronize multiple visualization modalities, and share fully customizable views with others. We demonstrate its utility in exploring different experimental conditions, comparing the results of analyses, and creating interactive snapshots to share with collaborators and the broader public. HiGlass is accessible online at http://higlass.io and is also available as a containerized application that can be run on any platform.

Keywords: Chromosome conformation; Data visualization; Genomics; Hi-C.


Conflict of interest statement

Ethics approval and consent to participate

Not Applicable.

Consent for publication

Not Applicable.

Competing interests

The authors declare that they have no competing interests.

Publisher’s Note

Springer Nature remains neutral with regard to jurisdictional claims in published maps and institutional affiliations.

Figures

Fig. 1
Fig. 1
Different ways that views can be linked. Multiple views of the same (b) or different datasets (a, c) can be composed and linked to facilitate data exploration and comparison. Two independent views of different samples provide free and independent exploration of each sample (a). Linking by zoom and location enforces the same scale and location in both samples (b). Zoom linking maintains the same scale while allowing free independent manipulation of the location (d). By linking location and leaving zooming free, one set of views can show an overview of a high resolution region (c). Displaying the extent of one view in another is referred to as a viewport projection in this manuscript and shows where a detail view is located in an overview (c, d). The process of linking views is illustrated in Fig. 6
Fig. 2
Fig. 2
Eight views linked by location and zoom (Additional file 1: Figure S3). Each view shows the calls made by a single TAD caller overlaid on the matrix on which they were called. There is little consistency between the results of the different callers and large variation in the size of the TADs. The last view (bottom right) shows a matrix with no overlay. An interactive version of this figure is available at http://higlass.io/app/?config=IPCHmdOQR4CDY2sqj5VJHQ
Fig. 3
Fig. 3
The seven views shown here show tracks in a horizontal configuration at the same location and zoom level (Additional file 1: Figure S4). Each view shows the output of a particular TAD caller (Arrowhead, HiCseg, InsulationScore, TADBit, TADtree, Domain Caller, and Armatus, from left to right, top to bottom). Each of the bottom tracks shows the output for a single replicate. The matrix on top contains data from a combination of all replicates. An interactive version of this figure is available at http://higlass.io/app/?config=JALHH-HzQGeJCaJaU9EwTA. The caller names and replicate labels were added for clarity
Fig. 4
Fig. 4
A view composition highlighting the results from Schwarzer et al. [33] with data from WT (left), and mutant (ΔNipbl, right) samples. The top two views are linked to each other by zoom and location such that they always display the same region at the same resolution. Comparing the control (left) and mutant (right) condition at this zoom level reveals the bleaching of TADs in the gene-poor region in the lower right hand part of the maps. The bottom two views, also linked to each other by zoom and location, show a zoomed in perspective where a more fragmented compartmentalization of the ΔNipbl mutant (right) compared to WT (left) can be seen. The black rectangles in the top views, which are referred to as viewport projections in HiGlass, show the positions and extent of the bottom views (Additional file 1: Figure S5). The white lines in the bottom left panel are a result of bins filtered during matrix balancing. An interactive version of this figure is available at http://higlass.io/app/?config=Tf2-ublRTey9hiBKMlgzwg
Fig. 5
Fig. 5
A view composition containing two views linked by location and zoom (top) and an independent (unlinked) zoomed out overview (bottom) (Additional file 1: Figure S6). The two views on top show data from chromosome 14 (mm9) in the wild-type and ΔNipbl conditions, respectively. The bottom view shows data from the mutant condition as well as a projection of the viewport visible in the top views. The patch visible in the ΔNipbl condition (top left) is notably absent from the control (right). The gene annotations, RNAseq, H3K27me, and H3K4me3 tracks show the presence and transcription of the Dock5 and Mycbp2 genes on the minus strand as well as the presence and transcription of the Gnrh1 and Cln5 genes on the plus strand. An interactive version of this figure is available at http://higlass.io/app/?config=Q5LdNchQRLSZ_0yKsTEoiw
Fig. 6
Fig. 6
The data flow and user interface of HiGlass. Starting from the bottom-left, single resolution formats used for genomics data are converted to their multi-resolution counterparts. Files in the bigWig format, which is a native multi-resolution format, are directly converted to the hitile format compatible with HiGlass. The multi-resolution files are then loaded into the HiGlass server using a command line tool. The HiGlass client (top half) communicates with the server by issuing “tile requests” for the data that are currently visible in the user’s browser. The server responds with raw data which the client renders into vertical, horizontal, and 2D tracks. Within the client, users can zoom and pan around the data or select views with which to synchronize the location, zoom level, or both. View synchronization is initiated from one view and tied to another

References

    1. Lieberman-Aiden E, van Berkum NL, Williams L, Imakaev M, Ragoczy T, Telling A, et al. Comprehensive mapping of long-range interactions reveals folding principles of the human genome. Science. 2009;326:289–293. doi: 10.1126/science.1181369. - DOI - PMC - PubMed
    1. Dekker J, Marti-Renom MA, Mirny LA. Exploring the three-dimensional organization of genomes: interpreting chromatin interaction data. Nat Rev Genet. 2013;14:390–403. doi: 10.1038/nrg3454. - DOI - PMC - PubMed
    1. Dixon JR, Selvaraj S, Yue F, Kim A, Li Y, Shen Y, et al. Topological domains in mammalian genomes identified by analysis of chromatin interactions. Nature. 2012;485:376–380. doi: 10.1038/nature11082. - DOI - PMC - PubMed
    1. Nora EP, Lajoie BR, Schulz EG, Giorgetti L, Okamoto I, Servant N, et al. Spatial partitioning of the regulatory landscape of the X-inactivation centre. Nature. 2012;485:381–385. doi: 10.1038/nature11049. - DOI - PMC - PubMed
    1. Rao SSP, Huntley MH, Durand NC, Stamenova EK, Bochkov ID, Robinson JT, et al. A 3D map of the human genome at kilobase resolution reveals principles of chromatin looping. Cell. Elsevier. 2014;159:1665–1680. - PMC - PubMed

Publication types

LinkOut - more resources